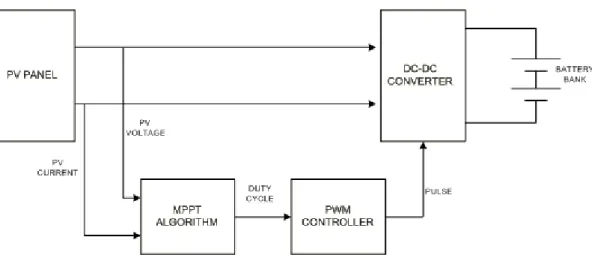
A complete PV system equipped with maximum power point tracking (MPPT) system includes a solar panel, MPPT algorithm and a DC-DC converter topology. The simulated results of the complete PV system show that the performances of the PV panel using the improved two-stage MPPT algorithm provides better steady-state and fast transient characteristics when compared with the conventional step-up conductance method.
INTRODUCTION
- Photovoltaic systems
- Background and Motivation
- Stand-alone Photovoltaic Simulation System Used
- Objectives, Methodology and Scope of the Study
- Outline of the thesis
Chapter three is about modeling and simulating the PV panel via Matlab m-files and Simulink blocks. Finally, chapter seven presents conclusions regarding the simulated results of the study to demonstrate the reasons for the choice of the MPPT algorithm used in the entire PV system.
![Figure 1-1 : Applications of PV Systems [2]](https://thumb-ap.123doks.com/thumbv2/pubpdfnet/10643381.0/16.892.147.753.103.614/figure-1-1-applications-pv-systems-2.webp)
LITERATURE SURVEY
Introduction
The load impedance Rload and the input impedance of the converter, as seen by the PV panel's Ropt, rarely match. The location of the MPP on the I-V characteristic is not known a priori and varies in an unpredictable manner according to changes in atmospheric conditions.
Performance criteria of MPPT control algorithms
- Dynamic Response
- Steady state error
- Tracking Efficiency
MPPT control algorithms classification
In contrast, the real search methods are able to actually obtain maximum power when variations in weather conditions occur. PO and IC are two-variable methods because they require the measurement of two variables to calculate the maximum power and PV output voltage and current, while SC and CV methods use only one variable to calculate the PV output current or -to regulate voltage.
Simple Panel-load matching
Semi-dynamic load matching
Voltage feedback methods
- Voltage feedback with fixed reference voltage
- Voltage feedback with varying reference voltage by measurement of Voc
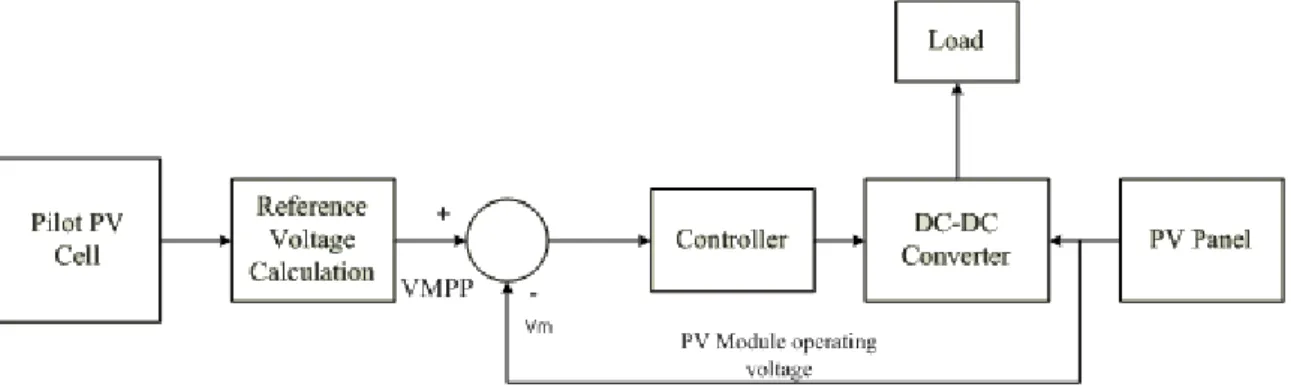
- Pilot cell /reference module measurement approach
The constant voltage MPPT algorithm used here samples the operating voltage of the panel instantaneously with a specific frequency by turning off the inverter. In this approach, the operating voltage setpoint provides the reference information needed for the MPP to overcome the problem of opening the PV module which leads to wasted energy during frequent interruptions of the system operation for Voc measurement.
Power feedback control methods
- Perturb and Observe Control Algorithm
- Working Principle
- Analysis of the PO algorithm
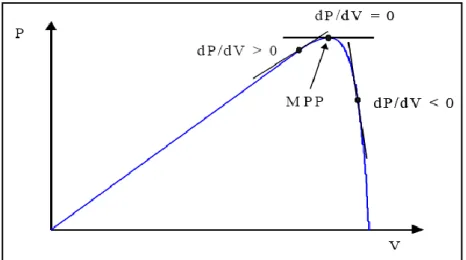
- Incremental Conductance Control Algorithm
- Working Principle
- Analysis of the IC algorithm
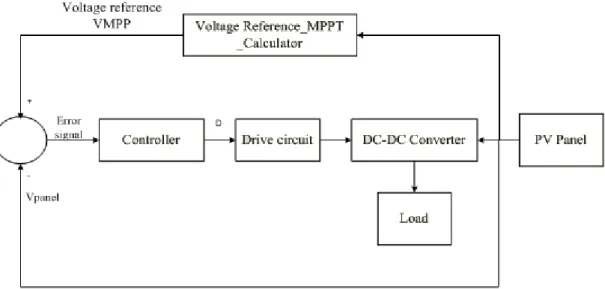
- Block diagram of the MPPT control system
When the operating point is to the right of the MPP, the PO will work in the opposite direction, lowering the voltage; this results in an increase in power output. The detailed working principle of the IC algorithm can be understood by the flow chart below.
Optimization solutions of MPPT control methods
Milosevic [18] proposed a modified version of the PO algorithm to counteract oscillations around the MPP without reducing the increment (or step size) of the algorithm. Shen [21] proposes a modified PO method to improve the shortcomings of the previous PO MPPT algorithm.
Conclusion
Evaluating the responses of inverter topologies connecting PV and load for an MPPT system to facilitate the selection of the best chopper for a PV system. This is based on steady state analysis and dynamic analysis as discussed by Xiao [26] and allows the selection of the best chopper for a particular PV configuration system.
PHOTOVOLTAIC MODELS
- Introduction
- Mathematical Model of PV cell
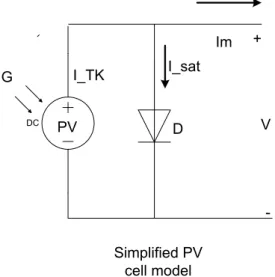
- Simple PV cell model
- Double exponential diode model
- Single appropriate diode model
- PV Simulated Results
- Conclusion and Discussion
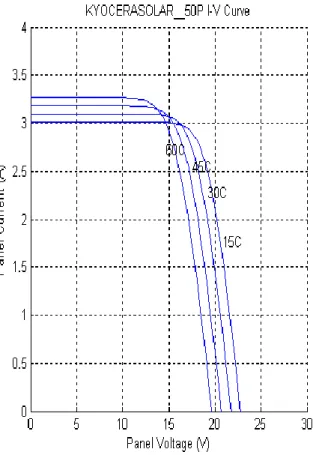
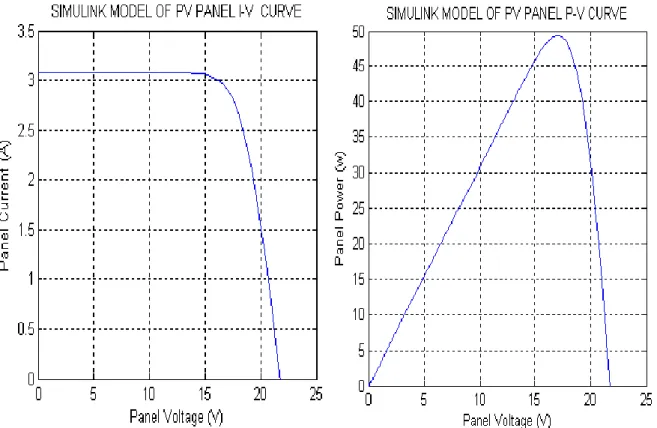
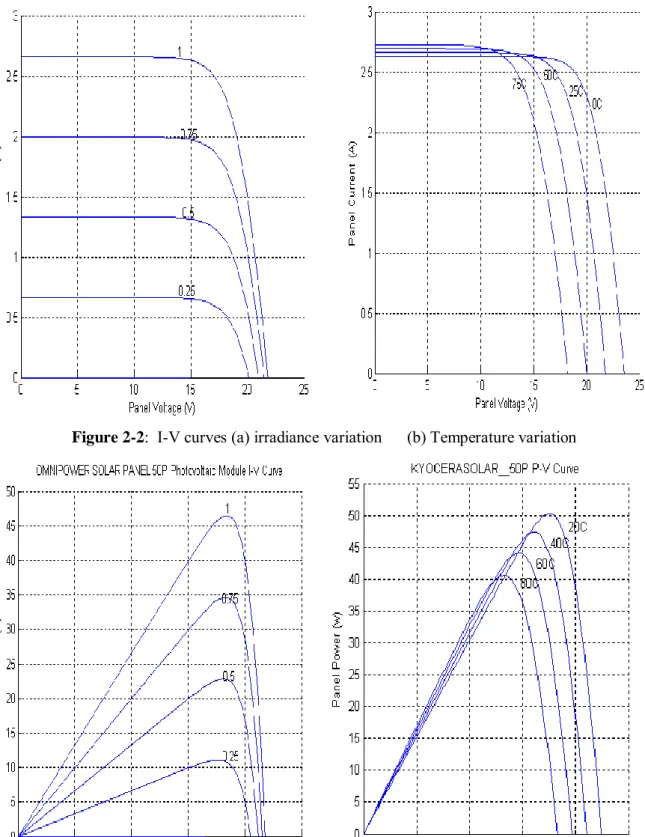
Im I_TK I_reveqV/kTK 1 (3.3) The output current Im has the same value either for the panel or the cell (cells are connected in series in the solar panel). Accounting for these additional elements, equation 3.3 for the output current Im can be written as follows: From Figures 3-6 and 3-9, it can be observed that increasing the solar irradiance G also raises the output current of the panel as well as the output power, while T remains unchanged.
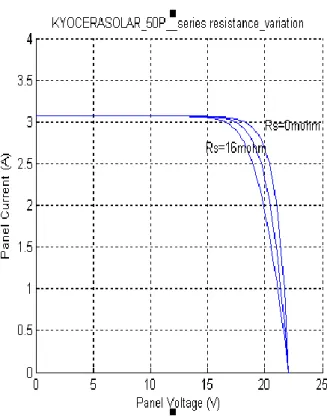
From Figure 3-10, it can be clearly seen that the series resistance Res of the model significantly affects the slope of the I-V characteristic at V=Voc. It can be concluded that the single diode Matlab & Simulink PV model gives successful simulated results as expected and validates the electrical characteristics given in the manufacturer's data sheet.
MAXIMUM POWER POINT TRACKING ALGORITHM MODELS
- Introduction
- Perturb and Observe (PO) Algorithm
- Perturb and Observe modified version 1(MPO) Algorithm
- Perturb and Observe modified version 2 or EPP Algorithm
- Incremental Conductance (IC) Algorithm
- Two-stage combined CV and IC Algorithm
- Average Output Power and Tracking Efficiency of MPPT Algorithms
- Discussion and Analysis
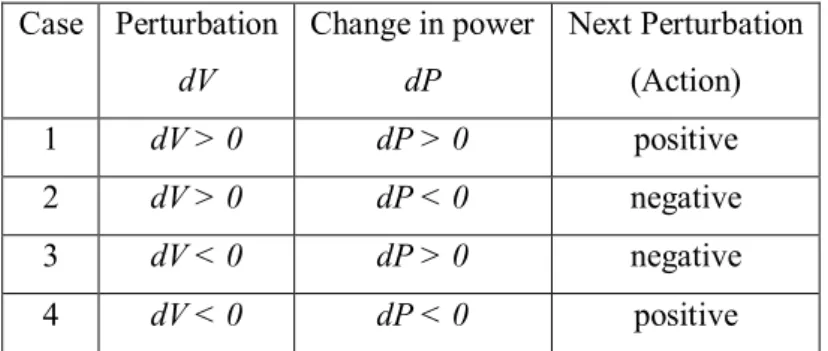
According to the PO algorithm shown in Figure 4-2, the power is sequentially calculated in the previous and current states using voltage and current measurements. Finally, a decision is made to increase or decrease the voltage depending on whether the voltage change is positive or negative. According to the MPO algorithm, as shown in Figure 4-5, power is calculated using voltage and current measurements.
According to EPP algorithm shown in Figure 4-8, the power is calculated using voltage and current measurements. Matlab script codes for the IC algorithm are written according to the flowchart shown in Figure 4-11 and the details are provided in appendix B.
![Figure 4-1: Measurement of cloudy and sunny irradiation data in Upington, South Africa, 1966 [37]](https://thumb-ap.123doks.com/thumbv2/pubpdfnet/10643381.0/59.918.188.733.477.900/figure-measurement-cloudy-sunny-irradiation-upington-south-africa.webp)
DC-DC CONVERTER TOPOLOGY AND INTERFACE ANALYSIS
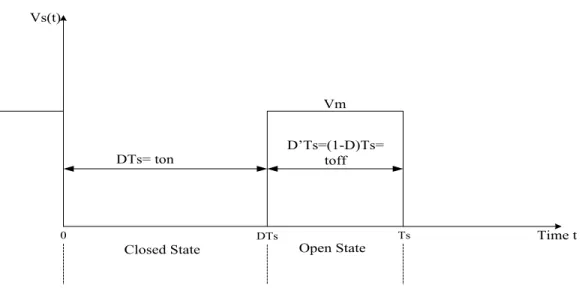
Switch-Mode Converter Theory
The switch control signal required in the PWM method is used to control the opening or closing of the switch. A sawtooth is a constant peak frequency of a repeating waveform that represents the switching frequency. With the help of the MPPT system, the inverter can adjust its operation according to the required output voltage to find the optimal working voltage of the module.
Other designs such as Cuk and buck-boost converters are combinations of the two basic topologies. Buck and boost converters can reduce or increase the magnitude of the DC output voltage, respectively.
The Buck DC-DC Converter
- Steady-state analysis
- Dynamic analysis
Similarly, a set of equations is derived from Figure 5.4 for the 'off mode', where the switch is open during the time interval D'Ts with D'= 1-D, the complement of the duty cycle. Often the switching ripple for the capacitor voltage must be much less than 1% of the DC component of the voltage [41]. Nevertheless, in the real system, power losses occur, which are usually due to the parasitic resistance effect of the inductors and capacitors (equivalent series resistance ESR of capacitors).
A small signal AC analysis is required to obtain the dynamic model of the buck converter. The set of these last three equations is sufficient to represent the small AC signal model and describe the dynamics of the nonlinear buck converter with the parasitic resistance effect of the inductor.

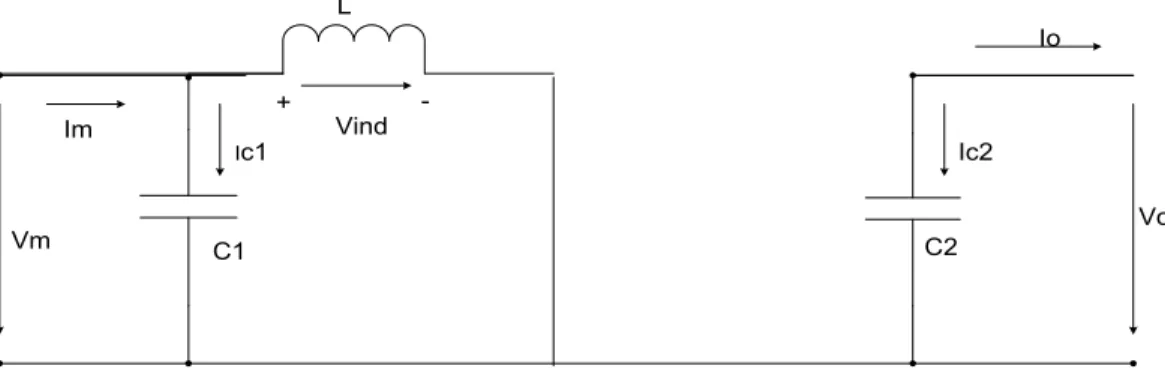
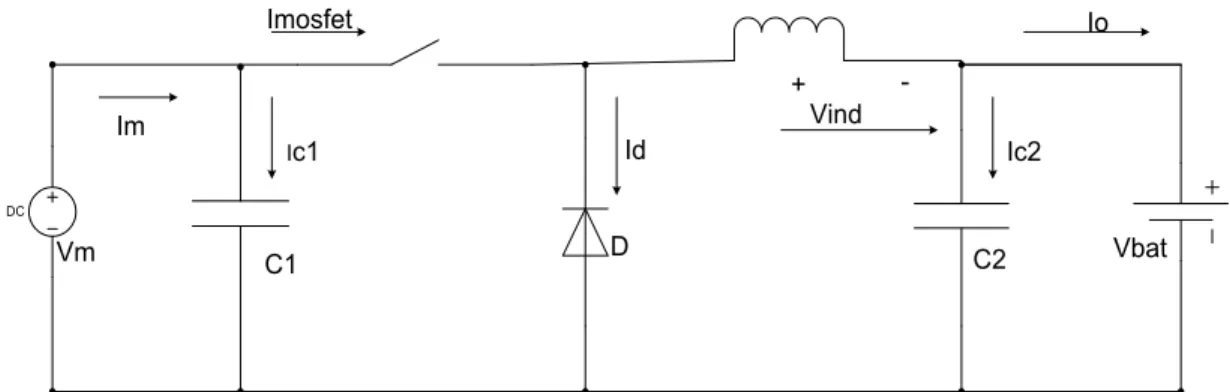
The Boost DC-DC Converter
- Steady-state analysis
- Dynamic analysis
In order to investigate a boost converter and derive its steady-state transfer functions, the equivalent circuit representation for the "on" and "off" states must be analyzed. Similarly, for "off mode" where the switch is open during the time interval D'Ts with D', the complement of the duty cycle is seen in Figure 5-9. A small-signal AC analysis is required to obtain a dynamic model of the boost converter.
Assuming that the changes in the alternating current are much smaller than the steady-state value of the signal, and rearranging the set of equations (5.61), the system can be linearized around the quiescent operating point by neglecting second-order disturbances. These last three equations describe the dynamics of a non-ideal boost converter circuit.
Converter Topology Analysis and Comparison
- Component Comparison
- Modeling Comparison
All steady-state results related to the above expressions for the two converters are shown in the following Table 5-3. During the design process of the Mosfet driver for the power switch, the current in the buck converter is higher than in the boost converter. This means that a high-side Mosfet driver is required, which is more complex and expensive than the one used in the boost converter.
They are based on some operating parameters of the PV system and the inductance and capacitance parameters derived in table 5-3. So, the boost chopper is selected for later implementation in the Simulink model of the entire PV system.
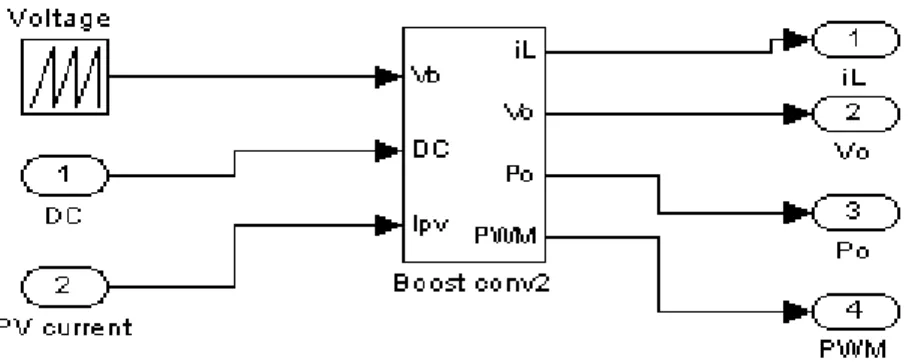
Modeling and Simulation
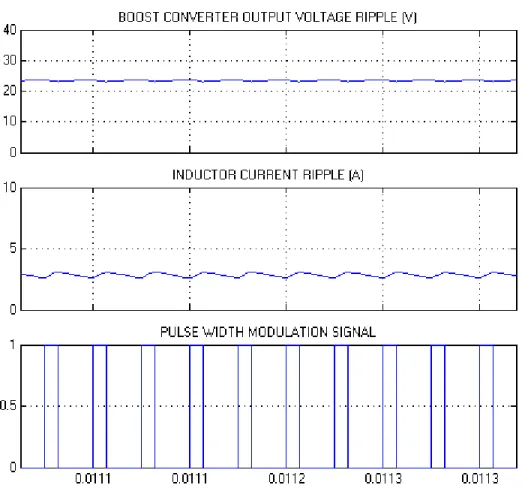
From the simulated results shown in Figure 5-18 of the boost converter model, the SimPowerSystem model validates the design specifications given in Table 5-1.
SYSTEM SIMULATION AND PERFORMANCE ANALYSIS
Complete Simulink PV system
The combined Simulink model of the PV system using two different MPPT methods is shown in Figure 6-2. To better assess the overall performance of the current PV simulation system, the combined PV model is successively subjected to fast and slow changes in solar irradiance. Using two different MPPT algorithms, the PV system is first subjected to abrupt or rapid changes in irradiance to represent the behavior of both MPPT algorithms used in the Simulink model of the PV system during passing of cloud cover.
The resulting boost output voltage and power waveforms can be seen in the following figures. More simulations are added by abruptly changing the shape or variation of solar radiation to confirm the previous simulated results of the combined PV system regarding the stable and dynamic behavior.
Performance analysis
Conclusion
CONCLUSIONS AND FUTURE RESEARCH
Conclusions
The duty cycle of the converter was used as a control variable, simplifying the MPPT system into a straightforward control loop when implementing it throughout the Simulink model of the PV system. In this comparative study based on steady state and dynamic analysis, the boost topology outperformed the buck converter due to its cheaper implementation and better dynamic response and was also chosen to be implemented in the entire simulation of PV Simulink system. The simulated results of the combined Simulink PV system show that the PV system model using the two-stage CV-IC algorithm generates better steady-state performances (lower power fluctuations) and faster transient responses (longer tracking shortcuts) than PV using the original conventional IC algorithm.
Thus, the PV system using the standard IC method loses more power than the two-stage CV-IC method and is less efficient. In conclusion, simulating the PV system using a two-mode CV-IC algorithm allows a reduction not only in the convergence time to track the MPP, but also in the power fluctuations.
Future research
Bohorquez, “A Reliable, Fast and Low Cost Maximum Power Point Tracking Algorithm for Photovoltaic Applications,” Science Direct, Solar Energy, November 2009. Cheung, “Implementation of Maximum Power Point Tracking Algorithm for Residential Photovoltaic Systems,” 2nd Canadian Solar Building Conference Calgary, 10 .–14. June 2007. Bae and B.H.Cho, “Constant Resistance Control of Solar Array Regulator Using Average Current Mode Control”, Australian Universities Electrical Engineering Conference APEC06, 2006.
MATLAB Code to calculate the theoretical maximum power (MPP) function according to given irradiance and temperatures. MATLAB m-files script Code to calculate the maximum operating power of the PO algorithm under atmospheric sunny conditions. MATLAB m-files script Code to calculate the maximum operating power of the IC algorithm under atmospheric sunny conditions.
MATLAB m-files script Code for calculating the maximum operating power of the modified CV-IC two-mode algorithm under atmospheric cloudy conditions.