Measurements of gamma-ray production cross sections of proton beam at energies of 66 to
125 MeV with calcium target
by
Kunyana Ayanda
A thesis submitted in fulfillment for the degree of Master of Science
in the
Faculty of Science Department of Physics
Supervisor: Dr S.S Ntshangase Co-supervisor: Dr E.A Lawrie
April 2018
Keywords
AFRODITE Cross section Beam energy
Gamma ray (γ-ray)
i
Declaration
I, Ayanda Kunyana, hereby declare that this thesis contains my own original work, that it has not been submitted before for any degree or assessment at any other university, and that all the sources I have used or quoted have been indicated and acknowledged by means of complete references.
Signature: . . . Date: . . . .
ii
”I’m a different mess than I was yesterday”
Msizi E. Nkosi
Abstract
Cosmic rays are highly energetic charged particles not produced on Earth. Primary cosmic rays are composed mainly of protons, alpha particles and nuclei of many heavier elements. Secondary cosmic rays including neutrons, pions, positrons, and muons are created following the interaction of primary cosmic rays with atmo- sphere. A lot of radioisotopes are formed by interactions with cosmic rays. Most cosmogenic isotopes are formed in the atmosphere, while some are formed in-situ in soil and rock exposed to cosmic rays. One of the most important isotopes pro- duced by interaction of secondary cosmic rays with 40Ca is 41Ca. It is formed by 40Ca(n, γ)41Ca nuclear reaction. Worthy to note that 40Ca is one of the most abundant element in the Earth’s crust. However, what would happen if instead of a neutron a proton interacts with the calcium nucleus? This study investi- gates the excitations of 40Ca following interactions with high-energy protons in
40Ca(p, p0γ)40Ca reaction. We use the information carried out by the γ-rays dur- ing the de-excitation of the 40Ca nucleus to calculate the γ-ray production cross sections, which relate to the probability of the 40Ca(p, p0γ)40Ca reaction to occur.
This helps to gain information about the processes that occur in the stars and in the interstellar space, see section 1.3.2.
Similar reactions take place when a high-energy protons interact with calcium in human tissues. High-energy protons can destroy cancer cells. Hence, during proton therapy, a proton beam of specific radiation dose is delivered to the tumor while sparing the nearby healthy tissues. Without continuous monitoring of the delivered proton beam, this can turn into a disaster. To fully enjoy the benefits of proton therapy we need to monitor the dose deposition. During the treatment, the proton beam delivered is absorbed by the patient. The only way to get the in-vivo dose verification measurements is by using secondary radiation. Using the information from the detection of secondary promptγ-rays helps to determine the location of the deposited dose since the two are mutually related.
The aim of this research is to evaluate the promptγ-ray production cross sections, measured for strong γ-ray lines excited in the proton bombardment of a calcium target. The first part of this study was to experimentally measure the γ-ray
iv
production cross sections for proton-nucleus collisions in calcium. To achieve these cross section measurements, thin natural calcium targets were bombarded with a proton beam in the energy range of 66 M eV to 125 M eV delivered by the Separated Sector Cyclotron (SSC) at iThemba LABS.
Three standard γ-ray emitting sources, 137Cs, 60Co and 152Eu, were used for en- ergy and efficiency calibrations of the detectors. Geant4 code was run for modeling the efficiency of the AFRODITE detector system forEγ >1.4M eV. The emitted γ-rays were detected with the high-purity Ge detectors of the AFRODITE array in the angular range of 90◦ to 168◦. The total cross sections for the 754.8keV and the 3736.5 keV peaks were determined by fitting the angular distribution data with Legendre polynomials. We extracted for the first time the total cross section excitation functions for the 40Ca(p, p0γ)40Ca reaction for two γ-rays in 40Ca at five different energies (66, 80, 95, 110 and 125 M eV). The results from these measurements can be used in a range of applications in radiation therapy, geology and astrophysics.
Acknowledgements
I would like to thank the Mighty one, God, the source of all life, for strength, knowledge and inspiration.
I would also like to express my sincere gratitude to my supervisors Dr. Elena Lawrie and Dr. Sifiso Ntshangase. Thank you for your never ending support, en- courangement and guidance throughout the duration of this project. I am grateful to have worked with both of you, and I hope this may continue. They have always made time for discussions and have guided me past many difficulties throughout this thesis. I also thank them for giving me the opportunity to embark on such a fascinating journey.
My gratitude also goes to the following people for their contributions:
• Walid Yahia-cherif, thank you for all the interactions and guidance since the beginning of my MSc. I am most grateful for your help in theory discussions, experimental analysis and allowing me to use your codes for my data analysis.
I owe you so much that it is difficult to express my sincere gratitude, thanks buddy.
• The people who made sure the experiments went smoothly by doing extraor- dinary setting up and data taking: Dr. E. Lawrie, Dr. J.J. Lawrie, Dr. J.
Kiener, Prof. S. Ouichaoui, Prof. A. Belhout, Dr. P. Jones, Dr. D. Moussa, Prof. H. Benhabiles, Prof. S. Damache, Prof. A. Chafa, Mr. W. Yahia- Cherif, Mr. M. Debabi, Dr. I. Deloncle, Dr. T.S. Dinoko, Dr. T.D. Bucher, Dr. M.K. Raju, Dr. V. Ramanathan, Ms. B. Rebeiro, Ms. N. Kheswa. I really appreciate your time and effort.
• Thanks to all the Masters and PhD students that I have interacted with for your support and encourangement.
• Thanks to the National Research Foundation and University of Zululand Research committee for providing funding.
• I would also like to thank the department of physics administration at the Universities of Zululand and of the Western Cape.
Last but not least, I would like to give a special thanks to my family. To my grand- father Mafumbata Kunyana, grandmother Nomvula Kunyana, aunt Ntomboxolo Kunyana and my father Zolile Kunyana; if it was not for you I wouldn’t be here today. Thank you for your loving support and understanding throughout the dura- tion of this project. To my brothers and sisters, thank you for your understanding for all the times you couldn’t get my attention when I was busy looking forγ-rays.
“Enkosi kakhulu boCabe kaNcindisi kaMsiza kaZiqelekazi kaHlambangobubende”.
Contents
Keywords i
Declaration of Authorship ii
Abstract iv
Acknowledgements vi
List of Figures xi
List of Tables xix
Abbreviations xx
1 Introduction 1
1.1 Aim of the research . . . 2
1.2 Nuclear reactions . . . 3
1.3 Fields of application . . . 4
1.3.1 Medical physics: Radiation therapy . . . 4
1.3.1.1 Radiation oncology . . . 4
1.3.1.2 Rationale for proton therapy . . . 4
1.3.2 Astrophysics context . . . 6
1.3.2.1 The interaction of energy particles . . . 6
1.3.2.2 Solar γ-ray emission . . . 6
1.3.2.3 Cosmic radiation . . . 7
2 Experimental Techniques and Equipment 9 2.1 Promptγ-ray emission . . . 9
2.2 Interactions ofγ-rays with matter . . . 10
2.2.1 Photoelectric effect . . . 11
2.2.2 Compton scattering . . . 12
2.2.3 Pair Production . . . 16 viii
Contents ix
2.3 Experiments and set-ups . . . 18
2.3.1 Overview of the iThemba LABS facility. . . 18
2.3.2 AFRODITE array . . . 19
2.3.2.1 Clover detectors . . . 21
2.3.2.2 Compton suppression . . . 25
2.3.2.3 Low Energy Photon Spectrometer (LEPS) . . . 26
2.3.3 Experimental setups . . . 26
3 Experimental data and data analysis 29 3.1 Experimental cross section measurements . . . 29
3.1.1 Targets and target chamber . . . 30
3.1.2 Proton irradiation of targets . . . 30
3.2 Data acquisition. . . 31
3.3 Background subtraction . . . 31
3.4 Experimental methodology for cross section measurements . . . 32
3.4.1 Energy calibration . . . 32
3.4.2 Efficiency calibration . . . 33
3.4.3 Efficiency calculations . . . 34
3.4.4 Transition probabilities . . . 35
3.4.5 Angular distribution . . . 36
3.4.6 Differential angular distribution . . . 38
3.4.7 Total cross sections . . . 39
4 Geant4 AFRODITE modelling 40 4.1 Geant4 geometry modelling of AFRODITE . . . 40
4.2 AFRODITE Geant4 model validation . . . 44
4.3 AFRODITE simulated absolute detector efficiency with a Geant4 model . . . 44
4.4 Simulated detector efficiency calculations . . . 45
5 Cross section measurements 46 5.1 Discrete γ-ray lines from 40Ca . . . 46
5.2 Energy calibration . . . 47
5.3 Efficiency measurements . . . 50
5.4 Experimental γ-ray spectra and differential cross sections . . . 67
5.4.1 Analysis ofγ-ray spectra. . . 67
5.4.2 Differential cross sections for the 754.8 keV line . . . 68
5.4.3 Differential cross sections for the 3736.5 keV line . . . 75
5.5 Total γ-ray production cross sections measurements . . . 81
5.5.1 Results. . . 81
5.5.2 Conclusion. . . 90
6 Calculations using the Talys code 91 6.1 Introduction . . . 91
6.2 Nuclear Models . . . 91
6.2.1 Compound reactions . . . 93
6.2.2 Direct reactions . . . 93
6.2.3 Pre-equilibrium reactions . . . 93
6.3 Talys code calculation . . . 94
6.3.1 Mechanisms of nuclear reactions . . . 94
6.4 Talys simulations and comparison with the experimental results . . 95
6.4.1 Input file. . . 95
6.4.2 Total cross sections for Talys. . . 96
7 Conclusion 98
List of Figures
1.1 Depth-dose distribution for a spread-out Bragg peak (SOBP, dotted blue line), its constituent pristine Bragg peaks (solid black lines) and a 8 MV X-Rays (Source Surface Distance “SSD” = 100 cm) beam (green). The SOBP dose distribution is created by adding the individually contributions of modulated pristine Bragg peaks. . 5 1.2 The left image shows a full-disk image of the sun from Yohkoh soft
X-rays telescope. The right image magnifies a flare that occurred in the west limb. A contour map of X-ray emission observed with hard X-rays telescope is superimposed on soft X-rays intensity map (Yohkoh X-ray image of a solar flare, Jan 13, 1992). . . 7 2.1 Range of the three main processes of interaction of theγ-rays with
matter as a function of theγ-ray energy [Eva55].. . . 10 2.2 Photoelectric absorption. . . 11 2.3 Compton scattering diagram showing the interaction of the incident
photon with an electron. . . 14 2.4 A polar plot of the differential cross section dσ(θ)dΩ which is the prob-
ability for Compton scattering of γ-rays as a function of the angle [Kra87]. . . 16 2.5 Pair production.. . . 17 2.6 Layout of the Separated Sector Cyclotron facility of iThemba LABS. 19 2.7 The AFRODITE array. The target chamber with Compton sup-
pression clover detectors and LEPS detectors are visible. . . 20 2.8 The AFRODITE array with its two hemi-spheres open. The black
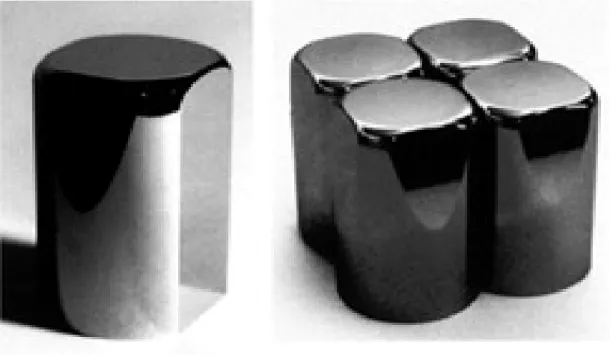
insulated pipes to the detectors dewars are used to fill them with liquid nitrogen. . . 21 2.9 A clover detector . . . 22 2.10 Schematic of the 4 HPGe crystal of a clover detector. . . 23 2.11 Left: Individual HPGe crystal. Right four: Closely packed HPGe
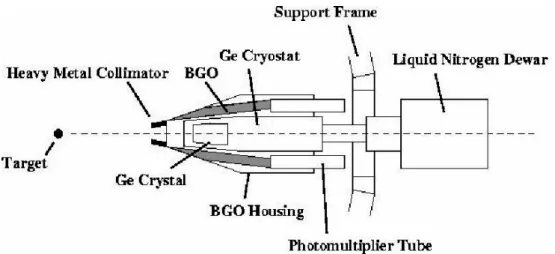
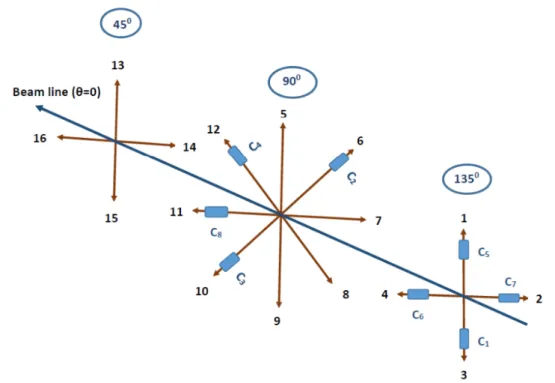
crystals in a clover detector. . . 23 2.12 Schematic cross section of a clover-BGO system. . . 26 2.13 The AFRODITE clover detector arrangement illustrating the de-
tector positions for the cross section experiment. . . 28 2.14 A schematic representation of the experimetal setup. . . 28 4.1 The complete Geant4 AFRODITE model, the setup of clovers is the
same as the setup arragement of the present AFRODITE experiment. 41 xi
4.2 The wireframe of Geant4 AFRODITE model showing the crystals in black, blue, green and red, four per each clover. . . 41 4.3 Geant4 model of closely packed germanium crystals assembled in-
side the aluminium case. . . 42 4.4 Geant4 model of the target chamber. . . 42 4.5 Gean4 model of the target ladder, also shown in the target chamber
in Figure 4.4. . . 43 4.6 Geant4 model for the clover arragements without a target chamber. 43 5.1 The energy level diagram for40Cashowing only the states of interest
for this project. . . 47 5.2 Schematic representation of two targets stacked together. . . 47 5.3 Identified photopeaks of137Cs and 60Co in the spectrum of crystal
A of clover1. For each source, 30 out of the 32 spectra were used since two crystals were not in good condition. . . 49 5.4 Identified photopeaks of 152Eu in the spectrum of crystal A of
clover1. For each source, 30 out of the 32 spectra were used since two crystals were not in good condition. . . 49 5.5 The absolute efficiency for clover A1. The red circles, black squares
and green diamonds stand for the measured absolute efficiencies for the peaks of152Eu,60Coand 137Cs, while the blue triangles denote the normalized Geant4 simulation. . . 52 5.6 The absolute efficiency for clover B1. The red circles, black squares
and green diamonds stand for the measured absolute efficiencies for the peaks of152Eu,60Coand 137Cs, while the blue triangles denote the normalized Geant4 simulation. . . 52 5.7 The absolute efficiency for clover C1. The red circles, black squares
and green diamonds stand for the measured absolute efficiencies for the peaks of152Eu,60Coand 137Cs, while the blue triangles denote the normalized Geant4 simulation. . . 53 5.8 The absolute efficiency for clover D1. The red circles, black squares
and green diamonds stand for the measured absolute efficiencies for the peaks of152Eu,60Coand 137Cs, while the blue triangles denote the normalized Geant4 simulation. . . 53 5.9 The absolute efficiency for clover A2. The red circles, black squares
and green diamonds stand for the measured absolute efficiencies for the peaks of152Eu,60Coand 137Cs, while the blue triangles denote the normalized Geant4 simulation. . . 54 5.10 The absolute efficiency for clover B2. The red circles, black squares
and green diamonds stand for the measured absolute efficiencies for the peaks of152Eu,60Coand 137Cs, while the blue triangles denote the normalized Geant4 simulation. . . 54 5.11 The absolute efficiency for clover C2. The red circles, black squares
and green diamonds stand for the measured absolute efficiencies for the peaks of152Eu,60Coand 137Cs, while the blue triangles denote the normalized Geant4 simulation. . . 55
List of Figures xiii 5.12 The absolute efficiency for clover D2. The red circles, black squares
and green diamonds stand for the measured absolute efficiencies for the peaks of152Eu,60Coand 137Cs, while the blue triangles denote the normalized Geant4 simulation. . . 55 5.13 The absolute efficiency for clover A3. The red circles, black squares
and green diamonds stand for the measured absolute efficiencies for the peaks of152Eu,60Coand 137Cs, while the blue triangles denote the normalized Geant4 simulation. . . 56 5.14 The absolute efficiency for clover C3. The red circles, black squares
and green diamonds stand for the measured absolute efficiencies for the peaks of152Eu,60Coand 137Cs, while the blue triangles denote the normalized Geant4 simulation. . . 56 5.15 The absolute efficiency for clover D3. The red circles, black squares
and green diamonds stand for the measured absolute efficiencies for the peaks of152Eu,60Coand 137Cs, while the blue triangles denote the normalized Geant4 simulation. . . 57 5.16 The absolute efficiency for clover A4. The red circles, black squares
and green diamonds stand for the measured absolute efficiencies for the peaks of152Eu,60Coand 137Cs, while the blue triangles denote the normalized Geant4 simulation. . . 57 5.17 The absolute efficiency for clover B4. The red circles, black squares
and green diamonds stand for the measured absolute efficiencies for the peaks of152Eu,60Coand 137Cs, while the blue triangles denote the normalized Geant4 simulation. . . 58 5.18 The absolute efficiency for clover C4. The red circles, black squares
and green diamonds stand for the measured absolute efficiencies for the peaks of152Eu,60Coand 137Cs, while the blue triangles denote the normalized Geant4 simulation. . . 58 5.19 The absolute efficiency for clover D4. The red circles, black squares
and green diamonds stand for the measured absolute efficiencies for the peaks of152Eu,60Coand 137Cs, while the blue triangles denote the normalized Geant4 simulation. . . 59 5.20 The absolute efficiency for clover A5. The red circles, black squares
and green diamonds stand for the measured absolute efficiencies for the peaks of152Eu,60Coand 137Cs, while the blue triangles denote the normalized Geant4 simulation. . . 59 5.21 The absolute efficiency for clover B5. The red circles, black squares
and green diamonds stand for the measured absolute efficiencies for the peaks of152Eu,60Coand 137Cs, while the blue triangles denote the normalized Geant4 simulation. . . 60 5.22 The absolute efficiency for clover C5. The red circles, black squares
and green diamonds stand for the measured absolute efficiencies for the peaks of152Eu,60Coand 137Cs, while the blue triangles denote the normalized Geant4 simulation. . . 60
5.23 The absolute efficiency for clover D5. The red circles, black squares and green diamonds stand for the measured absolute efficiencies for the peaks of152Eu,60Coand 137Cs, while the blue triangles denote the normalized Geant4 simulation. . . 61 5.24 The absolute efficiency for clover B6. The red circles, black squares
and green diamonds stand for the measured absolute efficiencies for the peaks of152Eu,60Coand 137Cs, while the blue triangles denote the normalized Geant4 simulation. . . 61 5.25 The absolute efficiency for clover C6. The red circles, black squares
and green diamonds stand for the measured absolute efficiencies for the peaks of152Eu,60Coand 137Cs, while the blue triangles denote the normalized Geant4 simulation. . . 62 5.26 The absolute efficiency for clover D6. The red circles, black squares
and green diamonds stand for the measured absolute efficiencies for the peaks of152Eu,60Coand 137Cs, while the blue triangles denote the normalized Geant4 simulation. . . 62 5.27 The absolute efficiency for clover A7. The red circles, black squares
and green diamonds stand for the measured absolute efficiencies for the peaks of152Eu,60Coand 137Cs, while the blue triangles denote the normalized Geant4 simulation. . . 63 5.28 The absolute efficiency for clover B7. The red circles, black squares
and green diamonds stand for the measured absolute efficiencies for the peaks of152Eu,60Coand 137Cs, while the blue triangles denote the normalized Geant4 simulation. . . 63 5.29 The absolute efficiency for clover C7. The red circles, black squares
and green diamonds stand for the measured absolute efficiencies for the peaks of152Eu,60Coand 137Cs, while the blue triangles denote the normalized Geant4 simulation. . . 64 5.30 The absolute efficiency for clover D7. The red circles, black squares
and green diamonds stand for the measured absolute efficiencies for the peaks of152Eu,60Coand 137Cs, while the blue triangles denote the normalized Geant4 simulation. . . 64 5.31 The absolute efficiency for clover A8. The red circles, black squares
and green diamonds stand for the measured absolute efficiencies for the peaks of152Eu,60Coand 137Cs, while the blue triangles denote the normalized Geant4 simulation. . . 65 5.32 The absolute efficiency for clover B8. The red circles, black squares
and green diamonds stand for the measured absolute efficiencies for the peaks of152Eu,60Coand 137Cs, while the blue triangles denote the normalized Geant4 simulation. . . 65 5.33 The absolute efficiency for clover C8. The red circles, black squares
and green diamonds stand for the measured absolute efficiencies for the peaks of152Eu,60Coand 137Cs, while the blue triangles denote the normalized Geant4 simulation. . . 66
List of Figures xv 5.34 The absolute efficiency for clover D8. The red circles, black squares
and green diamonds stand for the measured absolute efficiencies for the peaks of152Eu,60Coand 137Cs, while the blue triangles denote the normalized Geant4 simulation. . . 66 5.35 Spectrum in clover A1 placed at 130◦ with respect to the beam line.
The room background and the background registered with a beam passing through an empty frame have been subtracted. The most intense γ-ray lines are Identified with their energy in keV (red). . . 68 5.36 (A): The differential cross sections from PR239 withEp = 66 M eV
for the 754keV line with detectors positioned at 90◦ and 135◦. (B):
The differential cross sections from PR255 with Ep = 66 M eV for the 754keV line with one of the 8 clover detectors at 168◦. . . 69 5.37 Angular distribution for the 40Ca 754.8 keV γ-ray line at 66 MeV
proton energy. The solid lines are the fitted curves for the angular distribution function for a L = 2 transition. The data points repre- sent the differential cross sections measured for each crystal versus the detection angle. The error bars on the differential cross sections include statistical error as well as the errors of target thickness, the efficiency and the number of incident particles. . . 70 5.38 Angular distribution for the 40Ca 754.8 keV γ-ray line at 80 MeV
proton energy. The solid lines are the fitted curves for the angular distribution function for a L = 2 transition. The data points repre- sent the differential cross sections measured for each crystal versus the detection angle. The error bars on the differential cross sections include statistical error as well as the errors of target thickness, the efficiency and the number of incident particles. . . 71 5.39 Angular distribution for the 40Ca 754.8 keV γ-ray line at 95 MeV
proton energy. The solid lines are the fitted curves for the angular distribution function for a L = 2 transition. The data points repre- sent the differential cross sections measured for each crystal versus the detection angle. The error bars on the differential cross sections include statistical error as well as the errors of target thickness, the efficiency and the number of incident particles. . . 72 5.40 Angular distribution for the 40Ca 754.8 keV γ-ray line at 110 MeV
proton energy. The solid lines are the fitted curves for the angular distribution function for a L = 2 transition. The data points repre- sent the differential cross sections measured for each crystal versus the detection angle. The error bars on the differential cross sections include statistical error as well as the errors of target thickness, the efficiency and the number of incident particles. . . 73
5.41 Angular distribution for the 40Ca 754.8 keV γ-ray line at 125 MeV proton energy. The solid lines are the fitted curves for the angular distribution function for a L = 2 transition. The data points repre- sent the differential cross sections measured for each crystal versus the detection angle. The error bars on the differential cross sections include statistical error as well as the errors of target thickness, the efficiency and the number of incident particles. . . 74 5.42 Figure (A) The differential cross sections from PR239 with Ep = 66
M eV for the 3736.5 keV line with detectors positioned at 90◦ and 135◦, (B) The differential cross sections from PR255 with Ep = 66 M eV for the 3736.5 keV line with one of the 8 clover detectors at 168◦. . . 75 5.43 Angular distribution for the 40Ca 3736.5 keV γ-ray line at 66 MeV
proton energy. The solid lines are the fitted angular distribution curves for a L = 3 transition. The data points represent the dif- ferential cross sections for each crystal versus detection angle. The error bars on the differential cross sections include statistical er- ror as well as the errors of target thickness, the efficiency and the number of incident particles. . . 76 5.44 Angular distribution for the 40Ca 3736.5 keV γ-ray line at 80 MeV
proton energy. The solid lines are the fitted angular distribution curves for a L = 3 transition. The data points represent the dif- ferential cross sections for each crystal versus detection angle. The error bars on the differential cross sections include statistical er- ror as well as the errors of target thickness, the efficiency and the number of incident particles. . . 77 5.45 Angular distribution for the 40Ca 3736.5 keV γ-ray line at 95 MeV
proton energy. The solid lines are the fitted angular distribution curves for a L = 3 transition. The data points represent the dif- ferential cross sections for each crystal versus detection angle. The error bars on the differential cross sections include statistical er- ror as well as the errors of target thickness, the efficiency and the number of incident particles. . . 78 5.46 Angular distribution for the40Ca3736.5 keVγ-ray line at 110 MeV
proton energy. The solid lines are the fitted angular distribution curves for a L = 3 transition. The data points represent the dif- ferential cross sections for each crystal versus detection angle. The error bars on the differential cross sections include statistical er- ror as well as the errors of target thickness, the efficiency and the number of incident particles. . . 79
List of Figures xvii 5.47 Angular distribution for the40Ca3736.5 keVγ-ray line at 125 MeV
proton energy. The solid lines are the fitted angular distribution curves for a L = 3 transition. The data points represent the dif- ferential cross sections for each crystal versus detection angle. The error bars on the differential cross sections include statistical er- ror as well as the errors of target thickness, the efficiency and the number of incident particles. . . 80 5.48 The total cross section, p0 for Ep = 66 M eV for the 754.8 keV
line of40Ca. The blue data points represent the obtained p0 values within different fits, see Figures 5.36 and 5.37, while the final value for p0 (the red data point) is obtained as described in the text.. . . 82 5.49 The total cross section, p0 for Ep = 80 M eV for the 754.8 keV
line of40Ca. The blue data points represent the obtained p0 values within different fits, see Figure 5.38, while the final value for p0 (the red data point) is obtained as described in the text. . . 83 5.50 The total cross section, p0 for Ep = 95 M eV for the 754.8 keV
line of40Ca. The blue data points represent the obtained p0 values within different fits, see Figure 5.39, while the final value for p0 (the red data point) is obtained as described in the text. . . 83 5.51 The total cross section, p0 for Ep = 110 M eV for the 754.8 keV
line of40Ca. The blue data points represent the obtained p0 values within different fits, see Figure 5.40, while the final value for p0 (the red data point) is obtained as described in the text. . . 84 5.52 The total cross section, p0 for Ep = 125 M eV for the 754.8 keV
line of40Ca. The blue data points represent the obtained p0 values within different fits, see Figure 5.41, while the final value for p0 (the red data point) is obtained as described in the text. . . 84 5.53 Total cross section excitation function for the 754.8 keV γ-ray pro-
duction when natCa target is bombarded with protons. The error bars for the points at Ep > 95 M eV are not visible, because they are smaller than the symbol size. . . 85 5.54 The total cross section, p0 for Ep = 66 M eV for the 3736.5 keV
line of40Ca. The blue data points represent the obtained p0 values within different fits, see Figure 5.42, while the final value for p0 (the red data point) is obtained as described in the text. . . 86 5.55 The total cross section, p0 for Ep = 80 M eV for the 3736.5 keV
line of40Ca. The blue data points represent the obtained p0 values within different fits, see Figure 5.43, while the final value for p0 (the red data point) is obtained as described in the text. . . 87 5.56 The total cross section, p0 for Ep = 95 M eV for the 3736.5 keV
line of40Ca. The blue data points represent the obtained p0 values within different fits, see Figure 5.44, while the final value for p0 (the red data point) is obtained as described in the text. . . 87
5.57 The total cross section, p0 for Ep = 110 M eV for the 3736.5 keV line of40Ca. The blue data points represent the obtained p0 values within different fits, see Figure 5.45, while the final value for p0 (the red data point) is obtained as described in the text. . . 88 5.58 The total cross section, p0 for Ep = 125 M eV for the 3736.5 keV
line of40Ca. The blue data points represent the obtained p0 values within different fits, see Figure 5.46, while the final value for p0 (the red data point) is obtained as described in the text. . . 88 5.59 Ttoal cross section excitation function for the 3736.5 keV γ-ray
production when natCa target is bombarded with protons. The error bars for the points Ep > 95 M eV are not visible, because they are smaller than the symbol size.. . . 89 6.1 Schematical drawing of outgoing particle spectrum. The energy
regions where the compound (C), pre-equilibrium (P) and direct (D) mechanisms dominate are shown [Kon15]. . . 92 6.2 Nuclear models used in Talys. . . 92 6.3 Comparison of the experimental cross sections with Talys simula-
tions for the 3736.5keV γ-ray. . . 96 6.4 Comparison of the experimental cross sections with Talys simula-
tions for the 754.8 keV γ-ray. . . 97
List of Tables
3.1 Thickness of the calcium targets used for different measurements.
These values have an uncertainty of ± 0.8 mg·cm−2. . . 31 3.2 Gamma-ray selection rules and multipolarities . . . 36 5.1 Data for the three standard γ-ray sources used for energy and effi-
ciency calibrations. . . 48 5.2 The normalizing factors used to normalize the Geant4 efficiencies
with respect to experimental data.. . . 51
xix
Abbreviations
AFRODITE AFrican OmniprposeDetector for Innovative Techniques and Experiments HPGe High Purity Germanium
LABS Laboratory for Accelerator Based Sciences BGO Bismuth Germinate
LEPS Low Energy Photon Spectrometer SSC Separated Sector Cyclotron
MIDAS Maximum IntegratedData Acquisition Software DWBA Distorted WaveBorn Approximation
xx
Chapter 1 Introduction
The interactions of a proton with different nuclei are of great importance in many areas of physics, namely for understanding the fundamentals of the nuclear in- teractions, but also for applications in nuclear astrophysics and hadron therapy.
Experimental data are needed for all these fields of research. An important char- acteristic of a nuclear interaction is its cross section, i.e. the probability that a nuclear reaction occurs for a given projectile, projectile energy, target and target thickness. The cross section values are important for the following two reasons.
Firstly, they provide insight into the nature of matter, and as a result contribute in the understanding of fundamental physics. Secondly, they are needed for practical applications, e.g. to monitor the dose on the cancer cells in proton therapy, or to calculate what elements are produced in the stars. Most applications that need cross sections rely on theoretical models. It is therefore essential that these the- oretical cross sections are tested and compared with experimental data to ensure their correctness.
The literature shows a number of experimental studies of prompt γ-ray emission following proton collisions with 12C, 16O and 14N elements in astrophysical en- vironments, e.g. Dyer et al. (for 12C, 16O and 14N up to 23 M eV) [Dye81], Narayanaswamy et al. (for 16O in the energy range of 23.7 M eV and 44.6 M eV) [Nar81], Lang et al. (for 12C and 16O energies 40 M eV, 65 M eV and 85 M eV) [Lan87], Kiener et al. (for16O and12Cenergy from 8.4 M eV to 20M eV) [Kie98], Belhout et al. (for 12C and 16O energy up to 25M eV) [Bel07] and Benhabiles et al. (for 14N energy up to 26 M eV) [Ben11]. The currently available experimental data for proton collisions with these nuclei cover well the range below 30 M eV,
1
which is an important energy range to predict the inelastic nuclear reaction prob- abilities during the proton beam radiotherapy. Unfortunately, there is little or no γ-ray production cross-section data in the critical energy range from 50 to 200 M eV for prominent elements in tissue, e.g. hydrogen, carbon, oxygen, calcium and nitrogen.
To our knowledge, no γ-ray production cross section data is available for 40Ca, and that is one of the reasons that makes 40Ca an interesting element to study.
Calcium is not just the fifth most abundant element in the Earth’s crust [Hol46], it is also the most abundant metal in the human body, where it makes up to about 15% of our body weight [Hea60]. It plays a fundamental role in the growth and the formation of human cells and is an important element playing a role in the plant cells walls [Hew63]. In many systems the abundance of elements (e.g.
calcium) can be best be studied by cross section techniques [Ram79,Dye81]. Thus, the knowledge of the nuclear interactions on calcium in such systems can thereby be enhanced. Hence, here a study is carried out on the proton induced nuclear reactions on the stable isotope of calcium, 40Ca.
We intended to measure the γ-ray production cross sections of protons on natural calcium (natCa) in the energy range from 66 M eV up to 125 M eV. Five proton beam energies, 66M eV, 80M eV, 95M eV, 110M eV and 125M eV were explored in these experiments, performed with the AFRODITE array at iThemba LABS.
1.1 Aim of the research
The aim of this research is to measure theγ-ray production cross section for proton induced reactions onnatCa, calcium is one of the prominent elements found in hu- man tissues and the fifth most abundant element in the Earth’s crust. These cross sections are measured over the range of proton energies from 66 to 125M eV. The prompt γ-ray production cross sections for calcium were measured experimen- tally using the AFRODITE array at iThemba LABS. These measurements are compared with the cross sections simulated with the Talys code. This work also includes modelling of the AFRODITE array using Geant4 Monte Carlo particle transport code.
Chapter 1. Introduction 3
1.2 Nuclear reactions
A nuclear reaction is considered to be the process in which two nuclei (or a nucleus and a subatomic particle) interact to produce one or more nuclei that are different from the nuclei that began the process. Curie and Joliot discovered the positron emitter 30P, when aluminium was bombarded with alpha particles [Pre67]. This nuclear reaction can be written as:
4
2He+2713Al→3015 P +10n (1.1) It implies that the mass number and the nuclear charge are conserved. The proper- ties such as energy, momentum, angular momentum and parity are also conserved in nuclear reactions. Alternative shorthand notation representing the above men- tioned nuclear reaction can be written as27Al(4He, n)30P. Thus, a nuclear reaction must cause a transformation at least one nuclide to another [Kra87]. When the target nuclei are bombarded by particles, the following interactions may take place, namely, elastic scattering, inelastic scattering, capture reactions, direct reactions, fission reactions, fusion reactions, etc.
In fusion reactions, two light nuclei are combined to form a heavier nucleus, while in fission reactions a heavy nucleus is split into two nuclei with almost equal fragments. In direct reactions, nucleons are transferred between the target and the projectile. In inelastic scattering reactions between a proton and a target nucleus some energy of the incident proton is absorbed by the recoiling nucleus and the nucleus becomes excited. This process involves an exchange of large amount of energy. In most cases, the residual nuclei produced in nuclear reactions have high excitation energy, which might be released by the emission of particles and/or γ-rays in order to reach the nuclear ground states.
Here, we study the γ-rays emitted after a nuclear reaction since they have the potential of providing information about the produced nuclei. Gamma rays of- fer us information on the internal nature of the nuclear interactions and into the formation of different nuclides. Theγ-rays can reveal information about the abun- dances of the nuclei formed in a star or in the interstellar cosmic space. In radiation therapy, the produced γ-rays can reveal information about the probability of the nuclear interactions between the projectile and the target nucleus. The obtained
probability can be used to determine the delivered dose that has to damage the deoxyribonucleic acid (DNA) of a cancer cell. In this experiment, we have mea- sured the γ-ray production cross section for proton interactions with calcium in the energy range of 66 - 125M eV using the AFRODITE array at iThemba LABS.
The experimental methods and the results obtained shall be presented in their re- spective chapters. The cross sections measured can be used in various fields, such as astrophysics and medical physics. Such applications are beyond this project, but a few details about them are given below. The nuclear reactions in the as- trophysical environment are the same as the reactions taking place during hadron therapy, or in the experimental laboratory.
1.3 Fields of application
The estimations and investigations of nuclear reactions provide significant data in numerous fields of study. Two fields of study are detailed below.
1.3.1 Medical physics: Radiation therapy
1.3.1.1 Radiation oncology
Radiation oncology uses ionizing radiation as part of cancer treatment to control the deadly cancer cells. The radiation can either be electron, photon, proton, neutron or ion beams. It damages the DNA to completely destroy cancer cells by energy absorption through the process of ionization and excitation of the atoms and molecules in the living tissue. Precise radiation therapy treatment is needed for minimal exposure to the surrounding normal healthy tissues.
1.3.1.2 Rationale for proton therapy
Protons are positively charged particles located in the nucleus of an atom. During radiation therapy high energy protons bombard tissue and deposit their energy within it. Protons travel a determinate distance and release the greatest amount of energy at the end of their range in a characteristic radiation dose deposition peak called the Bragg peak, see Figure 1.1. The depth of the Bragg peak can be
Chapter 1. Introduction 5 controlled by varying the acceleration of the protons. There is significantly less integral dose to non-target tissues with protons than X-rays, because the entrance dose is greatly reduced relative to the target dose and there is no exit dose [Men11].
Figure 1.1: Depth-dose distribution for a spread-out Bragg peak (SOBP, dot- ted blue line), its constituent pristine Bragg peaks (solid black lines) and a 8 MV X-Rays (Source Surface Distance “SSD” = 100 cm) beam (green). The SOBP dose distribution is created by adding the individually contributions of
modulated pristine Bragg peaks.
In medical radiation one can use cross section values to calculate the probability of the protons to interact with the tissues (in this case with the calcium in the bones) inside the patient’s body during cancer treatment therapy. Knowing the cross sections one could determine a safe dose of radiation to be given to the tumor including bone cancer tumors. The proton beam is less harmful to normal tissues and is one of the most precise modalities of external radiation therapy [Zhu13].
1.3.2 Astrophysics context
1.3.2.1 The interaction of energy particles
When cosmic rays interact with matter in the interstellar medium (ISM) nuclear γ-rays can be produced [Ram79]. Gamma-ray astronomy uses the produced γ- rays as a tool to examine the Universe. Their presence is the signature of specific nuclear reactions taking place in the astrophysical environment. Theγ-ray spectra obtained in the astrophysical environment can be analysed to obtain the relative abundance of isotopes and the energy spectra of accelerated particles. Shapes of the γ-ray line may give information on the accelerated particles directions and help to distinguish between gaseous matter and grains. Possible sites of producing the energetic charged particles include regions of star formation, black holes, solar flares, interstellar gas and dust, neutron stars, novae, and supernovae [Ram79, Lin78, Cli78]. Several distinct mechanisms are involved in producing γ-rays at such sites. Charged particles induce nuclear reactions such as inelastic scattering and spallation reactions and radioactive decay of excited states of nuclei.
1.3.2.2 Solar γ-ray emission
Solar flares are explosions that occur in the atmosphere of a star leading to the emission of radiation covering the full energy range of the electromagnetic spec- trum: radio, visible, UV, X-rays and γ-ray, see Figure 1.2. The energy released in a solar flare can be greater than 1032 ergs. The right frame of Figure 1.2 shows a magnified image of a flare that occurred on the west limb. In solar flares, the γ-ray emission is the result of interactions of charged particles with an underlying ambient medium. These charged particles, e.g. protons, αparticles, heavier nuclei and electrons, are accelerated from the ambient plasma by the electric fields associ- ated with the complex and varying magnetic fields in the flaring solar atmosphere [Ram98].
At Earth, these charged particles can disrupt radio communications, damage satel- lites and destabilize their orbits, cause failures in long distance power lines and endanger astronauts. Therefore, it is essential to understand the solar flares mech- anism, since protons and α particles along with lower energy electrons carry the
Chapter 1. Introduction 7 bulk of the energy released in the flares. The solar γ-ray emission exhibits char- acteristics spectral lines which provide information about the composition of the elements in the solar atmosphere.
Figure 1.2: The left image shows a full-disk image of the sun from Yohkoh soft X-rays telescope. The right image magnifies a flare that occurred in the west limb. A contour map of X-ray emission observed with hard X-rays telescope is superimposed on soft X-rays intensity map (Yohkoh X-ray image of a solar
flare, Jan 13, 1992).
1.3.2.3 Cosmic radiation
Cosmic rays are one of the most important sources of information in astrophysics.
They are defined as massive particles, nuclei, neutrinos and protons and strike the Earth. Most of the time cosmic rays can either be galactic cosmic rays (including solar) or of extragalactic origin. It is well established that the primary cosmic rays undergo reactions called spallation with our atmosphere or with the interstellar medium which leads to secondary cosmic rays formation [Ben06].
When studying the composition and energy distribution of cosmic rays, one hopes to gain information about the nucleosynthesis process, about the galactic mass density and the flight path. The galactic magnetic field roughly randomises the motion of the particles (proton, lepton and nuclei), thus, it provides less infor- mation about the direction of the source. The energy distribution of cosmic rays peaks in the range of 100 - 1000 M eV [Ben06].
The acceleration mechanisms strip all the surrounding electrons from the galac- tic cosmic-ray atoms. Galactic cosmic rays come from outside the solar system, but mostly from within our Milky Way galaxy and are formed in the area of a supernova. They have probably been accelerated to nearly the speed of light and traveled more than 10 million years to reach the Earth. As they travel through the thin gas of interstellar space, some of the galactic cosmic rays interact and emit γ-rays. That is how we obtain information about their passing through the Milky Way (or other galaxies).
The interstellar medium is dominated by hydrogen and helium atoms, so as the cosmic rays travel through it, they induce mostly spallation reactions. Spallation reaction refers to the process in which a light projectile of several hundreds of M eV to several GeV kinetic energy interacts with a heavy nucleus resulting in the emission of a large number of subatomic particles or fragments. The study of the spallation processes showed that they could generate lithium, beryllium and boron, explaining why these isotopes are over represented in the cosmic-ray nuclei. Other elements formed in the solar system through cosmic-ray spallation are tritium, and some isotopes of aluminium, carbon, chlorine, iodine and neon.
The abundance measurements of the elements in the interstellar environment, which are based on well established cross-section data, can provide information about the typical path length and propagation time of cosmic rays.
The greater part of the unambiguously registered gamma-ray lines have up to this point been emitted from the solar flares environments, although some lines gener- ated by sites near to the galactic center have also been observed. Interpretation of such information, as well as possible future observation of other sources, requires the knowledge of γ-ray production cross sections [Dye81].
Chapter 2
Experimental Techniques and Equipment
This chapter reports on the experimental techniques and equipment related to this work. It also includes a description of the prompt γ-ray emission and the interactions ofγ-ray with matter. In addition it gives an overview of the iThemba LABS experimental facility and lastly, it presents the AFRODITE γ-ray array with its detectors and other components.
2.1 Prompt γ-ray emission
During the de-excitation of the nucleus, emission of γ-rays takes place. The ex- cited nucleus cools down while it is transitioning from a high-energy state to a lower-energy state. The energy of the emitted γ-ray is equal to the energy differ- ence between the two nuclear states involved in the transition. During a proton- nucleus inelastic collision, the transfer of energy from the incident proton to the target nucleus causes a transition of the target nucleus to an excited state. The de- excitation often happens in less than a nanosecond. Hence, this process is known as prompt γ-ray emission. Different types of target materials emit differentγ-rays when bombarded with protons. The γ-ray de-excitation is categorized as statis- tical and discrete transitions. The statistical transitions carry away a substantial amount of energy but little angular momentum, de-exciting the nucleus towards the yrast line (comprising the states of lowest excitation energy for a given spin).
This study focuses on the emission of the 754.8 keV transition of 40Ca, which is 9
a 5−→ 3− transition and the 3736.5 keV transition of 40Ca, which is a 3− →0+ transition.
2.2 Interactions of γ -rays with matter
Gamma-rays are high energy photons emitted from unstable nuclei. When γ-rays are emitted from an excited nucleus, a set of detectors can be used to measure the energy of those γ-rays. The detection of γ-rays reflects the observation of an interaction between the incident photon and the material of the detector. There are three major interaction mechanisms for γ-rays and they play an important role inγ-ray spectroscopy, namely: photo-electric absorption, Compton scattering and pair production. These interactions involve processes that lead to a partial or complete transfer of the incident γ-ray energy into the detector material. The interactions result in a sudden change in the γ-ray photon history, i.e. the photon is either absorbed or scattered. The three main processes are shown in Figure 2.1 and are discussed below.
Figure 2.1: Range of the three main processes of interaction of theγ-rays with matter as a function of theγ-ray energy [Eva55].
Chapter 2. Experimental Techniques and Equipment 11
2.2.1 Photoelectric effect
An incident photon can interact with an atomic electron through photoelectric effect. The energy of a photon is then completely transferred to the electron by first providing enough energy to discharge it from its bound state in a nucleus while the rest of the photon energy is transformed into kinetic energy that allows to eject the electron out of the atom, see Figure 2.2. Gamma rays are more likely to inject K, L electron than lower energy photons. The K-shell binding energy ranges from 0 to ∼100 keV and increases with the atomic number of the nucleus.
The binding energy is smaller than the typical energy of theγ-rays that are usually emitted by nuclei (100keV - 1M eV), so that a large part of the incident energy is transferred as kinetic energy of the electron. Therefore, if the energy of the γ-ray is Eγ, and the binding energy of the electron is Eb, the electron’s kinetic energy Ee− will be:
Ee− =Eγ−Eb (2.1)
Figure 2.2: Photoelectric absorption.
Photoelectric absorption process converts electromagnetic energy of aγ-ray photon into kinetic energy of a charged particle, an electron [Kra87]. The atom is left in an excited state with an excess energy of Eb. One of the ways it can recover to its equilibrium is by filling the vacancy by rearranging the electrons in the other shells. This rearrangement ultimately results in an emission of a X-ray photon
(X-ray fluorescence). The second way of recovering of an atom to its equilibrium is to fill the vacancy with an external free electron that must be captured, hence the atom returns to its neutrality. The excitation energy of the atom can be transferred directly to one of the outer electrons and to cause its ejection from the atom. Photoelectric absorption is most significant for low energy photons. Its probability increases rapidly with the atomic number of the absorber material and decreases rapidly with increasing the photon energy. The photoelectric interaction cross section can be approximated by equation 2.2.
σpe =kpeZn
Eγ3 (2.2)
where kpe is a proportionality constant and σpe is the probability of a photon of energy (Eγ) to interact with an electron in a material with atomic number Z [Kno00].
2.2.2 Compton scattering
Compton scattering involves the scattering of photons by charged particles where both energy and momentum are transferred to the charged particles while the photons move off with a reduced energy and a change of momentum. Generally, the charged particle is an electron considered to be initially at rest and the pho- ton is usually considered to be an energetic photon such as a γ-ray photon. The energy and momentum of the photons and electrons must be expressed using their relativistic values [Kra87]. The use of relativistic mechanics by the Compton scat- tering theory is based on the two main reasons. Firstly, it involves the scattering of photons, and photons are massless, and secondly, the energy transferred to the electron is comparable to its rest energy. The energy of the scattered photon has an angular dependence and it can be shown through the laws of conservation of energy and the law of conservation of momentum.
From the special theory of relativity, an object with rest mass of m0 and moving at a velocity (v) will have a relativistic mass m given by
m= m0
p1−(vc)2 (2.3)
Chapter 2. Experimental Techniques and Equipment 13 Squaring both sides of equation 2.3 and multiplying byc4 leads to
m2c4−m2v2c2 =m20c4 (2.4) Since the relativistic momentum ~pis defined as m~v, then equation 2.4 becomes
(mc2)2−(pc)2 = (m0c2)2 (2.5)
E2−(pc)2 = E02 (2.6)
(pc)2 = E2−E02 (2.7)
Equation (2.7) then relates the magnitude of the relativistic momentum ~p of an object to its relativistic energy E and its rest energy E0. The magnitudes of the momentum and the energy of a massless particle such as a photon are related by
pc = E (2.8)
p = E c = hv
c = h
λ (2.9)
whereh is the Planck’s constant and λ is the wavelength of the photon,m0 is the rest mass of the electron. Figure 2.3 shows the scattering of an incident photon of energyE =hvmoving to the right in the x direction with a momentump= hvc = hλ and interacting with an electron at rest with a momentumpe = 0 and energy equal to its rest energy, E0 =m0c2. In the interaction shown in Figure 2.3 the γ-ray is scattered at an angle θ with a momentum of magnitude p0 = hv
0
c = λh0 and energy E0 = hv0. The electron is scattered at an angle φ with respect to the incident photon with momentum p0e = 1cp
Ee2−E02 and energy Ee = mc2 where m is the relativistic mass of the electron after the interaction.
Figure 2.3: Compton scattering diagram showing the interaction of the inci- dent photon with an electron.
Using the laws of conservation of energy and conservation of momentum we can get the following equations;
hv+E0 = hv0 +Ee (2.10)
p = p0cosθ+p0ecosφ (2.11) 0 = −p0sinθ+p0esinφ (2.12)
Manipulating these three equations with the help of equations 2.7 and 2.9 we can arrive at the Compton scattering equation:
E0 = E
1 + EE
0(1−cosθ) (2.13)
whereE andE0 are the energies of the incident and scattered photons respectively, θis the scattering angle of the photon with respect to its initial direction andm0c2 is the electron’s rest mass. The transfer of energy via Compton effect can range from 0% to nearly 100%, depending on the energy of the γ-ray and the angle of scattering [Kra87]. Applying the law of conservation of energy, the energy given to an electron by Compton scattering is
Chapter 2. Experimental Techniques and Equipment 15
Ee =E−E0 (2.14)
Substituting equation (2.13) into equation (2.14)
Ee =E− E 1 + EE
0(1−cosθ) (2.15)
Since the maximum kinetic energy transferred to the electron is forθ = 180◦, then the maximum energy transferred is given by
EeM ax =E− E 1 + 2EE
0
(2.16)
For values ofE mc2the maximum energy that can be transferred to the electron is nearly equal to the energy of theγ-ray, andEeM ax ≈E. For values ofE mc2, the maximum energy that can be transferred to the electron is approximately zero or,EeM ax ≈0. In practice, Compton scattering produces a distribution of energies known as the Compton continuum up to the energy given by equation 2.16, which is known as the Compton edge. The angular distribution of scattered γ-rays is predicted by the Klein Nishina formula which specifies the differential cross section per electron [Kno00]:
deσ dΩ = 1
2r02
1
[1 +α(1−cosθ)]2
1 + cos2θ+ α2(1−cosθ)2 [1 +α(1−cosθ)]
(2.17)
where α = mEγ
0c2 is the photon energy in units of the electron rest mass energy and the classical electron radius r0 = 4πe2
0m0c2 = 2.818 fm. A polar plot of the differential cross section is graphically shown in Figure 2.4 and it also illustrates the strong tendency for forward scattering at high values of the γ-ray energies.
Figure 2.4: A polar plot of the differential cross section dσ(θ)dΩ which is the probability for Compton scattering ofγ-rays as a function of the angle [Kra87].
It is important to note that in Compton scattering the photon does not transfer all its energy. Compton scattering is most probable forγ-ray energies in the range 200 to 1000 keV and in this range the Compton continuum is a major source of background events in the γ-ray spectra.
2.2.3 Pair Production
In pair production a γ-ray of sufficient energy converts its energy into mass by creating an electron-positron pair. The electron has negative charge, while the positron is positive. In order to conserve energy and momentum, this reaction only takes place in the vicinity of the strong Coulomb field near the nucleus of an atom. The rest mass of the electron and positron are 0.511 M eV each so there is a threshold of 1.022 M eV for this process to take place. The probability for pair production increases steadily with increasing the energy of the incidentγ-ray.
Any excess energy above 1.022M eV is divided between the electron-positron pair as kinetic energy, while the recoil energy given to the atom is negligible. If Ei is the energy of the γ-ray that interacts by pair production, then
Ei =m+0c2+m−0c2+KE++KE−+KEN (2.18)
Chapter 2. Experimental Techniques and Equipment 17 where m+0c2 and m−0c2 are the rest mass energies of the positron and electron respectively, KE+ and KE− are their kinetic energies, and KEN is the negligible kinetic energy transferred to the nucleus of the atom [Kra87].
Figure 2.5: Pair production.
When the positron has slowed down due to interacting with the surrounding envi- ronment, it picks an electron from the surrounding medium and forms a positro- nium bound system (like the hydrogen system but with a positron instead of a proton). The positronium annihilates into two or three γ-rays depending on the spin alignment of the electron and positron. In most cases two γ-rays with energy of 511 keV are emitted. One or both of them may escape from the detector or they might be absorbed. If both annihilation γ-rays are absorbed in the detector, the events contributes to the full energy peak of the measuredγ-ray. If one of the annihilation γ-rays escaped from the detector, the interaction contributes to the single escape peak which has an energy of 511 keV below the full energy peak.
When both γ-rays escape, the interaction contributes to the double-escape peak with energy of 1.022M eV below the full energy. Pair production is significant for the energy range above Eγ = 1.2 M eV.
2.3 Experiments and set-ups
To be able to study the γ-ray production cross sections in proton induced nuclear reactions, the following main equipment is needed;
1. A suitable reaction to populate the nuclei of interest at suitable excitation energy and angular momentum.
2. Accelerator and beam lines to accelerate and deliver the required beam to the target in the experimental set-up.
3. Detector system with high γ-ray efficiency and good energy resolution.
2.3.1 Overview of the iThemba LABS facility
The experimental measurements presented in this thesis were performed at iThemba LABS, a South African national multi-disciplinary research facility situated near Cape Town. This is an accelerator-based facility which provides research sup- port in nuclear and material sciences, by providing accelerator based beams which are used for neutron and proton therapy, radiation biophysics, radioisotopes pro- duction and basic nuclear physics research. It provides radioisotopes for medical diagnostics to hospitals in South Africa and abroad. Obviously these activities position iThemba LABS as a significant player not only in Africa but globally.
The SSC is the cornerstone of this multi-disciplinary facility.
Figure 2.6 shows a layout of the Separated Sector Cyclotron facility of iThemba LABS. There are two Solid Pole injector Cyclotron, SPC1 and SPC2, with SPC1 being uniquely used for light ions while SPC2 for both light and heavy ions. Beams of light or heavy ions are pre-accelerated in one of the injector cyclotrons until they reach an energy high enough to be delivered to the SSC. Once the intended energy beam is reached in the injector, the beam is steered through the J or K beam line depending on which injector was being used, and injected into the SSC. At the SSC it can be accelerated to the desired final energy required by the different experiments. In this project the beam was delivered to the AFRODITE array through the X, P and R beam lines.
Chapter 2. Experimental Techniques and Equipment 19
Figure 2.6: Layout of the Separated Sector Cyclotron facility of iThemba LABS.
2.3.2 AFRODITE array
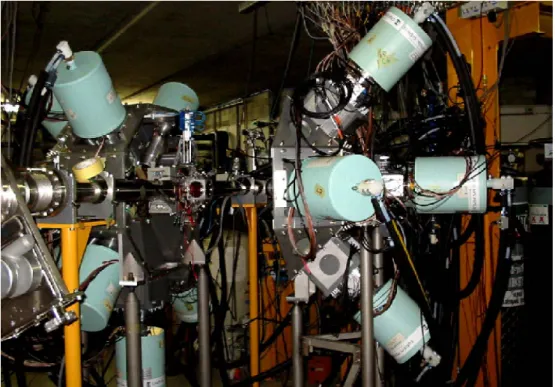
AFRODlTE is an acronym for AFRican Omnipurpose Detector for Innovative Techniques and Experiments. The AFRODITE array is mounted on a rhom- bicuboctahedron frame with 16 detector positions [New98]. The target chamber has the same geometry (see Figure 2.7). The array normally consists of two types of high purity germanium (HPGe) detectors, namely, Compton suppression clover detectors and low energy photon spectrometers (LEPS). The clover detectors are similar to those of EUROGAM II and EUROBALL III [Duc99]. Each clover de- tector is surrounded by a bismuth germanate (BGO) Compton suppression shield.
Each clover consists of four 50 × 70 mm HPGe crystals and the eight clovers subtend a solid angle of 11% of 4π. These detectors are very suitable for measur- ing high-energy γ-rays due to their large volume. The total active Ge volume is approximately 470 cm2.
Moreover, the crystals are closely packed without any material between them, thus enabling good resolution for signals added from more than one crystal. The distance between the front face of the detector and the center of the AFRODITE array is 17.6 cm [New98]. The target chamber is positioned at the center of the AFRODITE array as shown in Figure 2.8. There is a target ladder that moves
vertically and it controls the target position inside the target chamber. The target ladder has four slots. In this experiment two slots were used for targets, one for empty frame, while in the last slot a ruby viewer was mounted. The ruby viewer was used for focusing the beam. The ruby viewer can be moved perpendicular to the beam direction using the target ladder. The viewer is a metal plate with a small hole at the center and is used to align the beam from the SSC. The verification of visual alignment is done using a camera connected to the small transparent window on the target chamber. The changing of the target can be done automatically using the control panel. The measured full energy peak efficiency of the AFRODITE array for nine clovers is 1.8% at 1.332 M eV.
Figure 2.7: The AFRODITE array. The target chamber with Compton sup- pression clover detectors and LEPS detectors are visible.
Chapter 2. Experimental Techniques and Equipment 21
Figure 2.8: The AFRODITE array with its two hemi-spheres open. The black insulated pipes to the detectors dewars are used to fill them with liquid nitrogen.
2.3.2.1 Clover detectors
Clover detectors are ideal for detecting high energy γ-rays because of their high efficiency in add-back mode. A clover detector is shown in Figure 2.9. These detectors are composite detectors. A composite detector is made up of several Ge crystals packed closely together in the same cryostat. In this way a large detector can be created with high photo-peak efficiency and high resolving power, since the individual crystals minimize the effect of Doppler broadening. Doppler shift depends on the direction of the emitted γ-ray with respect to the direction of the recoiling nucleus. One can apply Doppler correction to improve the energy resolution when the recoiling nucleus is not stopped in the target. However the accuracy of the Doppler correction is better when the detector has small opening angle. An array of composite detectors has high granularity and small opening angle for each crystal, while it has high efficiency. The clover detectors consist of four n-type coaxial HPGe crystals arranged in compact geometry. The crystals with the dimensions of 70 mm in length, 50 mm in diameter, 36 mm tapering length and 41mmside of the crystal surface are packed in a common cryostat, as shown Figure 2.10 and Figure 2.11.
Figure 2.9: A clover detector
Each HPGe crystal element has its own preamplifier, which allows energies de- posited in more than one element of the clover detector due to Compton scatter- ing to be added. The clover detector can be operated in two different modes, the direct mode and the add-back mode. In direct mode, each of the four crysta


![Figure 2.4: A polar plot of the differential cross section dσ(θ) dΩ which is the probability for Compton scattering of γ-rays as a function of the angle [Kra87].](https://thumb-ap.123doks.com/thumbv2/pubpdfnet/12226438.0/37.893.247.707.128.486/figure-differential-section-probability-compton-scattering-function-kra87.webp)