The Ultimate in Innovation and Sustainable Development
MEDIUM TERM REVENUE AND
EXPENDITURE FRAMEWORK
2020/2021 TO 2022/2023
Contents
1. MULTI-YEAR BUDGET 2020/21 – 2022/2023 ... 6
1.1 OVERVIEW OF THE 2020/21 MTREF ... 8
1.1.1 Revenue: Tariff increases: ... 9
Expenditure increases ... 9
1.2 Revenue by Source ... 13
1.3 Operating Transfers and Grant Receipts ... 15
1.4 Expenditure by Type ... 16
1.5 Summary of operating expenditure by standard classification item ... 17
1.7 Grant Allocations ... 19
2. OVERVIEW OF BUDGET RELATED POLICIES ... 25
Part B Legislative Mandate ... 32
1. Legislative Mandate ... 32
2. 2020/21 IDP /Budget Public Participation Schedule ... 32
3. Capital Infrastructure program for the 2020/21 financial year ... 36
Roads and Storm water upgrade ... 38
Water Supply and reticulation and Sewer Reticulation ... 38
Water Master Plan ... 41
Ground Water Use ... 43
4. Detailed Budget Tables ... 63
MBRR Table A1 - Budget Summary ... 63
MBRR Table A2 - Budgeted Financial Performance (revenue and expenditure by standard classification)... 65
MBRR Table A3 - Budgeted Financial Performance (revenue and expenditure by municipal vote) ... 66
MBRR Table A4 - Budgeted Financial Performance (revenue and expenditure) ... 67
MBRR Table A5 - Budgeted Capital Expenditure by vote, standard classification and funding source ... 68
MBRR Table A6 - Budgeted Financial Position ... 69
MBRR Table A7 - Budgeted Cash Flow Statement ... 70
MBRR Table A8 - Cash Backed Reserves/Accumulated Surplus Reconciliation ... 71
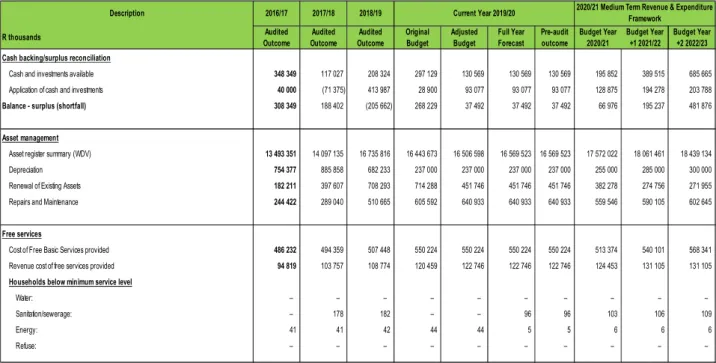
MBRR Table A9 - Asset Management ... 72
MBRR Table A10 - Basic Service Delivery Measurement ... 75
MBRR Table SA1 - Supporting detail to budgeted financial performance ... 77
MBRR Table SA3 – Supporting detail to Statement of Financial Position ... 80
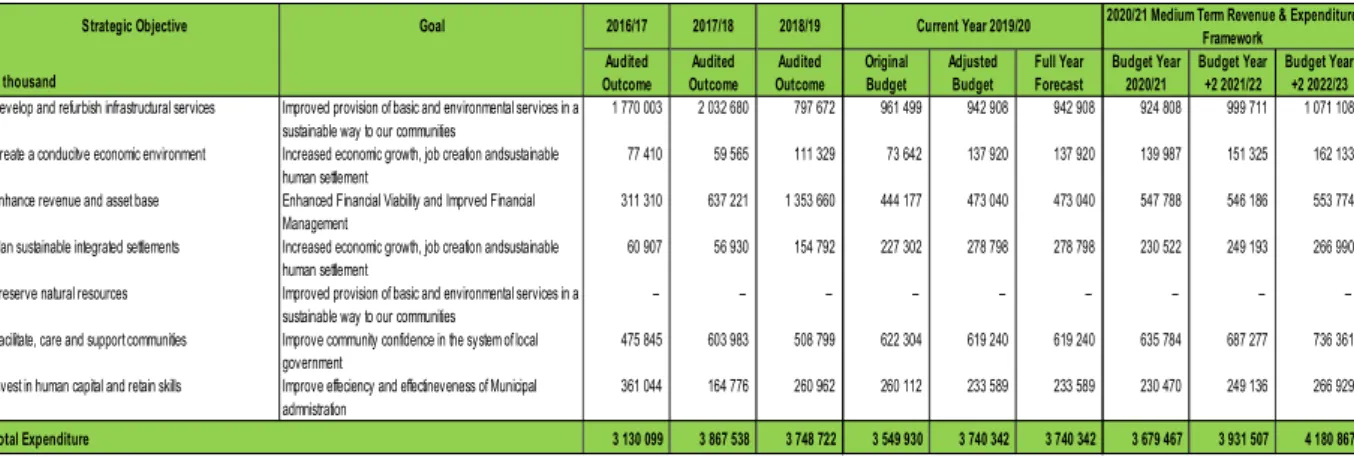
Table SA4 Reconciliation of IDP strategic objectives and budget (revenue) ... 81
... 81
Table SA5 Reconciliation of IDP strategic objectives and budget (operating expenditure) 81 Supporting Table SA6 Reconciliation of IDP strategic objectives and budget (capital expenditure) ... 81
Supporting Table SA8 Performance indicators and benchmarks ... 82
Supporting Table SA9 Social, economic and demographic statistics and assumptions ... 83
Supporting Table SA9 Social, economic and demographic statistics and assumptions ... 84
MBRR SA10 – Funding compliance measurement ... 85
Supporting Table SA12a Property rates by category (current year) ... 86
Supporting Table SA12b Property rates by category (budget year) ... 86
Supporting Table SA13a Service Tariffs by category ... 87
Supporting Table SA13b Service Tariffs by category ... 87
Supporting Table SA14 Household bills ... 88
Supporting Table SA15 Investment particulars by type ... 89
Supporting Table SA17 Borrowing ... 89
Supporting Table SA18 Transfers and grant receipts ... 90
Supporting Table SA19 Expenditure on transfers and grant programme ... 90
Supporting Table SA20 Reconciliation of transfers, grant receipts and unspent funds ... 91
Supporting Table SA21 Transfers and grants made by the municipality ... 91
Supporting Table SA22 Summary councillor and staff benefits ... 92
Supporting Table SA23 Salaries, allowances & benefits (political office bearers/councillors/senior managers) ... 93
Supporting Table SA24 Summary of personnel numbers ... 94
Supporting Table SA25 Consolidated budgeted monthly revenue and expenditure ... 95
Supporting Table SA26 Consolidated budgeted monthly revenue and expenditure (municipal vote) ... 96
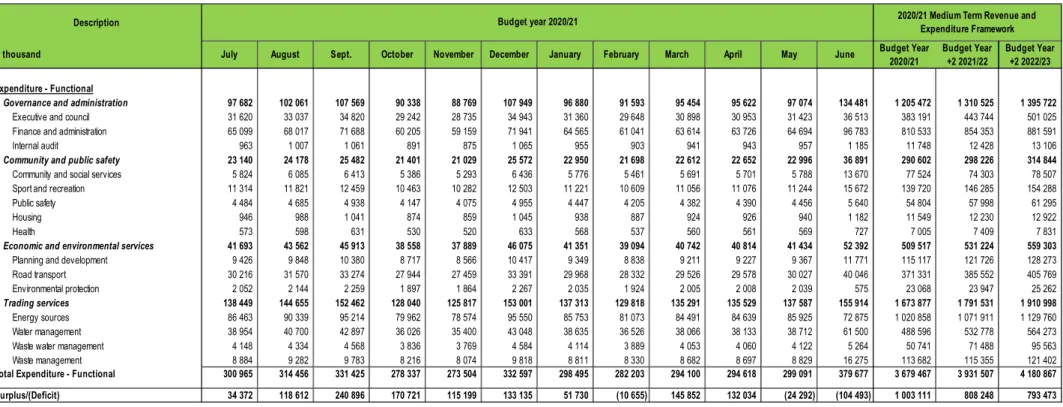
Table SA27 Consolidated budgeted monthly revenue and expenditure (functional classification) ... 97
Supporting Table SA28 Consolidated budgeted monthly capital expenditure (municipal vote) ... 98
Supporting Table SA29 Consolidated budgeted monthly capital expenditure (functional classification)... 99
Supporting Table SA30 Consolidated budgeted monthly cash flow ... 100
Supporting Table SA30 Consolidated budgeted monthly cash flow……continued ... 101
Supporting Table SA34a Consolidated capital expenditure on new assets by asset class
... 102
Table 56 MBRR SA34b - Capital expenditure on the renewal of existing assets by asset class ... 103
Table 57 MBRR SA34c - Repairs and maintenance expenditure by asset class ... 104
Supporting Table SA34d Depreciation by asset class ... 105
Supporting Table SA34e Consolidated capital expenditure on the upgrading of existing assets by asset class ... 107
Multi Year Capital Budget Program 2020/21-2022/23 ... 108
Annexure A: Polokwane Housing Association ... 115
Annual Budget and service delivery agreement - Polokwane Housing Association (PHA) For the Period 2020/2021 to 2022/2023 ... 115
Service Delivery Agreement between the City and the PHA ... 117
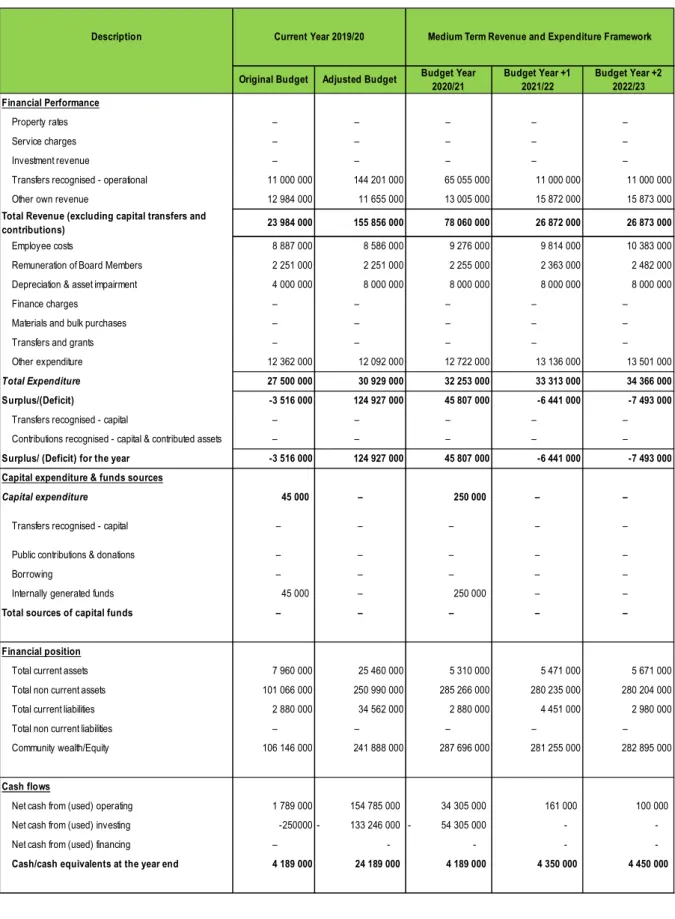
Table D1 Budget Summary ... 121
Table D2 Budgeted Financial Performance (revenue and expenditure) ... 122
Table D3 Capital Budget by vote and funding ... 123
Table D4 Budgeted Financial Position... 124
Table D5 Budgeted Cash Flow ... 125
Municipal Manager Quality Certificate ... 126
Annexure A :- ... 127
MFMA Circular 98 ... 127
MFMA Circular 99 ... 127
Annexure to MFMA Circular No 99 ... 127
Annexure B :- Response to COVID 19 ... 127
Part 1
1. MULTI-YEAR BUDGET 2020/21 – 2022/2023
DIRECTORATE CHIEF FINANCIAL OFFICER
ITEM
REF: 5/1/4
MULTI-YEAR BUDGET 2020/21 – 2022/2023
Report of the Chief Financial Officer
Purpose
The purpose of the report is to table the Multi-year Budget 2020/21 – 2022/2023 Council for approval.
Background
The IDP/Budget Process Plan to review the 2020/21 IDP/Budget was adopted on 29 July 2019 in terms of the provision of the Municipal Finance Management Act. The process plan outlines the key deadlines for the preparation, tabling and approval of the annual budget.
Discussion
Section 16 of the Municipal Finance Management Act stipulates the following:
(a) The Council of a municipality must for each financial year approve an annual budget
for the Municipality before the start of that financial year.
(b) In order for a municipality to comply with subsection (1), the Mayor of the municipality must table the annual budget at a council meeting at least 90 days before the start of the budget year.
Section 24 further stipulates that the Council must at least 30 days before the start of the budget year consider approval of the annual budget.
This 2020/21 MTREF Budget places emphasis on inclusive growth, as well as a progressive programme of capital expenditures. The MTREF Budget also relies on practice of good governance and a public ethic that values honesty and fairness. If we act together, on these principles, as public representatives, civil servants, business people, youth, workers and citizens, we can overcome the challenges of tough economic times and difficult adjustments.
National Treasury’s MFMA Circular No.98 and 99 was used to guide the compilation of the 2020/21 MTREF. In addition, this budget format and content incorporates the requirements of the Municipal Budget and Reporting Regulations.
The following budgeting PRINCIPLES were applied in formulating the medium term budget:
Realistic and achievable collection rates.
Sustainable, affordable, realistic and balanced budget
Major tariffs to be cost reflective, realistic and affordable
Budget to contribute to achieving strategic objectives of the IDP
Balancing capital expenditure for social, economic, rehabilitation and support.
Income/ revenue driven budget: affordability i.e. if funds do not materialise, review expenditure.
In this MTREF we have ensured that we eradicate non-priority spending and reprioritise expenditure to focus on core infrastructure and service delivery.
The main CHALLENGES experienced during the compilation of the 2020/21 MTREF are as follows:
The ongoing difficulties in the national and local economy;
The increased cost of bulk water and electricity (due to tariff increases from Lepelle Northern Water and Eskom), which is placing upward pressure on service tariffs to residents. Continuous high tariff increases are not sustainable - as there will be point where services will no-longer be affordable;
National Treasury Austerity measures with minimal growth in grant allocations.
Huge backlogs and further demands due to urbanization.
Economic slowdown & unemployment: impacts on collection rates
Limited available own funding to fund much needed infrastructure
The following are some of the AUSTERITY MEASURES that will be applied to the 2020/21
medium term budgets, in order to conform to National Treasury cost containment guidelines.
Utilisation of vehicles will be closely monitored via the vehicle tracking system.
Strategic approach to vacancies. Analysis of vacancies carried out.
Fuel, overtime, catering, and consultants are some of the costs that are closely monitored.
1.1 OVERVIEW OF THE 2020/21 MTREF
General economic overview
South Africa’s public finances deteriorated over the past decade; a trend that accelerated in recent years as low growth led to large revenue shortfalls. We have officially entered into a recession again for the second time in two years with lower growth forecasted over the MTEF period when factoring our domestic challenges with the corona virus pandemic.
For 10 years, the country has run large budget deficits. This has put us deeply in debt, to the point where interest payments have begun crowding out social and economic spending programmes. This cannot be sustained especially where the global economy faces a very likely possibility of a global recession in the wake of the corona virus pandemic.
Municipal governments face multiple pressures over the period ahead with local government expected to expand access to free basic service to poor households, while ensuring that those who can afford to pay for services do so.
The 2020 MTEF includes large reductions in planned transfers to municipalities. The implication of these reductions is that municipalities will be required to reprioritise projects.
Municipality economic overview
The Polokwane municipality is unfortunately not immune to the economic risks facing the nation and the world and therefore a greater need to a balanced and realistic budget.
To mitigate and adapt to these challenges, the municipality will have to resort to budgetary constraints and enforce better processes for better productivity – “do more with less”. The budget process will have to pass the National Treasury’s assessment/test of a funded budget so that service delivery can continue without financial constraints impeding its basic service delivery goals.
To meet these objectives, the municipality has applied the following key measures in its budget:
reduction in operational expenditure and in particular where more internal staff can be utilised instead of depending on service providers where practical
reduction in own funded capital expenditure
increases in tariffs in line with inflation except electricity related tariffs which is determined by Eskom and approved by NERSA.
aligning electricity tariffs in line with the time of use method to contain the Eskom bills
Hefty penalties for businesses and residential consumers who breach or illegally connect meters
To sustain our cash flows, credit control/cut offs will continue to be implemented on a daily basis (except Fridays) with a standby team to assist those consumers willing to settle their debts after hours.
Total budget for the 2020/2021 financial year is R4.8 billion made up of an operating budget of R3.6 billion and a capital budget of R1.1 billion. The focus of this budget will be directed to the key areas in line with our promises to improve the lives of our people. Ensuring good governance in the City and ensuring the effective use of public funds and enhance accountability
The following assumptions were taken into account during the compilation of MTREF budget:
1.1.1 Revenue: Tariff increases:
Electricity: NERSA has issued a guideline percentage price increase of 6.22% on electricity sales for 2020/21.
Water services: It is proposed to increase water tariffs with 7.5%.
Sanitation: It is proposed that sanitation services be increased by 5.4%
Waste Removal: It is proposed to increase tariffs by 5.4%.
Assessment rates: It is proposed to increase rates by 5.4%
Growth is estimated at 1% per annum
Debtors collection is estimated at 88%
Other tariffs: These tariffs will increase at a CPIX rate as outline in circular 98 & 99 issued by National Treasury. (Annexure A)
The municipality will embark on implementing a range of revenue collection strategies to optimize the collection of debt owed by consumers and to ensure that all revenue due is billed correctly and collected efficiently
Expenditure increases
1. Electricity bulk purchases have been increased by 6.9% in line with National Treasury’s inflation forecasts.
2. Water bulk purchases have been increased by 8.5% in line with Lepelle Northern Water Board guidelines.
3. Salaries and allowances have been increased by 6.25% subject to agreement at South African Local Government Bargaining Council.
4. Other Materials and Other expenses will increase at rate CPIX
The following are general contributory factors for the increase in levels of rates and service charges:
The cost of bulk purchases.
Cost of the social package to indigents.
Salary increase with effect from 1 July 2020.
Increased maintenance of network and infrastructure
The cost pressures of the water and electricity bulk purchases tariffs continue to grow faster than the inflation rate. Given that these tariff increases are determined by the external bodies;
the impacts they have on the municipality’s tariff are largely outside the control of the Municipality. Furthermore, the adverse impacts of the current economic climate coupled with unfavourable external pressures on services, make tariff increases higher than the CPI levels inevitable.
Indigent subsidies
Provision is made in the operating budget for the subsidizing of indigent households. This subsidy includes a free 6Kl of water, 100 units of electricity, a 100% subsidy for refuse removal and sewerage charges. A 100% rebate on assessment rates will also be given for Indigent households. The subsidy allowed, exceeds the National norm and stretches the affordability threshold of the municipality.
To qualify as indigents, the household income must not exceed R4 630 when the policy is reviewed to also cater for the child headed families and the qualifying people with disability.
The municipality further grants 80% rebates to owners of residential properties who depend on pensions or social grants provided the household income does not exceed R9 000.
.
The application of sound financial management principles for the compilation of Polokwane
Municipality’s MTREF is essential and critical to ensure that Polokwane Municipality remains
financially viable and that municipal services are provided sustainably, economically and
equitably to all communities.
The COVID-19 pandemic is simultaneously a health crisis and a global economic crisis. The National Treasury is already anticipating a 6% contraction in GDP for the year 2020.
A nationwide lockdown came into effect from 27 March 2020 as a result of the COVID-19 crisis. The effect of the lockdown and the ongoing crisis means that the economy will experience a significant downturn, while there will be an increased need for government services and assistance. Areas that could be affected as a result of the crisis include the following:
Construction, maintenance and related activities may be curtailed depending on whether they are essential. This could impact the completion of entities’ capital projects and planned maintenance.
Public facilities may not be operational and certain services may not be provided as a result of the lockdown (and beyond). This could impact the revenue of entities as well as the ongoing demand for services.
There may be an increased demand for government:
Services such as medical services, the provision of water and other sanitation services, and the provision of temporary housing or accommodation.
Assistance and support to employees, unemployed citizens, businesses, NGOs, etc.
due to the reduced activity in the economy.
As some consumers of goods and services and others may be unable to work or earn revenue during the lockdown period, there is a potential increase in the non-payment for services such as water, electricity, property taxes, levies, etc. that are due to the municipality.
Financial impact
The extent of the impact of COVID-19 on the Group’s operational and financial performance will depend on future developments, including the duration and spread of the outbreak and related economic impact on job retentions or losses, all of which are highly uncertain and cannot be predicted.
If the lockdown is to remain at these levels for an extended period, the Group’s revenue streams will begin to see declines due to less consumption demand. However, some relief is expected as the government announced a R500 billion stimulus package in April 2020 which includes a R20 billion allocation to municipalities to provide added service as outlined above.
The stimulus will aim to cushion the negative economic impact and therefore maintain to some extent the business consumers’ demand for revenue generating basic services i.e.
consumption from water and electricity.
In the event that the lock down is overly extended and the stimulus is not effective for some
reason or the other, the municipality will require additional funding from the National Treasury
to offset the loss revenues and to fund the additional expenditure incurred to combat the
COVID 19 pandemic eg resources allocated for PPE, additional water tankers etc.
In view of the aforementioned, the following tables are a consolidated overview of the 2020/2021 Medium-term Revenue and Expenditure Framework
Operating revenue and expenditure by source:
Capital expenditure
Total capital budget is R 1 201 498 519 which is funded as follows:
Description
R thousand Original
Budget
Adjusted Budget
Budget Year 2020/21
Budget Year +1 2021/22
Budget Year +2 2022/23 Total Revenue (excluding capital transfers and
contributions)
3 795 788
3 896 280 3 807 023 4 111 603 4 442 748 Total Expenditure 3 549 930 3 740 342 3 679 467 3 931 507 4 180 867
Surplus/(Deficit) 245 858 155 938 127 556 180 096 261 881 Transfers and subsidies - capital (monetary allocations)
(National / Provincial and District) 1 267 136 1 195 044 874 055 623 402 526 841 Transfers and subsidies - capital (monetary allocations)
(National / Provincial Departmental Agencies, Households, Non-profit Institutions, Private Enterprises,
Public Corporatons, Higher Educational Institutions) – – 1 500 4 750 4 750 Surplus/(Deficit) for the year 1 512 994 1 350 982 1 003 111 808 248 793 473 2020/21 Medium Term Revenue & Expenditure
Framework Current Year 2019/20
MULTI YEAR CAPITAL EXPENDITURE BUDGET Budget Year 2020/21 Description
Intergrated Urban Development Grant 303 105 850 298 407 750 298 459 450
Public Transport Network Grant 124 792 000 124 814 000 133 382 000
Neighbourhood Development Grant 35 000 000 35 000 000 35 000 000 Water Services Infrastructure Grant 50 000 000 65 000 000 60 000 000 Regional Bulk Infrastructure Grant 361 157 000 100 180 000 - Total DoRA Allocations 874 054 850 623 401 750 526 841 450
Road Concession 234 922 537 - -
Capital Replacement Reserve 91 021 132 100 000 000 110 221 994
KFW Bank 1 500 000 4 750 000 4 750 000
TOTAL FUNDING 1 201 498 519 728 151 750 641 813 444
Budget Year +1 2021/22
Budget Year +1
2022/23
Surplus for the year
1.2 Revenue by Source
Description
R thousand Original
Budget
Adjusted Budget
Budget Year 2020/21
Budget Year +1 2021/22
Budget Year +2 2022/23 Revenue By Source
Property rates 480 000 499 200 526 157 551 412 577 880
Service charges - electricity revenue 1 192 830 1 192 830 1 234 579 1 370 383 1 521 125
Service charges - water revenue 310 841 310 841 296 543 310 777 325 694
Service charges - sanitation revenue 133 773 133 773 126 897 132 988 139 372
Service charges - refuse revenue 128 627 128 627 122 016 127 872 134 010
Service charges - other – – – – –
Rental of facilities and equipment 39 539 34 539 21 362 26 579 27 855
Interest earned - external investments 28 918 24 918 13 069 13 697 14 354
Interest earned - outstanding debtors 84 800 92 800 97 347 102 020 106 917
Dividends received – – – – –
Fines, penalties and forfeits 16 960 34 960 36 673 38 433 40 278
Licences and permits 15 784 15 784 16 557 17 352 18 185
Agency services 26 500 26 500 27 798 29 133 30 531
Transfers and subsidies 1 039 367 1 113 659 1 187 428 1 286 156 1 396 717
Other revenue 297 849 287 849 100 596 104 800 109 830
Gains on disposal of PPE – – – – –
Total Revenue (excluding capital transfers and contributions)
3 795 788
3 896 280 3 807 023 4 111 603 4 442 748
Transfers and subsidies - capital (monetary allocations)
(National / Provincial and District) 1 267 136 1 195 044 874 055 623 402 526 841
Transfers and subsidies - capital (monetary allocations) (National / Provincial Departmental Agencies, Households, Non-profit Institutions, Private Enterprises,
Public Corporatons, Higher Educational Institutions) – – 1 500 4 750 4 750
Total Revenue 5 062 924 5 091 324 4 681 078 4 739 755 4 974 340
2020/21 Medium Term Revenue & Expenditure Framework
Current Year 2019/20
For Polokwane Municipality to continue improving the quality of services provided to its citizens it needs to generate the required revenue. In these tough economic times strong revenue management is fundamental to the financial sustainability of every municipality. The reality is that we are faced with development backlogs and poverty. The expenditure required to address these challenges will inevitably always exceed available funding; hence difficult choices have to be made in relation to tariff increases and balancing expenditures against realistically anticipated revenues.
The municipality’s revenue strategy is built around the following key components:
National Treasury’s guidelines and macroeconomic policy;
Growth in the Municipality and continued economic development;
Efficient revenue management, which aims to ensure a 95 per cent annual collection rate for property rates and other key service charges;
Electricity tariff increases as approved by the National Energy Regulator of South Africa (NERSA);
Achievement of full cost recovery of specific user charges especially in relation to electricity;
Determining the tariff escalation rate by establishing/calculating the revenue requirement of each service;
The municipality’s Property Rates Policy approved in terms of the Municipal Property Rates Act, 2004 (Act 6 of 2004) (MPRA);
Increase ability to extend new services and recover costs;
The municipality’s Indigent Policy and rendering of free basic services; and
Tariff policies of the Municipality.
The following table is a summary of the 2020/21MTREF (classified by main revenue source):
Description
R thousand Adjusted
Budget % Budget Year
2020/21 % Budget Year
+1 2021/22 % Budget Year
+2 2022/23 %
Revenue By Source
Property rates 499 200 12,8% 526 157 13,8% 551 412 13,4% 577 880 13,0%
Service charges - electricity revenue 1 192 830 30,6% 1 234 579 32,4% 1 370 383 33,3% 1 521 125 34,2%
Service charges - water revenue 310 841 8,0% 296 543 7,8% 310 777 7,6% 325 694 7,3%
Service charges - sanitation revenue 133 773 3,4% 126 897 3,3% 132 988 3,2% 139 372 3,1%
Service charges - refuse revenue 128 627 3,3% 122 016 3,2% 127 872 3,1% 134 010 3,0%
Service charges - other – 0,0% – 0,0% – 0,0% – 0,0%
Rental of facilities and equipment 34 539 0,9% 21 362 0,6% 26 579 0,6% 27 855 0,6%
Interest earned - external investments 24 918 0,6% 13 069 0,3% 13 697 0,3% 14 354 0,3%
Interest earned - outstanding debtors 92 800 2,4% 97 347 2,6% 102 020 2,5% 106 917 2,4%
Dividends received – 0,0% – 0,0% – 0,0% – 0,0%
Fines, penalties and forfeits 34 960 0,9% 36 673 1,0% 38 433 0,9% 40 278 0,9%
Licences and permits 15 784 0,4% 16 557 0,4% 17 352 0,4% 18 185 0,4%
Agency services 26 500 0,7% 27 798 0,7% 29 133 0,7% 30 531 0,7%
Transfers and subsidies 1 113 659 28,6% 1 187 428 31,2% 1 286 156 31,3% 1 396 717 31,4%
Other revenue 287 849 7,4% 100 596 2,6% 104 800 2,5% 109 830 2,5%
Gains on disposal of PPE – 0,0% 0,0% 0,0% 0,0%
Current Year 2019/20 2020/21 Medium Term Revenue & Expenditure Framework
In line with the formats prescribed by the Municipal Budget and Reporting Regulations, capital transfers and contributions are excluded from the operating statement, as inclusion of these revenue sources would distort the calculation of the operating surplus.
Revenue generated from rates, services charges and operational grants forms a significant percentage of the revenue basket for the Municipality. Service charges revenues comprise more than 40% of the total revenue mix. In the 2019/20 financial year, revenue from services charges totalled R1.766 billion or 43.9 per cent. This increases to R1.780 billion, R1.942billion and R2.120 billion in the respective financial years of the MTREF. This growth can be mainly attributed to the supplementary valuation rolls and the increased share that the sale of electricity and water contributes to the total revenue mix, which in turn is due to rapid increases in the Eskom tariffs for bulk electricity and bulk water. The above table includes revenue foregone arising from discounts and rebates associated with the tariff policies of the Municipality. Details in this regard are contained in MBRR SA1.
Operating Grants & Subsidies are the second largest revenue source totalling 31 per cent in 2020/21 and increase to 32 per cent in 2022/23. Property rates are the third largest revenue source totalling 13.8 per cent or R526 million rand in 2020/21 and increases to R577million by 2022/23. The following table gives a breakdown of the various operating grants and subsidies allocated to the municipality over the medium term:
1.3 Operating Transfers and Grant Receipts
Description
R thousand Budget Year
2020/21
Budget Year +1 2021/22
Budget Year +2 2022/23 EXPENDITURE:
Operating expenditure of Transfers and Grants
National Government: 1 187 428 1 286 156 1 396 717 Local Government Equitable Share 1 007 763 1 102 819 1 196 245
EPWP Incentive 9 527 – –
Integrated National Electrification Programme 49 000 30 000 30 000 Finance Management 2 500 2 500 2 500 Intergrated Urban Development Grant (IUDG) 47 860 68 337 90 972 Public Transport and Systems 64 500 68 500 71 000 Infrastructure skills development fund 6 278 6 000 6 000 Energy Efficiency and Demand Management – 8 000 – Total operating expenditure of Transfers and Grants: 1 187 428 1 286 156 1 396 717
2020/21 Medium Term Revenue & Expenditure
Framework
1.4 Expenditure by Type
The Municipality’s expenditure framework for the 2020/21 budget and MTREF is informed by the following:
Balanced budget constraint (operating expenditure should not exceed operating revenue) unless there are existing uncommitted cash-backed reserves to fund any deficit;
Funding of the budget over the medium-term as informed by Section 18 and 19 of the MFMA;
The capital programme is aligned to the asset renewal strategy and backlog eradication plan;
Operational gains and efficiencies will be directed to funding the capital budget and other core services; and
Strict adherence to the principle of no project plan no budget. If there is no business plan no funding allocation can be made.
Description
R thousand Original
Budget
Adjusted Budget
Budget Year 2020/21
Budget Year +1 2021/22
Budget Year +2 2022/23 Expenditure By Type
Employee related costs 921 193 910 772 990 053 1 045 408 1 106 042
Remuneration of councillors 40 100 40 100 42 511 44 977 47 585
Debt impairment 200 000 200 000 250 000 300 000 350 000
Depreciation & asset impairment 237 000 237 000 255 000 285 000 300 000
Finance charges 85 122 72 122 97 987 118 065 118 065
Bulk purchases 968 547 971 547 1 051 822 1 120 190 1 193 002
Other materials 85 588 76 807 89 587 87 378 91 572
Contracted services 757 056 949 301 682 021 706 201 740 099
Transfers and subsidies 11 500 11 500 11 500 11 500 11 500
Other expenditure 243 824 271 193 208 987 212 788 223 002
Loss on disposal of PPE – – – – – Total Expenditure 3 549 930 3 740 342 3 679 467 3 931 507 4 180 867
2020/21 Medium Term Revenue & Expenditure Framework
Current Year 2019/20
1.5 Summary of operating expenditure by standard classification item
The budgeted allocation for employee related costs for the 2020/21 financial year totals R990 million, which equals 26.9 percent of the total operating expenditure. Salary increases have been factored into this budget at a percentage increase of 6.25 per cent for the 2020/21 for the MTREF. Included in the R 990 million is the R 28.3 million for Leave Pay and Long Service Awards.
The cost associated with the remuneration of councillors is determined by the Minister of Co- operative Governance and Traditional Affairs in accordance with the Remuneration of Public Office Bearers Act, 1998 (Act 20 of 1998). The most recent proclamation in this regard has been taken into account in compiling the Municipality’s budget.
The provision of debt impairment was determined based on an annual collection rate and the Debt Write-off Policy of the Municipality. For the 2020/21 financial year this amount increased to R250 million. While this expenditure is considered to be a non-cash flow item, it informed the total cost associated with rendering the services of the municipality, as well as the municipality’s realistically anticipated revenues.
Provision for depreciation and asset impairment has been informed by the Municipality’s Asset Management Policy. Depreciation is widely considered a proxy for the measurement of the
Description
R thousand Adjusted
Budget % Budget Year
2020/21 % Budget Year
+1 2021/22 % Budget Year +2 2022/23 % Expenditure By Type
Employee related costs 910 772 24.3% 990 053 26.9% 1 045 408 26.6% 1 106 042 26.5%
Remuneration of councillors 40 100 1.1% 42 511 1.2% 44 977 1.1% 47 585 1.1%
Debt impairment 200 000 5.3% 250 000 6.8% 300 000 7.6% 350 000 8.4%
Depreciation & asset impairment 237 000 6.3% 255 000 6.9% 285 000 7.2% 300 000 7.2%
Finance charges 72 122 1.9% 97 987 2.7% 118 065 3.0% 118 065 2.8%
Bulk purchases 971 547 26.0% 1 051 822 28.6% 1 120 190 28.5% 1 193 002 28.5%
Other materials 76 807 2.1% 89 587 2.4% 87 378 2.2% 91 572 2.2%
Contracted services 949 301 25.4% 682 021 18.5% 706 201 18.0% 740 099 17.7%
Transfers and subsidies 11 500 0.3% 11 500 0.3% 11 500 0.3% 11 500 0.3%
Other expenditure 271 193 7.3% 208 987 5.7% 212 788 5.4% 223 002 5.3%
Loss on disposal of PPE – 0.0% 0.0% – 0.0% 0.0%
Total Expenditure 3 740 342 100.0% 3 679 467 100.0% 3 931 507 100.0% 4 180 867 100.0%
Current Year 2019/20 2020/21 Medium Term Revenue & Expenditure Framework
rate asset consumption. Budget appropriations in this regard total R255 million for the 2020/21 financial and equates to 7.2 per cent of the total operating expenditure.
Finance charges consist primarily of the repayment of interest on long-term borrowing (cost of capital). Finance charges make up 2.7 percent (R97million) of operating expenditure.
Bulk purchases are directly informed by the purchase of electricity from Eskom and water from Lepelle Water. The annual price increases have been factored into the budget appropriations and directly inform the revenue provisions. Bulk purchases make up 28.6 percent (R1.051 billion) of operating expenditure. The expenditures include distribution losses.
Contracted services have been reduced due to cost containment measures and the anticipated minimal use of contractors. In 2019/20 financial year budget was R 949 million currently reduced to R 682 million for 2020/21.
Other expenditure comprises of various line items relating to the daily operations of the
municipality. This group of expenditure has also been identified as an area in which cost
savings and efficiencies can be achieved. Printing and stationary, subsistence and travelling,
attending of conferences and workshops have significantly been reduced or limited to zero
growth. Other expenditure makes up 5.7percent (R 209 million) of operating expenditure.
1.6 Funding of Operating Budget
Funding is obtained from various sources, the major sources being service charges such as electricity, water, sanitation, and refuse collection, property rates, grants and subsidies received from National government.
1.7 Grant Allocations
Municipalities play a critical role in furthering government’s objective of providing services to all. Cities are also driving South Africa’s growth and development. However, to play these roles, cities need to be supported and funded. Local Government conditional grants are being reformed to provide targeted support to different types of municipalities. The following projected grant allocations to the municipality in terms of the 2020/21 Division of Revenue Bill have been included in this medium term budget.
GRANTS AND SUBSIDIES AS PER DIVISION OF REVENUE BILL Govt Gazette no 43025 of 17 February 2020
2020/21 2021/22 2022/23
Infrastructure Grants 000 000 000
Intergrated Urban Development Grant 350 966 366 745 389 431
Regional Bulk Infrastructure Grant (RBIG) 361 157 100 180 -
Integrated National Electrification Programme Grant (INEP)
49 000 30 000 30 000Public Transport Network Grant(PTNG) 189 292 193 314 204 382
Water services infrastructure grant 50 000 65 000 60 000
Neighbourhood Development Partnership Grant (NDPG)
35 000 35 000 35 000Sub Total 1 035 415 790 239 718 813
Specific Purpose Current Grants
Financial Management Grant (FMG) 2 500 2 500 2 500
Infrastructure Skills Development Grant (ISDG) 6 278 6 000 6 000
Energy Efficiency and Demand Side Management Grant (EEDSM) - 8 000 -
Extended Public Works Programme (EPWP) 9 527 - -
Sub Total 18 305 16 500 8 500
Equitable Share 1 007 763 1 102 819 1 196 245
Sub Total Municipality 2 061 483 1 909 558 1 923 558
Allocations- in-kind-Grants (Schedule 6)
Water Services Infrastructure Grant
Municipal Systems Improvement Grant - 200 200
Integrated National Electrification Programme (Escom)
52 108 54 138 61 413Neighbourhood Development Partnership Grant (Technical Assistance)
300 5 000 5 384Sub Total 52 408 59 338 66 997
TOTAL 2 113 891 1 968 896 1 990 555
GRANTS AND SUBSIDIES AS PER DIVISION OF REVENUE BILL
The 2020/21 MTEF includes large reductions in planned transfers to municipalities. The implication of these reductions is that municipalities will be required to reprioritize projects.
Larger reductions in grants are mainly affecting urban municipalities which have the capacity to offset the effects of these cuts from their own revenue investments. (RBIG and WSIG) The municipality has allocated the following additional funds towards COVID 19 costs.
Savings were from the following line items
Travel and subsistence operational costs
Workshops
Research and development
Accommodation costs
Bulk Purchases Electricity which had incremental budget of 19% before the NERSA Guideline
1.9 CAPITAL BUDGET PER DIRECTORATE
The Capital budget is funded by the allocations made to the city by National Government in the form of grants, donations and internally generated funds.
The table below represents the capital budget per vote (Directorate)
Item Amount
Danger Allowance 1 954 320.00
M aterials Supplies 5 746 000.00
Cleaning and Sanitizing 3 000 000.00
M ass Graves 1 500 000.00
PPC 1 500 000.00
Data Costs 2 000 000.00
Provision of Laptops 1 526 705.86
15 700 320.00
Description
R thousand Adjusted
Budget % Budget Year
2020/21 %
Budget Year +1 2021/22
% Budget Year
+2 2022/23 %
Single-year expenditure to be appropriated
Vote 1 - Chef Operations Office 857 0,1% 2 796 0,2% 3 471 0,5% 4 453 0,7%
Vote 2 - Municipal Manger Office – 0,0% – 0,0% – 0,0% – 0,0%
Vote 3 - Water and Sanitation 892 528 58,2% 536 244 44,6% 288 618 39,6% 192 612 30,0%
Vote 4 - Energy Services 69 559 4,5% 20 201 1,7% 28 631 3,9% 36 943 5,8%
Vote 5 - Community Services 72 188 4,7% 67 312 5,6% 52 271 7,2% 43 925 6,8%
Vote 6 - Public Safety 1 806 0,1% 2 527 0,2% 2 516 0,3% 8 384 1,3%
Vote 7 - Corporate and Shared Services 53 300 3,5% 31 043 2,6% 24 460 3,4% 20 407 3,2%
Vote 8 - Planning and Economic Development 15 864 1,0% 5 805 0,5% 7 772 1,1% 7 657 1,2%
Vote 9 - Budget and Treasury 2 598 0,2% 1 000 0,1% – 0,0% – 0,0%
Vote 10 - Transport Services 424 958 27,7% 534 570 44,5% 320 414 44,0% 327 434 51,0%
Total Capital Expenditure - Vote 1 533 659 100,0% 1 201 499 100,0% 728 152 100,0% 641 813 100,0%
Current Year 2019/20 2020/21 Medium Term Revenue & Expenditure Framework