HIV-1 3
- The Epidemiology of HIV-1 3
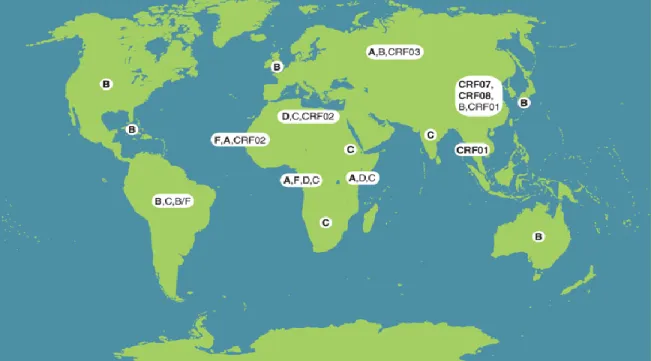
- The Classification of HIV-1 and geological distribution 3
- The Structure of HIV-1 5
- The Life Cycle of HIV-1 7
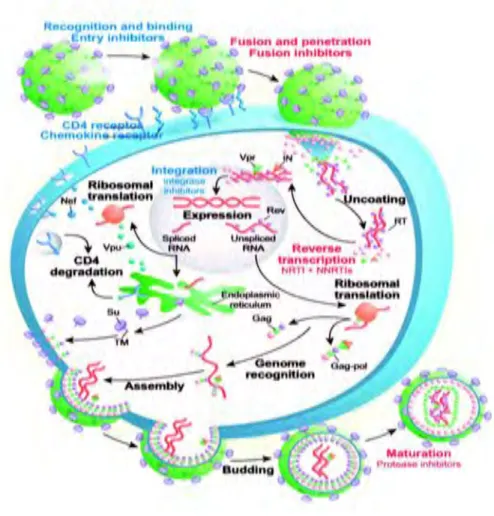
The Env glycoprotein is a heterodimer of gp120 attached to gp41 (transmembrane glycoprotein). The gagpol gene consists of the Gag polyprotein that includes the proteins of the nucleocapsid. It also consists of the gag-pol polyprotein that affects some structural proteins and the viral enzymes: protease (PR), reverse transcriptase (RT) and integrase (IN).
The env gene encodes the precursor polypeptide gp160, which consists of outer gp120 and transmembrane gp41. Tat, rev, rev, nef, vif, vpr and vpu are accessory genes that encode proteins that control the HIV virus to infect the cell and produce new copies of the virus (Sierra et al., 2005). The interaction of gp120 with CD4 is followed by binding to a CC chemokine receptor such as CCR5 or CXCR4.
Antiretroviral Therapy 8
Antiretroviral Treatment in South Africa 9
HIV-1 Drug Resistance 12
HIV-1 drug resistance results from the accumulation of mutations in viral genes that are targeted by the drug (Charpentier et al., 2004). Thus, mutations can occur each time the virus replicates (estimated rate of 1×10⁻⁹ to 1×10-12 mutations per cycle) resulting in a quasispecies of viral variants of related but distinctly different viruses ( Abram et al., 2010, Halvas et al., 2010). Drug-resistant variants appear due to prolonged treatment and high viral fitness of wild-type resistant variants or from suboptimal treatment that allows continued virus replication.
It can also be caused by transmission of resistant variants to treatment-naive patients (Martinez-Cajas and Wainberg, 2008). For most ARV drugs, resistance requires the presence of more than one mutation in the gene, and these mutations can occur continuously even if the patient is on therapy (Charpentier et al., 2004). Secondary mutations develop later and increase viral resistance and fitness when combined with other mutations (i.e. they cannot cause resistance on their own) (Clavel and Mammano, 2010, Nyombi et al., 2008).
HIV-1 Reverse Transcriptase 13
HIV-1 Reverse Transcriptase Inhibitors 14
- Resistance to Nucleoside Reverse Transcriptase Inhibitors 15
- Resistance to Non-Nucleoside Reverse Transcriptase Inhibitors 17
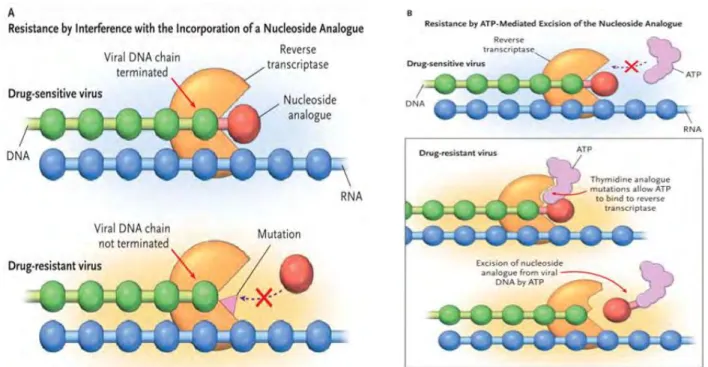
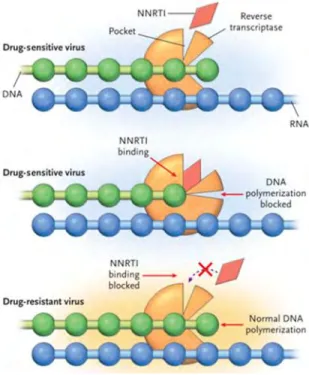
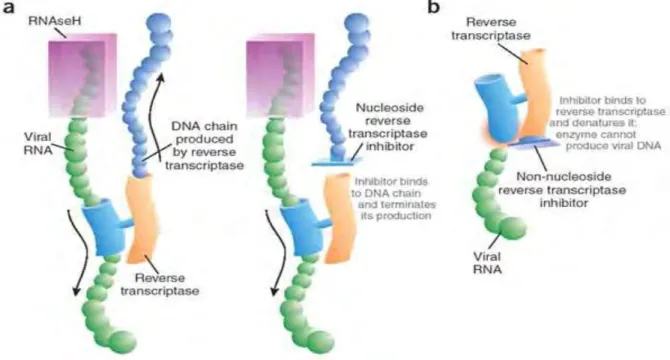
The binding of the inhibitor affects the flexibility of RT, preventing the synthesis of DNA (Figure 1.6) (Shafer, 2002). a) The NRTIs are similar to the dNTPs, but lack the 3' hydroxyl group. The example of such a mechanism is the high level of resistance to 3TC and FTC caused by the M184V/I mutation (Singh et al., 2010). This mutation also causes resistance to Zalcitabine (ddC), ddi, ABC and has been reported to reduce viral fitness (Singh et al., 2010; Tang and Shafer, 2012).
In addition, the presence of M184V together with the TAMs has been reported to be the most common pattern causing resistance to all NRTIs (Tang and Shafer, 2012). The mutations in the drug-resistant viruses prevent the incorporation of the nucleoside analog into the growing viral DNA. Mutations K103N/S and V106M are the most common NNRTI mutations and they develop due to resistance to etravirine (ETV) and or rilpivirine (RVP) (Tang and Shafer, 2012).
HIV-1 Protease 18
HIV-1 Protease Inhibitors 19
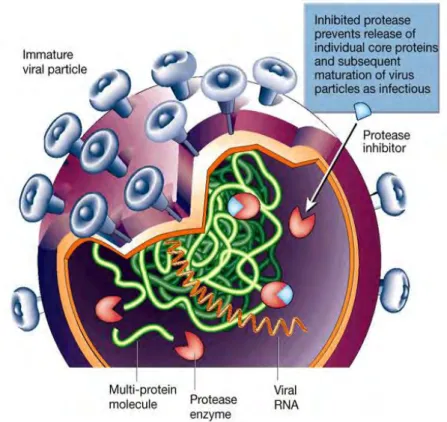
PIs resemble the PR substrate in structure and thus compete with it for binding to the active site of the PR enzyme (Shafer, 2002). They therefore inhibit the protease enzyme function and the formation of the viral proteins (Figure 1.10) (Clavel and Mammano, 2010, Shafer, 2002). The protease inhibitor targets the protease enzyme by preventing cleavage of the polypeptide and maturation of the virion.
These PIs are essential components of HAART because of their potency compared to the other ARVs (Ali et al., 2010). All these PIs are potentiated with RTV used to inhibit cytochrome P450 (cyp) 3A, except for NFV which has low antiviral efficacy (Tang and Shafer, 2012).
Resistance to Protease Inhibitors 20
21 Primary mutations occur at amino acids located within the substrate cavity and thus induce resistance by reducing the binding affinity between the inhibitor and the mutant PR enzyme. Secondary mutations occur at amino acids located outside the substrate cavity and can compensate for mutations found in the active site or reduce the activity of the mutated protease (Amiel et al., 2011, Clavel and Hance, 2004, Shafer, 2002). The most characteristic PI mutation observed in patients who have developed resistance to various PIs is V82A (Clavel and Mammano, 2010).
All of these mutations confer resistance to one or more PIs, except for D30N and I50L, which confer resistance to NFV and ATV. Most of these mutations reduce the replication capacity of the virus, as processing of the natural substrate (Gag) is reduced (Dam et al., 2009). However, resistance to protease inhibitors develops not only at the PR gene, but also at protease cleavage sites composed of Gag and gagpol polyproteins (Clavel and Mammano, 2010).
The Contribution of Gag Mutations to Protease Inhibitor Resistance 21
22 splice site mutation K436E and or I437T/V were present in all the resistant viruses without PR mutations. However, when these mutations were introduced into the wild type, they caused PI resistance in all the viruses that had no primary mutations. This suggests that HIV-1 may induce resistance to PIs by altering the PR substrate instead of the PR itself (Nijhuis et al., 2007).
Drug Resistance Testing 22
Genotypic methods 22
Phenotypic methods 23
Testing for minority variants 23
- Standard cloning and sequencing of multiple clones 23
- Single genome sequencing 24
- Allele Specific PCR 24
- Ultra Deep Pyro- Sequencing 24
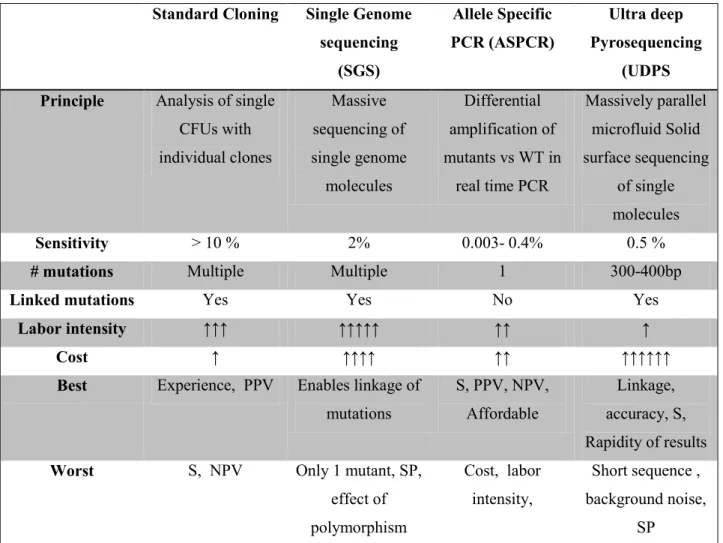
This method allows a more refined analysis of the entire genome with sequencing of the individual virus particles obtained from the original HIV-1 particle, enabling genetic linkage analysis of each detected mutation. The sensitivity of SGS in detecting minority variants can be as low as 2% of the virus population (Table 1.3), but this method is expensive, time-consuming and labor-intensive (Paredes i Deiros, 2009). However, ASPCR remains an important and affordable method for detecting minority variants (Paredes i Deiros, 2009).
25 in addition, its sensitivity to detect minority variants can be as low as 0.5-1% in the viral population (Paredes i Deiros, 2009). UDPS also allows for individual template sequencing and can determine genetic relatedness within the same viral genome in the same manner as cloning and SGS (Gianella and Richman, 2010). Although UDPS remains one of the most sensitive methods, it is more expensive and generates a lot of data that requires extensive bioinformatic expertise in order to fully analyze the data (Paredes i Deiros, 2009, Ramirez et al., 2013).
Minority drug resistance mutations 26
HIV analysis using online tools 27
Stanford University HIV Drug Resistance Database (HIVdb) 27
RegaDB sequence analysis tools 27
64 Figure 2.12: Maximum likelihood (ML) trees of the HIV-1 PCSM001 half region. ML was constructed using the AIC-selected HKY+ I+ G evolution model implemented in MODELTEST 3.7. Most sequences at time point 2 had the genotype: L10F, M46I, I54V, V82A (purple squares). 74 Figure 2.18: Maximum likelihood (ML) trees of the HIV-1 PCSM004 semi-region. ML was constructed using the AIC-selected K81uf +I+G evolution model implemented in MODELTEST 3.7.
Figure 2.20: Maximum likelihood (ML) trees of the HIV-1 pol region of PCSM0012. The ML was constructed using the TVM +I+G evolution model selected by AIC implemented in MODELTEST 3.7. Phylogenetic analysis was performed to examine the evolution of the PR and RT resistance mutations at the first and second time points. In the patients who remained on second-line therapy, some genotypes were still detected at the second time point, with some drug resistance mutations no longer detected.
HyPhy package in Datamonkey 27
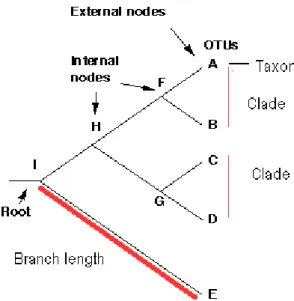
An overview of Phylogenetic analysis 28
Methods for estimating phylogenetic trees 29
- Neighbor joining method 29
- Maximum likelihood methods 30
Phylogenetic analysis was performed to assess the evolution of the virus as well as to assess the relationship between the sequences with PI resistance mutations at time 1 and time 2. There was intermixing between the sequences at time points 1 and 2, with the exception of PCSM007, where there was no intermixing of the sequences between time points. Phylogenetic analysis of PCSM001 examining the evolution of PI resistance mutations at time 1 and time 2.
Phylogenetic analysis of PCSM002 examining the evolution of PI resistance mutations at the first and second time points. Phylogenetic analysis of PCSM007 examining the evolution of PI resistance mutations at the first and second time points. 2.4.2.1.1 Phylogenetic analysis of PCSM004 examining the evolution of RT resistance mutations at the first and second time points.
However, there are two sequences at the 2nd time point that are part of the cluster, but also outside the cluster. Phylogenetic analysis of PCSM009 examining the evolution of RT resistance mutations at the first and second time points. In this patient, the majority of sequences at the first time point were wild type (orange squares), with some sequences harboring the K103N mutation (green squares) and one sequence containing V106M (brown) intermixing with the K103N mutation at the second time point. mutation. point (Figure 2.20a).
In most patients who remained on second-line therapy, there was mixing between the first and second time point sequences, with the exception of PCSM007, where three clones from the first time point clustered with the second time point sequences (Figure 2.16 ). The phylogenetic trees were further analyzed to assess the evolution of the RT and PR resistance mutations at the first and second time points. In the case of patients switching from first-line to second-line treatment, most drug resistance mutations detected at the first time point were not observed at the second time point, except for PCSM012, where some drug resistance mutations were still detected at the second time point. the 2nd time point.
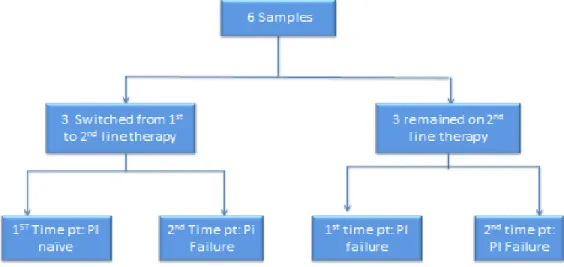
In this study, samples from time point 2 of patients switching from 1st to 2nd line therapy were sequenced by UDPS and, where available. When patients switched from 1st to 2nd line therapy, most minority variants were detected at the 2nd time point and were associated with their 1st line therapy, mostly NNRTI mutations.
Nucleotide substation model 31
Model selection 31
The most commonly used methods for selecting the appropriate model include the likelihood ratio test (LTR) and the Akaike information criterion (AIC) (Bos and Posada, 2005, Posada and Crandall, 1998). These methods provide rigorous statistical support to select and justify the appropriate model (Bos and Posada, 2005). 32 The AIC calculates the likelihood of the models and gives a score based on the number of model parameters (Bos and Posada, 2005, Posada and Crandall, 1998).
The AIC has an important advantage over LRT by comparing all models, rather than performing sequential pairwise comparisons (Bos and Posada, 2005).
Modeltest 32
Aim and objectives of the study 32