OF ACID PHOSPHATASE IN THE LICHEN CLADONIA PORTENTOSA
Ntombizamatshali P. Mtshali
University of KwaZulu-Natal MSc.
Submitted in fulfilment of the academic requirements for the degree of
Doctor of Philosophy in the
Research Centre for Plant Growth and Development, School of Biological and Conservational Sciences
FACULTY OF SCIENCE AND AGRICULTURE University of KwaZulu-Natal
Pietermaritzburg
16 May 2011
II
DECLARATION
MOLECULAR CHARACTERIZATION OF ACID PHOSPHATASE IN THE LICHEN CLADONIA PORTENTOSA
I, Ntombizamatshali Prudence Mtshali, student number: 204507919 declare that:
I. The research reported in this dissertation, except where otherwise indicated, is the result of my own work in the Research Centre for Plant Growth and Development, School of Biological and Conservation Sciences, University of KwaZulu-Natal Pietermaritzburg;
II. This dissertation has not been submitted for any degrees or examination at any other University;
III. This thesis does not contain data, figures or writing, unless specifically acknowledged, copied from other researchers; and
IV. Where I have reproduced a publication of which I am an author or co-author, I have indicated which part of the publication was contributed by me.
Signed at ___________________________on the _________________ day of_______________________________, 2011.
SIGNATURE: _________________________________________________
III
DECLARATION BY SUPERVISORS
We hereby declare that we acted as Supervisors for this PhD student:
Ntombizamatshali P. Mtshali 204507919
Molecular Characterization of acid phosphatase in the lichen Cladonia portentosa
Regular consultation took place between the student and ourselves throughout the investigation. We advised the student to the best of our ability and approved the final document for submission to the Faculty of Science and Agriculture Higher Degrees Office for examination by the University appointed Examiners.
We certify that the above statement is correct:
SUPERVISOR: PROFESSOR J. VAN STADEN
Signed:………..
CO-SUPERVISOR: DR J.F. FINNIE
Signed:………..
IV
FACULTY OF SCIENCE AND AGRICULTURE
DECLARATION 1: PLAGIARISM
I, Ntombizamatshali Mtshali, student number: 204507919, declare that
The research reported in this thesis, except where otherwise indicated, is my original research.
(i) This thesis has not been submitted for any degree or examination at any other university.
(ii) This thesis does not contain other persons‟ data, pictures, graphs or other information, unless specifically acknowledged as being sourced from other persons.
(iii) This thesis does not contain other persons' writing, unless specifically acknowledged as being sourced from other researchers. Where other written sources have been quoted, then:
a) Their words have been re-written but the general information attributed to them has been referenced.
b) Where their exact words have been used, then their writing has been placed in italics and inside quotation marks, and referenced.
(iv) This thesis does not contain text, graphics or tables copied and pasted from the Internet, unless specifically acknowledged, and the source being detailed in the thesis and in the Reference sections.
Signed………
Declaration Plagiarism 22/05/08 FHDR Approved
V
DECLARATION 2 - PUBLICATIONS
Details of contribution to publication that form part and/or include research presented in this thesis(include publications in preparation, submitted, in press and published and give details of the contributions of each author to the experimental work and writing of each publication).
Purification and biophysical characterization of secreted acid phosphatase from lichen Cladonia portentosa (in preparation)
N.P. Mtshali1, P. Crittenden2*, P. Dyer2, D. Archer2, J.F. Finnie1, E.J. Hogan2, A. Plumridge2, C. Lounds2 and J.
van Staden1
1Research Centre for Plant Growth and Development, School of Biological and Conservation Sciences, University of KwaZulu-Natal, Pietermaritzburg, Private Bag X 01, Scottsville 3209, SOUTH AFRICA
2Fungal Biology and Genetics Department, School of Biology, University of Nottingham University Park, Nottingham NG7 2RD, UK.
Cytochemical localization of acid phosphatase and its regulation by inorganic phosphate from the mycobiont Cladonia portentosa (in preparation)
N.P. Mtshali1, P. Crittenden2*, P. Dyer2, D. Archer2, J.F. Finnie1 and J. van Staden1
1Research Centre for Plant Growth and Development, School of Biological and Conservation Sciences, University of KwaZulu-Natal, Pietermaritzburg, Private Bag X 01, Scottsville 3209, SOUTH AFRICA
2Fungal Biology and Genetics Department, School of Biology, University of Nottingham University Park, Nottingham NG7 2RD, UK.
Gene expression profiling of phosphorus starvation and menadione in the mycobiont of Cladonia portentosa (in preparation)
N.P. Mtshali1, J.F. Finnie1, and J. van Staden1
1Research Centre for Plant Growth and Development, School of Biological and Conservation Sciences, University of KwaZulu-Natal, Pietermaritzburg, Private Bag X 01, Scottsville 3209, SOUTH AFRICA
Signed………
Declaration Publications FHDR 22/05/08 Approved
VI
ABSTRACT
Acid phosphatases (apase) are important hydrolytic enzymes that function in the acquisition, production; transport and recycling of inorganic phosphate (Pi), thus making a significant contribution towards nutrients dynamic of many ecological niches. The aim of this study was to characterize the apase enzyme found in the lichen Cladonia portentosa at the molecular level.
The initial experiment entailed cloning the apase gene by PCR using degenerate primers designed from close relatives of C. portentosa from the Ascomycete family. The isolation of apase gene from Cladonia portentosa using PCR was not successful.
Attempts were then made to purify the secreted apase and to determine its biochemical and molecular properties and to allow comparison with already characterized secreted phosphatases from other fungal sources existing in the NCBI database. It was anticipated that the partial sequence of the purified enzymes would provide a corresponding apase gene. The acid phosphatase enzyme was partial purified to 45 fold by a gel filtration with a yield of 18%. It gave a single, broad glycoprotein band on native PAGE and SDS-PAGE corresponding in size to 250 and 148 kDa, respectively.
Under reducing conditions, the purified enzyme migrated as two bands of 116 and 32 kDa, indicating the heterodimer nature of this enzyme. Only one distinct band, (pI 6.4) was observed after electrofocusing. The optimum temperature for the enzyme was 65 °C where an optimal pH was detected at 2.5. The enzyme was inhibited by known acid phosphatase inhibitors (fluoride, molybdate, orthovanadate and tartrate) and the metals (Cu2+ and Zn2+). The purified enzyme demonstrated broad substrates selectivity and had a KM of 31.2±0.25 µM for phytic acid.
Peptide analysis by Mass Spectrometry (MS) MALDI-TOF indicated the presence of two apase proteins. The amino sequences of purified apase/s from Cladonia portentosa were FLAETNPAPFGH, AVGLGYVEELLAR and AQGLGYVQEVLAR. Comparing the amino acids of the sequenced protein with that of already known proteins confirmed the enzyme to be a secreted histidine acid phosphatase, resembling other acid phosphatases and phytase from several filamentous fungi with respect to amino acid composition.
VII To investigate the effect of phosphorus on C. portentosa apase, the mycelium was grown under different concentrations of Pi [0.05, 1.0, 3.0, 10 and 100 mM (KH2PO4)]. The aim was to localize the apase enzyme and to screen for the occurrence of the gene coding for the acid phosphatase enzyme. A treatment of 3.0 mM Pi induced high levels of apase compared to all other treatments. In addition, cultures of C. portentosa were grown in axenic cultures to study the effect of pH and Pi versus menadione on the production of acid phosphatase and mycelia growth. A culture media of pH 4.8 and 6.0 resulted in higher apase secretion than when compared with pH 2.5 medium. The presence of 2.0 µM menadione marginally increased levels of the apase compared to the control treatment. Apase was further localized cytochemically using fluorescent substrate-enzyme-labelled fluorescence (ELF-97) which forms a fluorescent crystalline precipitate at the site of phosphate activity. Fluorescent microscope revealed that the enzyme was present in all treatments, irrespective of Pi concentration, however, the fluorescence signals were intense in low Pi concentrations (0.05 and 1.0 and 3.0 mM Pi).
Ultrastructure localization using live mycelium under confocal microscopy using Vector blue III substrate revealed that the enzyme was localized in the cytoplasm, cell membrane, vacuole and small organelles, presumed to be endosomes. Co-staining with FM4-64, confirmed the punctuate structure to be secretory vesicles or a vacuolar network.
To investigate the effect of P starvation on C. portentosa at a molecular level, the effect of Pi on the gene expression profile was examined. The generation of a cDNA library from axenic grown mycelium treated with P provided a foundation for the identification and characterization of genes expressed in the P treated mycelium through expressed sequence tags (ESTs). Several genes were identified whose transcriptional profiles have been significantly changed by phosphorus treatment and menadione. They include genes required for signal transduction and vesicular transport, cell biosynthesis and protein metabolism and stress response. In conclusion, this study constitutes the first step towards understanding the molecular mechanism governing acid phosphatase in C. portentosa.
VIII
PREFACE
My journey on this project started like the adventure of Alice in Wonderland, I thought I was just chasing a rabbit around the corner, a relative short journey but those few steps became a journey lasting a few years. My dreams became my very own nightmares that kept me in suspense until the very end. Through the years, I‟ve come to learn that Science is like an infinite pit, where today‟s discovery becomes a foundation of tomorrow‟s progress. I hope my research can be a step to such findings for tomorrow‟s gateway. With limited years of study, one can only go a certain distance before the resources and oil wells run dry.
Disappointments and unexpected results are part of the game. My subject of study became so personal, a beloved baby, that kept me awake at night and would not rest during the day.
At the end, I was disappointed with some of my expected results from this project but in retrospect I‟ve learnt much more and discovered things I never knew. I‟m grateful to be given the opportunity to study this beautiful Reindeer‟s lichen; I could not have chosen a better subject.
I„m grateful for the guidance and mentoring from South Africa and England and all interesting mentors that I met along the way. I‟m grateful to those individual who took care of me and my well-being at home and abroad. There were times when circumstances pushed me over the edge, but I was given a pair of wings that took me to unknown territories. I was reminded of the words of Christopher Logue, which resonated louder than ever. Upon my landing I still encountered challenges, and I kept falling. I remain forever grateful to all those hands that picked me up when I was down. Yes, Angels exist but they do not fly nor do they have wings. It is true: “Umuntu ngumuntu ngabantu”- Zulu proverbs “you are a human because of others”- we rely on others for our success.
IX
INSPIRATION
La quête scientifique a cela de remarquable qu’elle presse sans cesse l’homme à se dépasser-Blaise Pascal (What is striking in the scientific quest, is that it pushes
Continuously the man to surpass himself)
You may write me down in history, with your bitter, twisted lies...
I rise, up from a past that's rooted in pain. I rise.
I'm a black ocean, leaping and wide.
I am the dream and the hope of the slave. I rise, I rise, and I rise
—Maya Angelou (extracted from ‗Still I Rise‘)
Come to the edge. We might fall. Come to the edge.
It‟s too high!-COME TO THE EDGE!
And they came. And he pushed. And they flew.
—Christopher Logue-New Numbers
Weil ein Schwarzer hässlich ist.
Ist mir den kein Herz gegeben?
Bin ich micht von Fleisch und Blut?
—Mozart, Die Zauberflöte
X
ACKNOWLEDGEMENT
I express my heart-felt gratitude to Prof. Johannes van Staden and Dr Jeff Finnie for their supervision and guidance. In particular, Prof. van Staden is thanked for his continuous enthusiasm on my project, and for opportunities and facilities afforded to me for my project to be successful. In addition, Prof. van Staden is thanked for financial support provided in part by way of NRF (National Research Foundation).
My immense gratitude to Prof. Peter Crittenden, Prof. David Archer and Dr Paul Dyer of the Fungal Genetics Department, School of Biology, Nottingham University, UK: - for their supervision and patience. My time in Nottingham was time of immense joy, growth and development, I felt nurtured. I remain forever grateful for all the good experiences and their continuous support throughout my PhD studies. I also extended my gratitude to Dr Crittenden and Mrs Margaret Crittenden for opening their home- feeding and taking care of me when I was away from home. I‟m grateful for lichen samples sent to South Africa.
Thanks to Mr Lee Shunburne. I would like to thank Dr Chris Lounds and Dr Andy Plumridge for trouble-shooting, technical help in protein purification and creative suggestion in Proteomics analysis. Thanks to Dr Erika Hogan for all her help and kindness and accompaniment on the field trip. Thank to Dr Kevin Bailey for protein sequencing and his help in interpreting the raw data.
I would like to thank Dr Sabine Lüthje, Department of Botany, at the University Hamburg, Germany, for her warmth and help. My thanks to everyone in the laboratory, especially Dr Ljiljana Menckhoff and Margret Vielhaben. Thanks for the gift of Ramukegel.
Thanks to Prof Vince Ördög for financial support for my visit to Hungary. I highly grateful to Prof Ervin Balázs for hosting me in his laboratory in the Institute of the Hungarian Academy of Sciences, Department of Applied Genomics. Big thanks to Dr Vilmos Soós, for all his help around the laboratory and RNA transcripts analysis.
Big thank you to Dr Wendy Stirk for her help and tips in cultivation of algae and proof- reading my work, it was highly appreciated. Thanks to EM staff at the University of UKZN, especially Mrs Shirley Mackellar for her interest in my work and her technical help in TEM
XI and Confocal work. Thanks also to Mrs Tutuza Xuma for her help in EDX-EM. I want to thank my best friends Heide Bertels and Emily Guilleman for travelling across the world to see me; their continuous friendship and love, means a lot for me. Thanks to Nolwazi Nduli- Cele, Mariyana Ivanova and Suvina Sooknandan for their everlasting friendship. They are truly the sunshine of life.
Would like to thank many of my colleagues at RCPGD, some who have become my best friends- Jude, Michael, Ashwell, Rofhiwa, Viwe, Balungile and Halima for all their encouragement and help whenever needed. I want to thank in particular Dr Mack Moyo for his time reading my thesis and his constructive suggestions. Thanks to Dr Marnie Light for being a living reference library. Thanks to Mrs Judy Magnusson, Mrs Lee Warren and Mr Martin Hampton. I highly grateful for the friendship with Dr Manoj Kurlkani, Mayashree, Laxman and Mat Rohana, for feeding me, and their constant generosity. Thank to Mr Bheku Ncube for helping me with statistics. Thanks to Siyabonga Gumede for his help and friendship. A big thank you to Mr Nhlanhla Mnikathi for touching and inspiring my soul!
I would like to thank my parents from the bottom of my heart for their unconditional love and solid support, encouragement and financial support. Ngiyabonga ngiyanconcoza, nikhule nize nikhokhobe Mantshali amahle. My gratitude to my adorable siblings for their love and support- Thembelihle, Sakhile and Lindokuhle, ngiyanithanda bafowethu- abekho abahle njengani!
Lastly, I would like to thank NRF, for funding my research. I would also like to thank the Canon Collins Trust for funding my research study in the UK and sponsoring my conference expedition to France. Thanks Sarah Nicolson for all the hard work.
I dedicate this thesis to my beloved parents: Mpumelelo and Irene Mtshali. ―I am blessed to have such amazing individuals to be my parents on this planet.‖
UNkulunkulu anigcine nina boma Galela-Gasa njengengonyama!” Ngiyabonga baba nomama!
XII
TABLE OF CONTENTS
DECLARATION... II DECLARATION BY SUPERVISORS ... III DECLARATION 1: PLAGIARISM ... IV DECLARATION 2 - PUBLICATIONS ... V ABSTRACT ... VI PREFACE ... VIII INSPIRATION ... IX ACKNOWLEDGEMENT ... X TABLE OF CONTENTS ... XII LIST OF FIGURES ... XII LIST OF TABLES ... XXII LIST OF APPENDICES ... XXIV LIST OF ABBREVIATIONS ... XXV
1. LITERATURE REVIEW ... 1
1.1 INTRODUCTION AND RATIONALE FOR THE STUDY ... 1
1.2 AIM/S OF THE PRESENT STUDY ... 5
1.3 INTRODUCTION TO LICHENS ... 6
1.3.1 Reproduction in Lichens ... 9
1.3.2 Uses and application of lichens ... 10
1.3.3 Ecology of lichens ... 11
1.3.4 Using lichens to monitor pollution ... 13
1.3.5 Nutrient acquisition in fungi/lichens ... 16
1.4 ACID PHOSPHATASE ... 19
1.4.1 General characterization of acid phosphatase ... 19
1.4.2 Occurrence and cellular location ... 20
XIII
1.4.3 Properties of acid phosphatase ... 21
1.4.3.1 Physical properties ... 21
1.4.3.2 Enzymatic properties ... 26
1.4.4 Mechanism of action ... 28
1.4.5 Factors that induce the biosynthesis of acid phosphatase... 31
1.4.5.1 Regulation of apase by inorganic phosphate (Pi) concentration ... 31
1.4.5.2 The effect of pH, carbon source and culture age in the regulation of apases .. 32
1.4.6 Genetic responses to phosphorus deficiency in microorganisms ... 34
1.4.7 Function of acid phosphatases ... 36
2. PROSPECTING FOR THE ACID PHOSPHATASE GENE FROM THE MYCO- BIONT CLADONIA PORTENTOSA BY PCR ... 38
2.1 GENERAL INTRODUCTION ... 38
2.2 MATERIALS AND METHODS ... 41
2.2.1 Database search and clustering of acid phosphatases ... 41
2.2.2 Phylogenetic analyses ... 44
2.2.3 Multiple sequence alignments ... 44
2.2.4 Isolation of lichen mycobionts of Cladonia portentosa ... 45
2.2.5 Culturing of filamentous fungi using positive controls ... 46
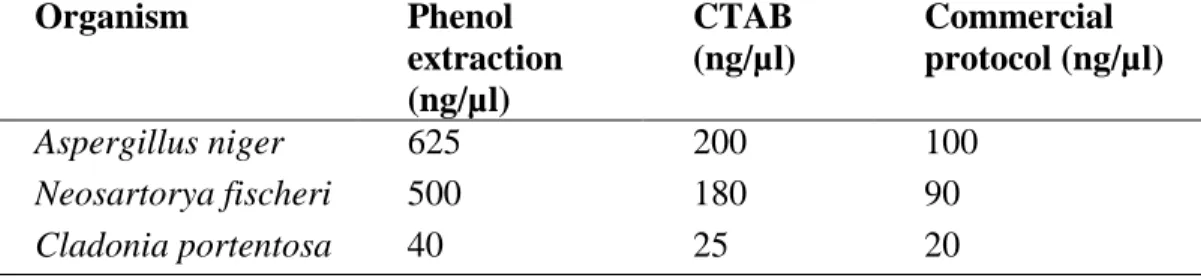
2.2.6 Genomic DNA extraction ... 46
2.2.6.1 Phenol extraction- method A ... 46
2.2.6.2 CTAB extraction-method B ... 47
2.2.6.3 Commercial Kits-method C... 48
2.2.7 Design of degenerate PCR primers ... 48
2.2.8 PCR optimization ... 49
2.3 RESULTS... 51
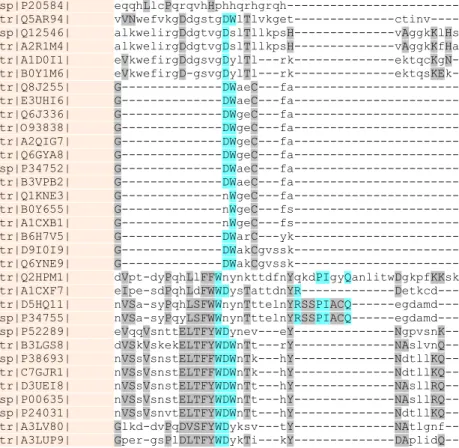
2.3.1 Conserved regions and typical motifs in the sequences of apases ... 51
2.3.2 Phylogeny relationship with similar proteins from different organisms ... 57
XIV
2.3.3 DNA extraction... 63
2.3.4 Optimization of the PCR parameters ... 66
2.4 DISCUSSION ... 71
2.4.1 Typical motifs in the sequences of apases and challenges in primer design ... 71
2.4.2 DNA extraction and PCR optimization ... 72
3. PURIFICATION AND BIOPHYSICAL CHARACTERIZATION OF SECRETED ACID PHOSPHATASE FROM THE LICHEN CLADONIA PORTENTOSA ... 75
3.1 GENERAL INTRODUCTION ... 75
3.2 OPTIMIZATION OF PROTEIN EXTRACTION ... 77
3.2.1 Introduction ... 77
3.2.2 Materials and Methods ... 79
3.2.2.1 Chemicals ... 79
3.2.2.2 Lichen collection and preparation ... 80
3.2.2.3 Acid phosphatase assay/s ... 80
3.2.2.4 Determination of protein concentration ... 82
3.2.2.5 Solubilization of proteins by biological detergents and cell wall hydrolases .. 82
3.2.2.6 Optimizing protein concentration ... 84
3.2.3 Results ... 84
3.2.3.1 Solubilizing apase by hydrolase enzymes versus biological detergents ... 84
3.2.3.2 Comparison of cell wall hydrolytic enzymes in the release of apases ... 87
3.2.3.3 Comparison of different concentration methods... 88
3.3 PARTIAL PURIFICATION OF ACID PHOSPHATASE ... 91
3.3.1 Introduction ... 91
3.3.1.1 Purification by high pressured liquid chromatography (HPLC) ... 91
3.3.1.2 Polyacrylamide gel electrophoresis ... 92
3.3.1.3 Isoelectric Focusing (IEF) ... 93
3.3.1.4 The release of oligosaccharides from glycoproteins ... 93
XV
3.3.2 Methods ... 93
3.3.2.1 Ion-exchange chromatography ... 93
3.3.2.2 Gel-filtration chromatography... 94
3.3.2.3 Electrophoretic analysis of apase enzyme ... 95
3.3.2.4 Detection of enzyme activity by non-denaturing PAGE ... 95
3.3.2.5 Estimation of molecular weight by SDS-PAGE ... 96
3.3.2.6 Estimation of Isoelectric point ... 96
3.3.2.7 Deglycosylation... 97
3.3.2.8 Enzyme thermal stability and determination of optimal pH ... 97
3.3.2.9 Enzyme modulators and inhibitors ... 98
3.3.2.10 Kinetics properties ... 98
3.3.3 Results ... 98
3.3.3.1 Chromatographic steps ... 98
3.3.3.2 Purification Scheme ... 100
3.3.3.3 Electrophoretic analysis of apase enzyme ... 101
3.3.3.4 Determining the pI of secreted apase ... 104
3.3.3.5 Effect of pH and temperature on apase activity ... 105
3.3.3.6 Effect of bivalent metal cations ... 107
3.3.3.7 The release of oligosaccharides from glycoproteins ... 108
3.3.3.8 Kinetic parameters ... 109
3.4 PROTEIN SEQUENCING BY MALDI-TOF MS/MS ... 111
3.4.1 Introduction ... 111
3.4.2 Procedure ... 111
3.4.3 Results ... 112
3.5 GENERAL DISCUSSION ... 120
3.5.1 Protein solubilization ... 120
3.5.2 Apase purification and physiochemical characterization ... 121
XVI
3.5.3 Apase stabilility and pH ... 124
3.5.4 Enzyme kinetics ... 124
3.5.5 Apase sequencing ... 126
4. CYTOCHEMICAL LOCALIZATION AND REGULATION OF ACID PHOSPHATASE BY CULTURE CONDITIONS IN MYCOBIONT CLADONIA PORTENTOSA ... 129
4.1 GENERAL INTRODUCTION ... 129
4.2 MATERIAL AND METHODS ... 132
4.2.1 Chemicals ... 132
4.2.2 Isolation of axenic photobiont and mycobionts ... 132
4.2.3 The effect of Pi on apase ... 133
4.2.4 The effect of media pH on apase biosynthesis ... 134
4.2.5 The dual effect of Pi starvation and Menadione ... 135
4.2.6 Statistically analysis ... 135
4.2.7 Cytochemical localization of acid ... 136
4.2.7.1 Fixation ... 136
4.2.7.2 Electron microscopic apase cytochemistry ... 136
4.2.7.3 ELF-97 substrate ... 137
4.2.7.4 Vector Blue III... 138
4.2.7.5 Co-staining with other fluorescent dyes ... 138
4.2.7.6 Fluorescence microscopy... 139
4.2.7.7 Localization of apase on fungal hyphae using inverted confocal microscopy 139 4.2.7.8 Detecting colocalization in dual labelling ... 140
4.3 RESULTS... 141
4.3.1 Isolation of axenic cultures ... 141
4.3.2 The effect of different Pi concentrations on apase biosynthesis ... 142
4.3.3 The effect of menadione versus Pi starvation on apase biosynthesis ... 143
4.3.4 The effect of pH on apase ... 144
XVII
4.3.5 Localization of apase using TEM/ EDX ... 144
4.3.6 Fluorescent microscopy ... 149
4.3.7 Confocal microscopy ... 154
4.4 GENERAL DISCUSSION ... 162
4.4.1 The influence of Pi on the biosynthesis of apase ... 162
4.4.2 The influence of pH on the biosynthesis of apase ... 163
4.4.3 The effect of oxidative stress on apase biosynthesis ... 164
4.4.4 Cytochemical localization of acid phosphatase using Gomori stain under TEM.. 165
4.4.5 Localization of acid phosphatase using fluorescent substrates ... 165
5. GENE EXPRESSION PROFILING DURING PHOSPHORUS STARVATION IN THE MYCOBIONT OF CLADONIA PORTENTOSA ... 174
5.1 GENERAL INTRODUCTION ... 174
5.2 MATERIALS AND METHODS ... 176
5.2.1 Chemicals and enzymes ... 176
5.2.2 Primer designing ... 176
5.2.3 Growth of C. portentosa under varying phosphate regimes ... 176
5.2.4 Extraction of total RNA and DNA from mycobiont cultures of C. portentosa... 176
5.2.4.1 Isolation of mRNA ... 177
5.2.4.2 Quality assessment of RNA ... 178
5.2.5 Amplification of RNA using aRNA kit ... 178
5.2.6 cDNA Synthesis for Cloning ... 178
5.2.6.1 First strand cDNA synthesis ... 178
5.2.6.2 Second strand synthesis ... 179
5.2.7 PCR amplification ... 179
5.2.7.1 PCR clean up ... 180
5.2.7.2 Blunt ended PCR ... 180
5.2.7.3 A-Tailing procedure ... 180
XVIII
5.2.7.4 Ligation using pGEM®T Easy vector ... 180
5.2.8 Transformations ... 181
5.2.9 Isolation of recombinant Plasmid DNA ... 181
5.2.10 DNA sequencing... 182
5.3 RESULTS... 183
5.3.1 Cloning by PCR from genomic DNA... 183
5.3.2 Extraction of total RNA from mycobiont cultures of C. portentosa ... 184
5.3.2.1 Analysis of RNA ... 184
5.3.3 Screening of transformants ... 185
5.3.4 Generation and identification of expressed cDNA fragments ... 186
5.3.5 Cloning ... 187
5.3.6 Sequencing and analysis ... 187
5.3.7 Functional categories and analysis EST clones ... 190
5.4 DISCUSSION ... 191
6. GENERAL CONCLUSIONS ... 200
REFERENCES ... 204
APPENDIX ... 255
XII
LIST OF FIGURES
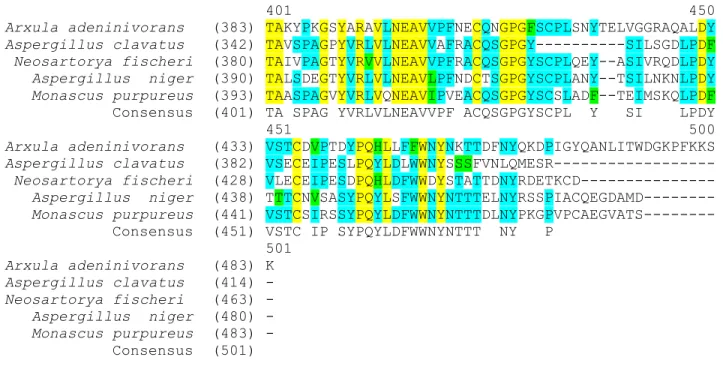
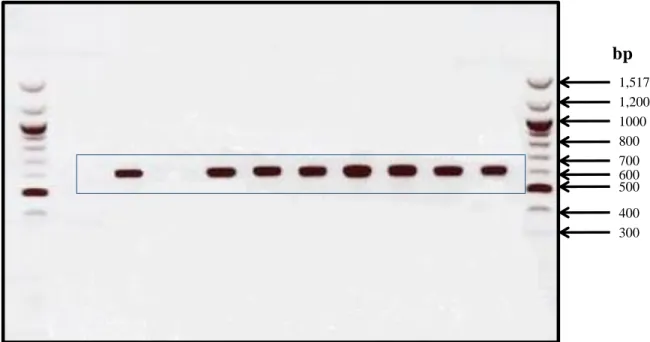
Figure 1.1: Map of distribution of Cladonia portentosa across the British Isle. ... 3 Figure 1.2: (A-C) Cladonia portentosa forms large mats (A). Portion of podetium showing brown-reddish discocarps (B). Lichen under bright field light, where the clumps of algal photobiont (Trebouxia) can be seen (C). ... 4 Figure 1.3: Kinetic mechanism of acid phosphatase ... 29 Figure 2.1: Multiple sequence alignment of 33 selected representatives of the HAP super family of fungal and yeast apases. ... 57 Figure 2.2: A phylogenic tree (N-J with branched length) demonstrate the order of evolutionary events in three groups of apases used in this study. ... 59 Figure 2.3: Multiple sequence alignment of apase genes from different fungal and yeast organisms used to design degenerate primers for Cladonia portentosa. ... 60 Figure 2.4: Extraction of genomic DNA from Cladonia portentosa using the CTAB protocol.. ... 64 Figure 2.5: (A-B) Extraction of genomic DNA from Aspergillus niger, Neosartorya fischeri and Cladonia portentosa.. ... 65
Figure 2.6: Optimizing degenerate primers using genomic DNA from Pichia pastoris.. . 66 Figure 2.7: (A-B) Typical PCR profile using low stringency parameters (temperature, primer concentration and DNA template concentration) using (A) A. niger and (B) N.
fischeri DNA template.. ... 68
Figure 2.8: (A-B) Typical PCR profile using high stringency parameters (temperature, primer concentration and DNA template concentration) using A. niger (A) and N. fischeri (B) DNA template. . ... 69 Figure 2.9: (A-C) Typical PCR profile using low stringency parameters (temperature, primer concentration, MgCl2 and DNA template concentration) using a Cladonia portentosa DNA template.. ... 70
Figure 3.1: (A-C) Comparison of different treatments for the release of acid phosphatase in Cladonia portentosa lichen.. ... 86
Figure 3.2: (A-C) Comparison of three cell wall hydrolase enzymes in releasing acid phosphatase from Cladonia portentosa lichen material.. ... 87
XX Figure 3.3: (A-D) Polypeptide profile of proteins extracted/solubilized by cell wall hydrolases and biological detergents and concentrated by various methods as mentioned in
Table 3.4.. ... 90
Figure 3.4: Anion-exchange chromatography of lichen Cladonia portentosa fraction on DEAE cellulose column (1X5cm).. ... 99
Figure 3.5: Elution profile by size exclusion gel chromatography of fractions of Cladonia portentosa.. ... 100
Figure 3.6: (A-B) Verification of purification steps by electrophoretic techniques. ... 102
Figure 3.7: (A-C) Detection of enzyme activity using Native-PAGE gel. ... 103
Figure 3.8: (A-B) Detection of enzyme subunit by SDS-PAGE. ... 104
Figure 3.9: The isoelectric point (pI) of apase estimated by native-PAGE.. ... 105
Figure 3.10: The effect of pH on the activity of acid phosphatase from Cladonia portentosa. ... 106
Figure 3.11: The effect of temperature on the activity of acid phosphatase from Cladonia portentosa. ... 106
Figure 3.12: Effect of inhibitors on acid phosphatase. pNNP was used as substrate and absorption measured 37 °C at 405 nm, expressed as relative percentage (U/ml). ... 107
Figure 3.13: Deglycosylation of apase, using N-Glycosidase F (PNGase F) on SDS-PAGE and visualized by silver staining.. ... 109
Figure 3.14: (A-B) Double reciprocal plot for determining the Vmax and KM values of acid phosphatase against phytic acid at 37 °C for 45 min. ... 110
Figure 3.15: (A-C) MALDI-TOF peptide mass fingerprinting of acid phosphatase from Cladonia portentosa. ... 114
Figure 3.16: (A-D) Multiple alignment of peptides obtained from sequencing of acid phosphatase from C. portentosa.. ... 116
Figure 4.1: (A-E) Axenic cultures of Cladonia portentosa.. ... 141
Figure 4.2: Acid phosphatase activity (units/mg protein) in the mycelia of Cladonia portentosa in a dual treatment of menadione vs. Pi-deficient or Pi-enriched medium.. ... 143
Figure 4.3: Acid phosphatase activity (units/mg protein) in mycelia of Cladonia portentosa under Pi-deficiency (Pi) and Pi-enriched (PC) medium. ... 144
Figure 4.4: (A-E) Cytochemical detection of apase in the lichen Cladonia portentosa by transmission electron microscopy (TEM).. ... 145
XXI Figure 4.5: (A-C) Ultra structural localization of apase in mycobiont of Cladonia portentosa by scanning electron microscopy with energy dispersive X-ray analysis (SEM- EDX).. ... 147 Figure 4.6: (A-C) EDX spectra of different metal elements (yellow)... 148 Figure 4.7: (A-E) Lichen thallus visualized using fluorescence microscopy. Controls were included to differentiate between natural autofluorescence (blue) and ELF-97 (green) visualized under UV light excitation.
Figure 4.8: (A-F) Axenic mycelium grown under different concentration of Pi (0.05, 1.0, 3.0, 10 and 100 mM KH2PO4) incubated with ELF-97 viewed by fluorescence microscopy..
... 151 Figure 4.9: (A-F) Axenic mycelium with under different concentration of Pi (100, 10 and 0.05 mM) incubated with ELF-97 viewed with fluorescent microscope.. ... 153 Figure 4.10: (A-E) Lichen thallus visualized using confocal microscope. The thallus was visualized without any substrate, using laser 405, to ascertain the extent of autofluorescence in the sample.. ... 155 Figure 4.11: (A-I) Mycelium stained with Vector blue III substrate (VB), viewed with a confocal microscope.. ... 156 Figure 4.12: (A-L) Confocal images of the mycelium of C. portentosa displaying the internalization of FM4-64. ... 158 Figure 4.13: (A-D) Internalization of the FM4-64 by living hyphae grown under phosphorus starvation (1.0 mM Pi). ... 159 Figure 4.14: (A-E) Interactive representation of apical branching of mycelium of C.
portentosa, showing a colocalization of VB and FM4-64 after co-labelling.. ... 160
Figure 5.1: (A-B) PCR amplification of C. portentosa apase gene using degenerate primers. ... 183 Figure 5.2: A representative of electropherograms of total RNA extracted from C.
portentosa mycobionts. ... 185
Figure 5.3: Selection using the lacZ complementation was used as a screening tool to differentiate between transformed colonies with recombinant plasmids (white) and those transformed with non-recombinant plasmids (blue). ... 186 Figure 5.4: PCR amplification using oligo-DT primers. Stronger bands were selected (b) for cloning. Several bands were present but were faint and we not selected (a). ... 187 Figure 5.5: EST generated from phosphorus-starved and menadione-stressed mycelium.189
XXII
LIST OF TABLES
Table 1.1: Physical properties of various acid phosphatases, isolated from different organisms. T= Optimal temperature. PI= isoelectric point. ... 24 Table 1.2: Amino acid sequence alignments of the conserved region where acid phosphatase from different organisms share a high degree of amino acid conservation
“RHGXRXP”. PAP= purple acid phosphatases. ... 25 Table 2.1: BLAST output obtained using the sequence of Saccharomyces cerevisiae gene PHO3, accession number CAA25557.1.. ... 42
Table 2.2: List of degenerate primers used for gene cloning of acid phosphatase ... 48 Table 2.3: Experiment design showing a typical gradient PCR experiment design using various parameters (temperature, primer concentration and DNA templates concentration).
... 50 Table 2.4: Comparison of DNA extracted from Cladonia portentosa by by commercial kits and traditional protocols. The concentration of DNA was measured using a NanoDrop ND- 1000 spectrophotometer. ... 63 Table 3.1: The following detergents were chosen for their stated properties. ... 79 Table 3.2: Cell wall hydrolase enzymes used in this study. ... 79 Table 3.3: Eluting phosphatase with detergents and hydrolase enzymes. Intact vs.
mechanical extraction. N=3. ... 83 Table 3.4: A summary of different techniques used in this study to concentrate the apase enzyme from C. portentosa. ... 88 Table 3.5: Purification of extracellular apase isolated from the thallus of Cladonia portentosa.. ... 101
Table 3.6: The effect of various compounds on acid phosphatase activity of Cladonia portentosa. ... 108
Table 3.7: Substrate specificity relative to pNNP of acid phosphatase from Cladonia portentosa. ... 110
XXIII Table 3.8: Amino acid sequences from the purified acid phosphatase from Cladonia portentosa (not shown=#, shown*). Amino acid sequences from the purified acid phosphatase from Cladonia portentosa (not shown=#, shown*). Data analysis is based from SDS-gel excised from 3 bands corresponding to 55, 60 and 148 kDa. ... 113 Table 3.9: Identified FLAETNPAPFGHG peptide 10 from MALDI-TOF MS/MS analysis were searched against the NCBI database using expasy website. The peptide was queried by blastp in the UniProt Knowledgebase (Swiss-Prot + TrEMBL). Comparison matrix was conducted by PAM30 using a gap alignment. ... 117 Table 3.10: Identified AVGLGYVEELLAR peptide from MALDI-TOF MS/MS analysis was searched against the NCBI database using the expasy website: The peptide was queried by blastp in the UniProt Knowledgebase (Swiss-Prot + TrEMBL).. ... 118 Table 3.11: The AQGLGYVQEVLAR peptide was searched using the expasy search engine to include proteins found in the UniProtKB/TrEMBL. ... 119 Table 4.1: Experimental design on dual treatments of Pi versus menadione. N=5 ... 135 Table 4.2: Apase activity from Cladonia portentosa cultured on different concentrations of Pi [0.05, 1.0, 3.0, 10 and 100 mM] at 18 °C for 4 months. ... 142 Table 4.3: Summary of analysis by EDX. ... 149 Table 5.1: Quantification of RNA isolated from +Pi sufficient vs. –Pi deficient cultures184 Table 5.2: Candidate clones from Pi starvation library from C. portentosa. Gene fragments preferentially expressed in the mycelia from of C. portentosa. After BLAST searches, the EST matched the mentioned sequences. ... 188
XXIV
LIST OF APPENDICES
Appendix A: Reagents for Protein Electrophoresis (SDS-PAGE) ... 255 Appendix B: Buffers and Staining solutions used in Microscopy work ... 257 Appendix C: Fungus culture media and solutions ... 258 Appendix D: DNA sequences ... 259
XXV
LIST OF ABBREVIATIONS
AA amino acid(s)
AAC ADP/ATP carrier
ACM Aspergillus Complete Medium
ADP Adenosine 5‟-Diphosphate
ATP Adenosine 5‟-Triphosphate
BCA Bicinchoninic acid
Bp Base pair
BSA bovine serum albumin
CHAPS 3-[(3-cholamidopropyl) dimethylammonio]-1-propane sulfonate
DCW Dry cell weight
DNA deoxyribonucleic acid
DTT dithiothreitol
EDTA Ethylenediaminetetra–acetic acid ER endoplasmic reticulum
GF Gel filtration
GPI glycosyl phosphatidylinositol-linked protein
HMW high molecular weight
IEF Isoelectric focusing
IPTG Isopropyl ß-D-thiogalactopyranoside
IUPAC-IUB International Union of Pure and Applied/ Applied Chemistry- International
Kb Kilobase (pair)
kDa kilodaltons
KM inverse of enzyme affinity (Michaelis constant) Lag longevity-assurance gene
LMW Low molecular weight
MOPS 3-(N-Morpholino) propanesulfonic acid sodium
Mr Molecular weight
ORF open reading frame
P Phosphorus
PCR Polymerase Chain Reaction
XXVI
Pi inorganic phosphate
pI isoelectric points
RPM revolutions per minute RSt Stokes radius of solute
RT Room Temperature
S. cerevisiae Saccharomyces cerevisiae SDS sodium dodecyl sulphate
SDS-PAGE Sodium Dodecyl Sulfate-Polyacryl Amide Gel Electrophoresis
SOC Super Optimium Broth
SEM standard error of the mean Taq polymerase Thermus aquaticus polymerase
TCA Trichloroacetic acid
TEMED N,N,N,N‟N‟-Tetramethylethylenediamine
Thr Threonine
UORF upstream open reading frame
V elution volume
v/v volume/volume
V0 void volume
Vc geometric column volume
Vmax maximum reaction rate
Vt total volume
w/v weight /volume
1
1. LITERATURE REVIEW
1.1 INTRODUCTION AND RATIONALE FOR THE STUDY
Lichens are particularly sensitive to anthropogenic activities which pollute the environment.
This makes them ideal biomarkers in assessing the effect of air pollution, ozone depletion, metal contamination and nutrient concentrations in the environment (FERRY et al., 1976;
HAWKSWORTH and ROSE 1976; ROSE and HAWKSWORTH, 1981; VOKOU et al., 1999). Most species live for decades thus they can provide a long term reflection of local environmental conditions such as elemental composition of plant matrices and the fluxes of elements between biota, the lithosphere and atmosphere.
In the British Isles, agriculture-based pollution includes ammonium depositions, herbicides and pesticides, has been implicated in the unprecedented decrease in grassland communities (Bryophytes, grass and lichens) over the past years (PHOENIX et al., 2003) reducing species richness (BROWN, 1992; ALSTRUP, 1992; MODENESI, 1993; DAVIES et al., 2007;
RIDDELL et al., 2008). Anthropogenic nitrogen deposition is a major threat to the long-term stability and floristic diversity of natural ecosystems such as lichen heaths (BOBBINK et al., 1998). The reason for this is that these ecosystems are adapted to nutrient-poor conditions and have extremely slow growth rates i.e. very slow vegetation dynamics and correspondingly low regeneration capacity. In the long term, this means that species with a higher demand for nutrients and a higher competitive capacity under the present eutrophic conditions may replace the original lichen heath species (LEE et al., 1992; AERTS and HEIL, 1993).
Recent studies by HOGAN et al. (2010a; 2010b) revealed that mat-forming terricolous lichens provide coherent biomarkers for N enrichment which respond to deposition in a consistent and predictable manner. Interestingly, these studies also revealed that nitrogen enrichment changes lichen N:P ratios from values of N limitation to those indicative of P limitation, thus driving the up-regulation of phosphomonoesterase (PME, i.e. phosphatase) enzymes.
2 The upregulation of phosphatase (PME) in phosphorus-deficient soils (i.e. natural and agricultural ecosystems) is a common phenomenon. Rapid adaptation of soil organisms to fluctuating nutrient supply especially P is essential for their survival, since this macroelement has profound consequences for fungal growth and physiology. To cope with low P availability, many soil microbes have evolved sophisticated metabolic and developmental strategies to enhance phosphate acquisition and remobilization. Research progress in P starvation in soil microorganisms have emerged from mycorrhizal fungi and also some general free-living fungi.
Despite a large body of data on metabolic and developmental acclimations of free-living fungi to P starvation, little is known about the underlying molecular processes and P sensory mechanisms operating in lichens. The molecular mechanisms that monitor phosphate availability and integrate the nutritional signal in lichens are essentially unknown.
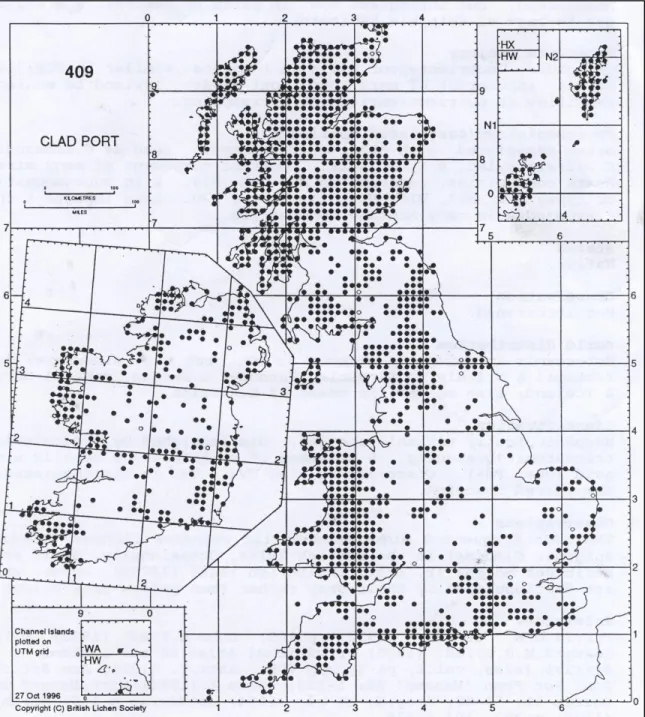
In the physiological characterization study conducted by HOGAN et al., 2010a, Cladonia portentosa was demonstrated to be an ideal model species for several reasons: (i) it has a wide distribution in Europe and constitutes the dominant vegetation of much of the arctic tundra and Calluna-dominated heathlands (including upland moorlands in the British Isles) (Figure 1.1);
(ii) Cladonia portentosa is a typical heathland species, heathland soils are poor in nutrients (such as P and N) and acidic in nature; (iii) this species is mat-forming, thus relies on atmospheric deposition for nutrients, providing a good indicator of atmospheric chemistry, and it is ecologically successful as it forms large cushions (Figure 1.2A). More importantly, PME activity measured in Cladonia portentosa was the highest reported in lichens and several fungi, thus, unusually high levels of PME found in this lichen have prompted interest to study their secreted PME. To date, no molecular characterization of PME have been reported for this lichen.
Cladonia portentosa (Dufour) Coem is a fruticose lichen, commonly known as “Reindeer Moss”, belonging to the family Cladoniaceae, a division of the Ascomycota (DOBSON, 2005).
This lichen belongs to a class of Lecanoromycetes. It is intrinsically branched, compact and interwoven, and forms large mats up to 6 cm in height (Figure 1.2A-C). The internal structure is radial with a dense outer cortex, a thin algal layer, a medulla and a more or less hollow centre or dense central cord (Figure 1.2B). Most typical fructicose lichens are anchored by basal rhizoidal
3 strands derived from the cortex although many species are without any attachment to the substrate.
Figure 1.1: Map of distribution of Cladonia portentosa across the British Isle.
4 Figure 1.2: (A-C) Cladonia portentosa forms large mats. (A) Portion of podetium showing brown- reddish discocarps (B). Lichen under bright field light, where the clumps of algal photobiont (Trebouxia) can be seen (C).
A
100 µm
B C
5 1.2 AIM/S OF THE PRESENT STUDY
The present study was aimed at molecular characterization of acid phosphatases from Cladonia portentosa. To date, there has been no molecular characterization of acid phosphatase from lichens reported in the literature. Specific aims of the study were:- Cloning the acid phosphatase gene by PCR;
I. Purifying the acid phosphatase protein, and to study its biophysical characteristic properties;
II. Cytochemical localization of secreted acid phosphates in the mycelium of Cladonia portentosa; and
III. Assessing the influence of inorganic phosphorus (Pi) on acid phosphatase biosynthesis under limiting and sufficient conditions.
6 1.3 INTRODUCTION TO LICHENS
Lichens exist as discrete thalli and are implicitly treated as individuals in many studies, even though they may be a symbiotic entity involving two or three Kingdoms. The partnership may be between heterotrophic fungi (mycobionts) and photosynthetic prokaryotic cyanobacteria (phycobiont) or eukaryotic (algae) organisms (photobionts).
They are important constituents of many vegetative ecosystems in the world, from the tropics to polar regions (HALE, 1983; NASH, 1996). Approximately 8% of terrestrial ecosystems are lichen-dominated and include around 17 000 species (HALE, 1983;
NASH, 1996). They occur in some of the most extreme environments on earth such as arctic tundra, hot deserts, rocky coasts and toxic slag heaps, deep sea, wood and sediments (KOHLMEYER and KOHLMEYER, 1977; RAGHUKUMAR et al., 2004;
SELBMANN et al., 2005). In addition to their presence in most natural, industrial and agricultural settings, they can also be found as epiphytes on leaves and branches in rain forests and mesic habitats (KOHLMEYER and KOHLMEYER, 1977;
RAGHUKUMAR et al., 2004; SELBMANN et al., 2005).
A lichen comprises of a „vegetative plant-like body‟ thallus which is remarkably complex, having little resemblance externally to either non-lichenized fungi or algae (HALE, 1974). The basic building blocks of fungi are elongated cellular threads called hyphae.
Masses of hyphae form a vegetative thallus or mycelium, which is usually inconspicuous in non-lichenized fungi but often quite elaborate and durable in lichens. The lichen thallus is a relatively stable and well-balanced symbiotic system with both heterotrophic and autotrophic components, making these organisms classic examples of symbiosis (NASH, 2008). Even though lichens are an association of different organisms, they are named after the fungal partner, which dominate the symbiosis in most cases (VERMA et al., 2008).
Lichens can be considered as ecosystems where the interaction of partners results in behaviour and life forms that are not found in the isolated partners (NASH, 1996;
KRANNER et al., 2005; VRÁBLÍKOVÁ et al., 2006; OKSANEN, 2006). The spectrum of interaction, remain an enigma to biology, which range from mutualism,
7 through commensalism to situations where the associates are doomed by antagonistic activities of an invading fungus (RICHARDSON, 1999).
The discovery of nitrogen fixation by various lichens has given birth to the concepts of parasymbiosis. Parasymbiosis is where parasymbionts such as Discomycete or Pyrenomycete fungi infest lichen thalli (HALE, 1974). Parasymbionts derive nutrients from the algae and maintain a balanced state of symbiosis within them and with the composite thallus. These parasitic symbiotic fungi may cause extensive damage, resulting in localized necrotic patches or in the complete death of the thallus (RAMBOLD and TRIEBEL, 1992; NASH, 2008). Alternatively, these secondary fungi do not appear to cause damage but they are assumed not to benefit their hosts either. However, their competitive presence often makes it difficult to isolate the mycobiont (CRITTENDEN et al., 1994).
Lichens are an ancient group of fungi (TEHLER et al., 2003) and 98% of them belong to the Ascomycota phylum. This is the largest phylum of fungi (~64 000 known species) and one of the most diverse and ubiquitous phyla of eukaryotes (KIRK et al., 2001; 2008).
They function in the decay of organic substrates and act as mutualists, parasites and pathogens of animals, plants and other fungi since they occur in numerous ecological niches and virtually all terrestrial and aquatic ecosystems. More than 40% of all named Ascomycota are lichenized, covering approximately 8% of the Earth‟s landmasses (BRODO et al., 2001). A small percentage of lichens belong to the Basidiomycota and Deuteromycota (known as Fungi imperfecti or mitosporic fungi) (HAWKSWORTH et al., 1995; TEHLER, 1996). The latter group is an artificial class, in which sterile species are placed.
Approximately 40 genera of algae and cyanobacteria have been reported as photobionts in lichens (TSCHERMAK-WOESS, 1988; BÜDEL, 1992). It is estimated that about 85%
of lichen-forming fungi are symbiotic with green algae of which about 1500 species are known (TSCHERMAK-WOESS, 1988; BÜDEL, 1992; HONEGGER, 1996). In comparison, approximate 10% are symbionts with cyanobacteria (blue green algae)
8 (HONEGGER, 1996). Whereas ~3-4% are cephalodiate species which associate simultaneously with green algae and cyanobacteria (TSCHERMAK-WOESS, 1988;
HAWKSWORTH et al., 1995; HONEGGER, 1996).
The most frequent photobionts belong to three genera, Trebouxia, Trentepohlia and Nostoc (FRIEDL and BÜDEL, 2008). The two genera Treboxia and Trentepohlia are of eukaryotic nature, thus referred to as photobionts and belong to the green algae.
Conversely, the genus Nostoc belongs to oxygenic photosynthetic bacteria thus is refered to as phycobionts or cyanobionts. The photobionts belongs to the green algae (phylum Chlorophyta) (BOLD and WYNNE, 1985; VAN DEN HOEK et al., 1993). Tripartite lichen thalli consist of lichen fungi and green alga (Chlorophyta, LEWIS and MCCOURT, 2004) while the cyanobacteria are spatially separated from algae in internally or externally occurring fungal compartments called cephalodia (BÜDEL and SCHEIDEGGER, 1996).
At different stages, some mycobionts can change their photosynthesizing partner from green algae to cyanobacteria and vice versa, resulting in a change of thallus morphology (OKSANEN, 2006). This behaviour was suggested to be due to an environmental adaptation and related to ecological compatibility of the photobiont (HONEGGER, 1996;
STENROOS et al., 2003). Naturally, isolated mycobionts grow so slowly that they are unlikely to survive well in the free-living state due to competition with other fungi or consumption by other organisms. Thus, most mycobionts are assumed to have an obligate relationship to lichenization, although the specificity of the mycobiont for a particular photobiont may not be as great as one might assume (BECK et al., 1998; RAMBOLD et al., 1998, NASH, 2008).
Numerous studies have revealed that both bionts appear in nature among a mixture of millions of non-symbiotic microorganisms, and many mechanisms of compatibility combination are required (GALUN and KARDISH, 1995; LEGAZ et al., 2004). Thus, specificity is required for the lichen association (LEGAZ et al., 2004). In this context, specificity can be defined as „preferential, but not exclusive, association of one biont with
9 another‟ (BUBRICK, 1988). This is illustrated by Cladonia cristitella, which produce squamules with different species of Trebouxia, displaying a selective behaviour (AHMADJIAN and JACOBS, 1981). However, the mycobiont of C. cristatella cannot form squamules with green algae other than Trebouxia, showing high specificity (AHMADJIAN, 1993). Furthermore, culture experiments by SCHAPER and OTT (2003) on selectivity of the mycobiont of Fulgensia bracteata towards potential photobionts provide evidence for fungal selectivity and varying compatibility of the respective symbionts, which can be interpreted as a cascade of interdependent processes of specific and non-specific reactions of symbionts involved.
Elaborative work by AHMADJIAN (1993), demonstrated that specificity needs mechanism of recognition to be finely tuned. When the algal cells multiply inside a growing thallus, daughter cells are enveloped by fungal hyphae which recognize new cells as compatible. Thus, recognition mechanisms are paramount not only for de novo formation of new associations but also for the maintenance of the symbiotic equilibrium in lichen symbiosis (AHMADJIAN, 1993). For such a relationship to function, cell surface recognition factors have been proposed which include phytohaemagglutinins, algal binding protein (ABP), legands and cell enzymes such as arginases (AHMADJIAN et al., 1978; BUBRICK et al., 1984; LEGAZ et al., 2004).
1.3.1 Reproduction in Lichens
The upper surface of many lichens bears fruiting bodies know as apothecium (Figure 1.1B), which can forcibly discharge tiny spores to a height of a few millimeters where they have a good chance of becoming airborne. Their survival and germination depends on the spore landing on a suitable photobiont partner before they can form new lichens (BÜDEL and SCHEIDEGGER, 1996). Thus, many lichens increase their chance of successful reproduction by producing vegetative propagules such as isidia and soredia, which contain both a fungal and photosynthetic partner which becomes detached and grow into a new thallus (OTT, 1987a; 1987 b; BÜDEL and SCHEIDEGGER, 1996). Soredia typically consist of photobiont cells enclosed in a loose network of hyphae; these
10 structures can develop diffusely over the surface of the thallus or in specialized areas called soralia (SEYMOUR et al., 2005). Isidia are small, smooth, cylindrical peg-like structures that project outwards from the outer cortex of the thallus (SEYMOUR et al., 2005). Soredia and isidia can be dispersed by wind, rain or small animals (BÜDEL and SCHEIDEGGER, 1996). Lichens can also multiply by thallus fragmentation (HONEGGER et al., 1996).
Non-lichenized and lichen-forming Ascomycetes are neither female nor male. Each haploid mycelium is theoretically capable of differentiating both gametangia (ascogonia) and gametes (microconidia=spermatia). Their sexual reproduction is regulated by mating type (MAT) genes (DEBUCHY and TURGEON, 2006; TURGEON and YODER, 2000). In contrast, Basidiomycetestes have severals MAT loci and thus very complex mating systems. Filamentous Ascomycetes have one MAT locus, which is completely different in haploid mycelia carrying one out of the two MAT alleles of the same heterothallic cross-fertilised species. These are referred to as MAT1-1 and MAT1-2 (TURGEON and YODER, 2000).
The majority of lichen forming Ascomycete and their photobionts can be cultured in single cultures and the lichen can be resynthesized from these (MURTAGH et al., 1999;
BRUNAUER and STOCKER-WÖRGÖTTER, 2005). However, cultures in the aposymbiotic state have failed to differentiate sexual reproductive stages under these conditions, thus classical genetic crossing experiments cannot be conducted. Another set- back is that lichen mycobionts grow extremely slowly compared to their photobiont partner (FRIEDL and BÜDEL, 1996). Improvements in nutrient media have resulted in faster growing rates but still unmatchable to their non-lichenized fungal counterparts (STOCKER-WÖRGÖTTER, 2005).
1.3.2 Uses and application of lichens
Throughout the centuries lichens have been used for various purposes such as food, dyes and as medicinal remedies. Due to their bitter taste, lichens have not been used as sources of food by humans to a great extent, although there are several cases where they are used
11 in various cultures (e.g. Japan) as delicacies. Lichens are, however, a source of food for animals in the arctic regions such as deer and caribou, who supplement their normal diet with lichens such as Cladonia and Cetrarias during the winter (HALE, 1974). Sheep in the Libyan desserts are reported to graze on the subfoliose lichen Lecanora esculanta. A number of invertebrates secrete lichenases (break down lichen material to glucose) thus they can utilize lichen as a food source (HALE, 1974).
Lichens have been used for medical purposes since the middle ages. The use of lichens in folklore medicine has been world-wide: (India, China, Japan, Europe and America) (HALE, 1974). Modern studies have shown that a number of lichens contain active compounds such as usnic acid from Cladonia species. Lichens were used extensively as a source of dyes before the discovery of coal-tar dyes. Species such as Rocella, Parmelia and Evernia have been extensively used for this purpose.
1.3.3 Ecology of lichens
Lichens display a variety of morphologies, with three major forms: crustose (crust-like biofilm), foliose (leaf-like) and fruticose (branched tree-like, shrubby, pendulous) types (HAWKSWORTH et al., 1995; BÜDEL and SCHEIDEGGER 1996; OKSANEN, 2006). Foliose lichens are characterized by a more or less flattened thallus with easily distinguishable upper and lower surfaces and are attached to the substrate either directly by the hyphae of the lower cortex or medulla (THORMANN, 2006). In comparison, fructicose lichens grow erect or are pendant and without distinguishable upper and lower surfaces on their thalli. These lichens are attached to the substrate at one or very few points. Crustose lichens form crusts over their substrates. Their lower surfaces grow on and among the particles that constitute the substrates; hence they cannot be removed from the substrates in one piece (BRODO et al., 2001).
Lichens possess a number of morphological and chemical adaptations enabling them to survive stressful conditions (hot deserts, artic tundras, heaths, and tree canopies) and to quickly restore their metabolic activity (ARKIN et al., 2000; BECKETT et al., 2003).
12 They are prominent members of poikilohydric organisms, whose water status varies passively with surrounding environmental conditions (NASH, 1996). They are able to exist in an extreme dry state with very low levels of metabolic activity (SUNDBERG et al., 1997), but can rapidly resume normal physiological activities upon rehydration. It was shown that water loss from lichen thalli is accompanied by almost total inactivation of photosynthetic gas exchange and loss of variable chlorophyll fluorescence (SCHROETER et al., 1991) whereas re-wetting of the thalli with liquid water normally restores photosynthetic activity within minutes (WEISSMAN et al., 2005). Metabolic activities, mainly respiration and photosynthesis frequently result in the production of reactive oxygen species (ROS) (FRIDOVICH, 1999; KOHEN and NYSKA, 2002).
These are enhanced during stress such as nutrition limitation, exposure to xenobiotics or desiccation and/ or rehydration.
Lichenization is a strategy for the mycobiont (heterotrophic organism) to acquire fixed carbon from the alga. In addition, the presence of a photosynthesizing partner allows the lichen to inhabit substrates that are virtually devoid of organic matter. These organisms can efficiently extract nutrients (phosphorus, magnesium, calcium, potassium, sulphur and iron) from recalcitrant surfaces (RICHARDSON, 1975). Rhizinae on the lichen thalli may have a function in the uptake of nutrients. The alliance between these organisms (fungi and algae/cyanobacteria) enables them to live together in inhospitable areas (oligotrophic habitats and severe climatic zones), where they could not do so independently irrespective of habitat extremity, such as light, dryness and temperatures which are less favourable for higher plants (KERSHWA, 1985; VRÁBLÍKOVÁ et al., 2006; ZAVARZINA and ZAVARZIN, 2006). In addition, both mycobiont and algal photobiont may participate in seasonal photoacclimation in green algal lichens (VRÁBLÍKOVÁ et al., 2006). The light and desiccation is greater in lichen symbiosis than in its isolated partners (KRANNER et al., 2005; VRÁBLÍKOVÁ et al., 2006).
Lichens adapted to open habitats tolerate extreme desiccation and UV exposure via their screening cortical pigment by preventing the formation of scavenging free radicals (NYBAKKEN et al., 2004; GAUSLAA, 2005; VRÁBLÍKOVÁ et al., 2006).
13 The existence of the lichens in these oligotrophic habitats and severe climatic zones contribute substantially to biomass and support a high biodiversity of micro-and macro organisms, creating complex food webs and adding significantly to energy flow (SEAWARD, 2004). In addition, lichen associations, especially the phycolichens play an important role in soil fertility and ecological energetic due to their N-fixing abilities. The disappearance of lichens, due to many aspects of human interference in the natural world, has therefore led inexorably to environmental impoverishment. Lichens are natural sensors of our changing environment. Lichens are therefore used increasingly in evaluating threatened habitats, in environmental impact assessments, and in monitoring environmental perturbations, particularly those resulting from a disturbingly large and growing number of chemical pollutants.
1.3.4 Using lichens to monitor pollution
Lichens are particularly sensitive to anthropogenic activities which pollute the environment making them ideal biomarkers in assessing the effect of air pollution (chemical deposits), ozone depletion, metal contamination and nutrient concentration in the environment (FERRY et al., 1976; HAWKSWORTH and ROSE, 1976; ROSE and HAWKSWORTH, 1981; VOKOU et al., 1999). Lichens have no vascular system for conducting water or nutrients; thus they depend on atmospheric sources (e.g. fog and dew). However, major water resources for lichens often have much higher pollutant concentrations than precipitation. The lichens nutrient concentration mechanism also will concentrate pollutants (NASH, 2008). Unlike many vascular plants, lichens have no deciduous parts, and hence cannot avoid pollutant exposure by shedding such parts.
Furthermore, the lack of stomata and cuticle in lichens means aerosols may be absorbed over the entire thallus surface, thus lichens have little biological control over gas exchange, and air pollutant gases are assumed to readily diffuse down the photobiont layer (NASH, 2008). Although dehydration allows lichens to survive dry periods, it also concentrates solutions to the point that toxic concentrations may occur. Finally alteration of the symbiotic balance between the photobiont and mycobiont may readily lead to a breakdown of the lichen association (FEIGE and JENSEN, 1992; NASH, 2008).
14 Most lichen species live for decades or hundreds of years and a few even longer: thus as perennials they are subject to the cumulative effects of pollutants. Lichens can provide a long term reflection of local environmental conditions such as elemental composition of plant matrices and the fluxes of elements between biota, lithosphere and atmosphere. In general the elemental composition of plants reflects the chemical composition of their growth media such as soil, air and nutrient solutions (FARAGO, 1994). This was demonstrated in the study by DILLMAN (1992) where he reported a significant accumulation of elements such as Cu, Ca, Mg and K in lichens as a function of distance and direction from the refineries nearby.
Classic studies on lichens show that (sulphur dioxide) SO2 pollution resulted in the decline of many lichens especially around big cities such as London. Improvement of air quality and reinforcement of the clean air legislation in many European countries (e.g. 1956, 1968; clean air acts in UK) has resulted in dramatic reduction in pollution especially SO2
levels. This improvement was evident by the recovery of the lichen flora in the 1980‟s (VAN DOBBEN and DE BAKKER, 1996).
In recent years, agriculture-based pollution which includes ammonium depositions, herbicides and pesticides have been shown to have had a negative effect on lichen species richness (BROWN, 1992; ALSTRUP, 1992; MODENESI, 1993). The major sources of deposited atmospheric N are ammonia (NH3) and nitrogen oxides (NO and NO2) on a global scale, especially in Europe. Emission of reduced N, mainly resulting from livestock management and fertilizer application exceeds those of oxidised N (PITCAIRN et al., 2003). Acid and oxidising forms of N are broadly toxic and tend to reduce species richness (DAVIES et al., 2007). The supply of reactive nitrogen to global terrestrial systems has doubled and when released on land, they result in eutrophication of both fresh water and ground water, while emission to the atmosphere results in regional eutrophication and acidification, crop damage and impact on human health (GALLOWAY, 1998; ERISMAN et al., 2003).