Bayesian network analyzes of nucleoside reverse transcriptase inhibitor-associated mutations in the RNase H region in HIV-1 subtype C-infected individuals. Frequency of resistance-associated mutations in the RNase H domain in isolates harboring none of the classic NRTI mutations.
Introduction
Introduction
- Hypothesis
- Project aims
- Specific objectives
We hypothesize that mutations in the RNase H domain are associated with resistance to the NRTIs. To determine whether the presence of mutations in the RNase H domain correlates with the appearance of NRTI-associated mutations.
Review of Literature
Human Immunodeficiency Virus
- HIV-1 Life Cycle
- Classification of HIV-1 Strains
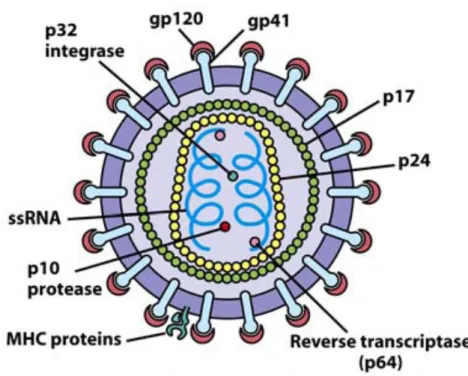
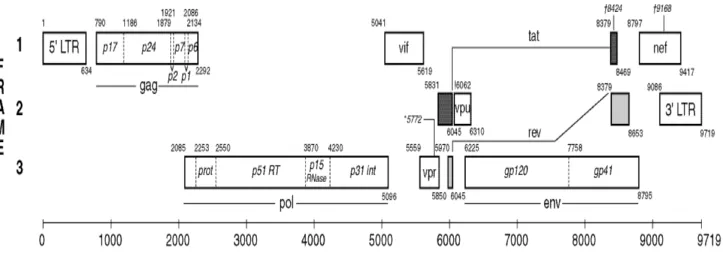
The gag gene encodes structural proteins of the conical capsid that can be cleaved by the viral protease into nucleocapsid (p6 and p7), matrix (p17) and the capsid (p24) (Gibbs et al., 1995; Vingerhoets et al. , 2009 ). Proteins assemble at the surface and form infectious virions (Gelderblom et al., 1997; Pollard et al., 1998).
The Structure and Function of RT
- The Polymerase Domain
- RNase H Domain
- RNase H Primer Grip Motif
- C-helix and Loop
- Connection domain
- Enzyme activity
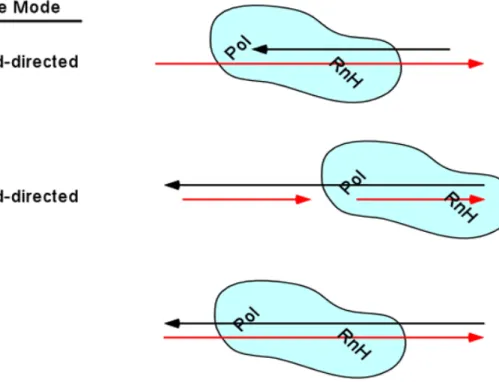
- Use of different binding modes in reverse transcription
- Cleavage specificity of RNase H
- RNase H and Antiretroviral Therapy
- Drug Resistance Testing
- Bayesian Network
- Polymerase Chain Reaction (PCR)
- DNA Sequencing
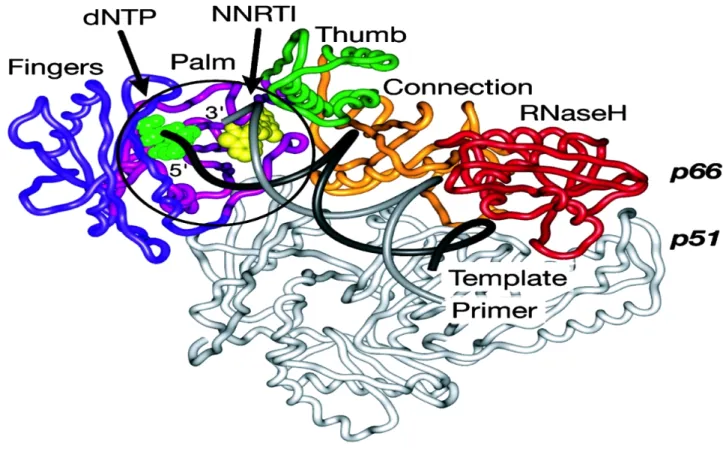
11 from the extensive p66 (66 kDa) subunit by protease-catalyzed cleavages at the p51 RNase H cleavage site, resulting in the removal of a 15 kDa RNase H domain (Figure 6) (Telesnitsky et al., 1993). The RNA template and DNA primer strands are shown in black and gray, respectively (Sarafinos et al., 2001). Chemical structure methylphosphonate Rp and Sp stereoisomers, where a methyl group replaces oxygen in the phosphate (Sarafianos et al., 2001).
Degradation of the tRNAlys3 requires RNase H cleavage to occur at specific sequences shown in Figure 11 (Schultz et al., 2009). For example, Julias et al., 2004 showed that mutations in the PPT reduce viral replication and disrupt PPT catalysis by RNase H cleavages. Reverse-transcriptase inhibitors (RTIs) are antiretroviral drugs used to inhibit reverse transcriptase's enzymatic role and stop synthesis of the double-stranded viral DNA (Shafer et al., 2002).
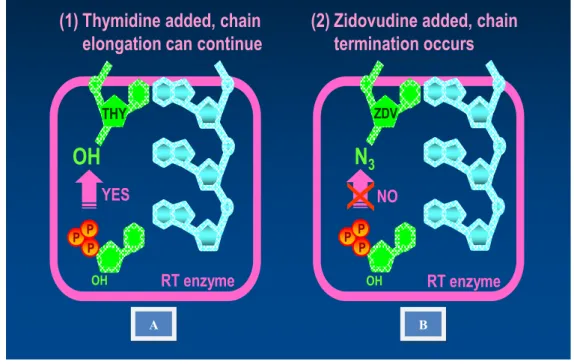
These RT inhibitors are dideoxynucleoside or nucleotide triphosphates (ddNTPs) that lack a hydroxyl group (-OH) on the 3'-C as well as the 2-primed carbon (2'-C) of the deoxyribose sugar (Figure 13) ( Goldschmidt et al., 2004). During this process, they also unblock the primer, stimulating further elongation of viral DNA (Whitcomb et al., 2003). Such changes to the structure can lead to delayed RNase H cleavage, resulting in impaired polymerization (Schultz et al., 2008).
A Bayesian network (BN) is a graphical model that describes the statistical correlation between multiple variables that apply in a domain (Pearl et al., 1998). 40 Optimized cycling parameters (denaturation, annealing and extension temperatures) also play a key role in the PCR reaction (Figure 18) (Rychlik et al., 1990).
Research Design and Methodology
Study Design
- Study Population
- Inclusion Criterion
- Exclusion Criterion
- Sample Collection
Plasma samples were studied retrospectively from HIV-1-infected adults (104) and children (30) who had already been genotyped for drug resistance. Samples were identified by their study number with no link to original patient ID numbers. Samples were obtained from the South African Resistance Cohort Study (SARCS) at McCord Hospital and the Tropism Pediatric study at King Edward VIII Hospital.
Previously genotyped patients failing their first- or second-line regimen at South African National presentation.
Methods
- RNA extraction
- Amplification and Sequencing of the RNase H region
- HIV-1 Reverse Transcription
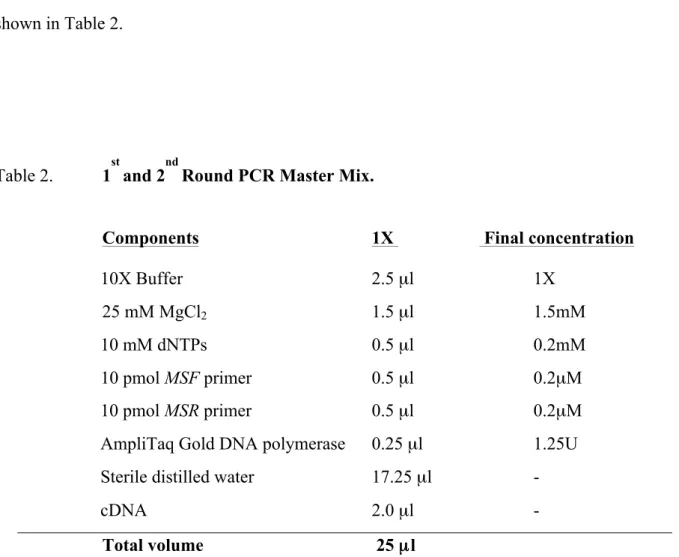
- PCR Amplification
- PCR Purification
- Sequencing of the RNase H region
- a The Plate Clean Up
- b The Tube Clean Up
- c Preparing Sequencing Products
- Sequence Data Analysis
- Statistical and Bioinformatics Analysis
- Graphpad Prism®
- B-Right
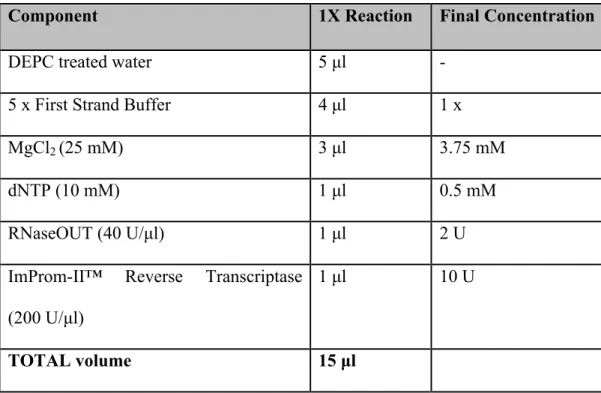
Two microliters of random hexamers (0.1 µg) were added to each reaction tube followed by the addition of 3 µl of RNA templates. After incubation, 15 µl of enzyme mixture was added immediately, followed by incubation at 50°C for 60 min and 70°C for 17 min and kept at 4°C. Product size was determined using the GeneRuler™ 1kb DNA Ladder (Fermentas International Inc).
The ExoSAP-IT® PCR cleanup was performed as follows: 5 µl of the PCR product was mixed with 2 µl of ExoSAP-IT® to remove free excess primers and nucleotides. The DNA was eluted by adding 50 µl of DNase-free water to the center of the column and incubated for 1 min before being centrifuged at 16,000 x g for 1 min. The concentration of the PCR product was determined by comparing the intensity of the amplicon band with a band of known concentration from the DNA Low Mass ladder (Invitrogen®) (Figure 20).
The tubes were then placed with the orientation mark facing the outer edge of the rotor and centrifuged at maximum speed for 20 minutes. The sequencing products were reconstituted by adding 10 µl of Hi-Di-formamide to the dried pellets in each well and pipetting up and down 10 times; the plate was then sealed with an adhesive cover and rapidly centrifuged at 1000 x g to collect the sequencing products at the bottom of the wells. The plate was centrifuged briefly at 1000 x g to collect the sequencing products at the bottom of the wells.
Results
Optimization of PCR of the RNase H region
A Bayesian graphical modeling program, B-Right (http://www.mybiodata.eu/B-Right-0.1.zip), was used to explore the data for multivariate probabilistic independence. The program was used to model the association between RNase H domain mutations and selected key NRTI resistance mutations during antiretroviral therapy. Bayesian network learning of HIV-1 sequence data was also used to analyze direct and indirect correlations between RNase H domain mutations and NRTI treatment exposure.
The Bayesian Network for this study was done in collaboration with Kristof Theys ([email protected]) of the Rega Institute for Medical Research, Katholieke Universiteit Leuven, Leuven, Belgium.
Characterization of the RNase H Domain
- Phylogenetic Analysis
- Amino acid sequence variation in the RNase H in subtype C
- Comparison of RNase H mutations between Subtype B and C isolates in treatment
- Comparison of the RNase H sequence variability between
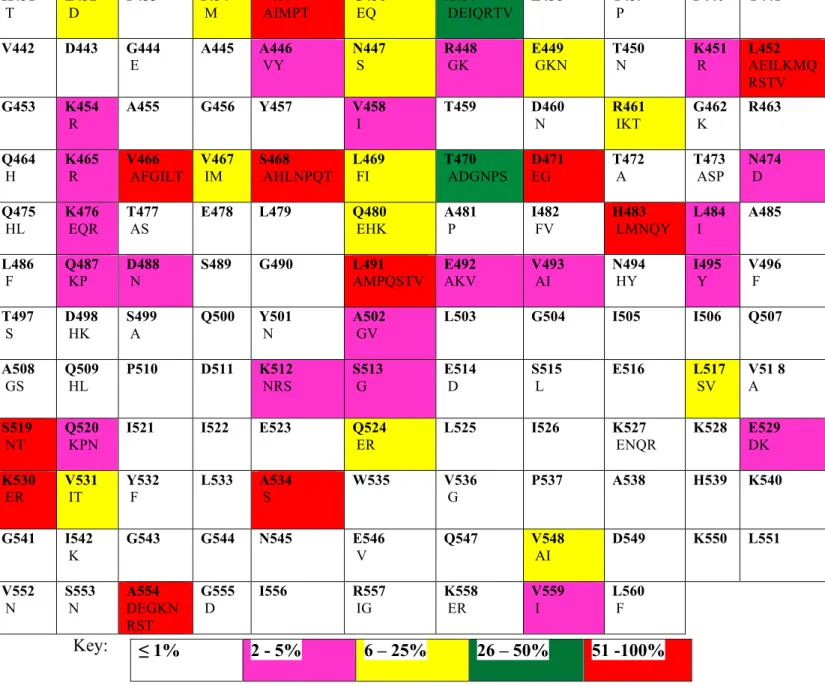
Amino acids (from amino acid 440 to 560) for each subtype C sequence were evaluated by their degree of codon polymorphisms and compared to the HXB2 reference strain to identify naturally occurring mutations in the RNase H region. Chi-square (and Fisher's exact) test was used to calculate the frequencies of the RNase H mutations in both the ART-naïve and NRTI treated isolates. Five mutations in the RNase H region had significantly higher frequency when comparing ART-naïve and NRTI-experienced patients.
Similarly, the frequency of the Q507HK mutation was significantly lower in treatment-experienced isolates (0%) compared to treatment-naïve subtype C isolates (4.48%) (p = 0.0295), and the proportion of A446SVY was reduced in previously treated isolates (0%) compared to previously untreated isolates (5.22%) (p = 0.0144). RNase H mutations (H539N and D549N), which have been found to confer NRTI resistance by a mechanism that allows more time for NRTI cleavage in subtype B, were never found among the NRTI-treated subtype C sequences studied. Mutations L469, L491, and Q509, also associated with TAM, were largely polymorphic in both pretreated and treated subjects.
In subtype C, twenty treatment-experienced samples had mutations in the RNase H domain but none of the classical NRTI mutations (Table 5). Twelve amino acid substitutions were identified in the consensus sequences in both KZN-naïve and KZN-treated patients with subtype C compared to the HXB2 reference strain (Figure 25). The RNase H domain consensus sequences of the KZN isolates differed from the HXB2 or subtype B consensus by 9% and 7%, respectively.
Bayesian Network Analysis
- Dataset for Bayesian Network Learning
- Treatment Experienced Bayesian Network Learning
Alignment of the consensus sequences of the HIV-1 group M subtypes with the HXB2 and KZN consensus sequences. The Bayesian network learning showed 15 variables with frequencies above 15% in treatment-experienced isolates: 13 were polymorphic sites and 2 were at sites associated with NRTI resistance. Annotated NRTI experience Bayesian network (BN) expressing direct association between the NRTI-associated mutations in the RNase H domain and NRTI treatment.
An arc forms a direct dependence between the similar variables and robustness is relative to bootstrap value. Arc color shows protagonist direct influence between NRTI-associated mutations (black), gray shows an influence of background polymorphisms on NRTI-associated mutations (blue) and green shows an association between background polymorphisms. Mutation T470S (p= 0.007) was not dependent on any other mutations in the network, while E529D appeared to be associated with drug resistance in combination with V531I (Figure 26).
The L491P mutation was associated with NRTI resistance in combination with thymidine analog (RT67, RT70, and RT219) mutation pathway 2 (TAM pathway 2), but had low bootstrap support. However, none of these statistically significant mutations (E438GKR, L517ISV, K527GENQR and Q547HKR) identified in this study were associated with treatment in BN.
Discussion and Conclusion
Position 438 is near the RNase H domain site that overlaps the protease cleavage site. The second mutated amino acid E432D is found five amino acids away from the RNase H site, overlapping the protease cleavage site. Very few data exist on genetic diversity of the RNase H domain between subtype C and subtype B NRTI drug resistance expression.
Using the Bayesian network to analyze direct associations between mutations and exposure to NRTI treatment sequences in the RNase H domain sequences, two resistance mutations were identified. The analysis of the BN data suggests that NRTI drug resistance could be caused by mutations (T470S and E529D) in the RNase H domain outside the catalytic and primer binding motifs. As these mutations were not strongly associated with thymidine analogue mutations, it is possible that an alternative pathway for NRTI resistance exists in the RNase H domain.
In conclusion, results obtained from this study suggested that drug resistance could be caused by mutations in the RNase H domain either alone or in combination with mutations in the pol region. In addition, protein sequences of the RNase H domain in subtypes B and C remained conserved in their functionally important primer grips and catalytic sites. Therefore, further studies using site-directed mutagenesis need to be performed to determine whether the RNase H mutations (E438GKR, T470S, L517ISV, K527GENQR, E529DK, and Q547HKR) affect viral fitness.
Effects of mutations in the polymerase domain on polymerase, RNase H, and strand transfer activities of human immunodeficiency virus type 1 reverse transcriptase. Human immunodeficiency virus type 1 reverse transcriptase: spatial and temporal relationship between polymerase and RNase H activities. 2000. M184V mutation in reverse transcriptase. of human immunodeficiency virus type 1 interferes with the rescue of strand-broken DNA synthesis.
Primer processing for plus-strand DNA synthesis by human immunodeficiency virus reverse transcriptase 1. The crystal structure of human immunodeficiency virus type 1 reverse transcriptase in complex with double-stranded DNA at 3.0 Ǻ resolution shows bent DNA. Incomplete removal of the RNA primer for minus-strand DNA synthesis by human immunodeficiency virus type 1 reverse transcriptase.
The sequence is important for plus-strand priming of human immunodeficiency virus type 1 reverse transcriptase. Contribution of DNA polymerase subdomains to the RNase H activity of human immunodeficiency virus type 1 reverse transcriptase. Specificity of human immunodeficiency virus-1 reverse transcriptase-associated ribonuclease H in removing the minus-strand primer, tRNA(Lys3).
Appendices
Preparation of Reagents
Sequence Identities