PLAGIARISM
PUBLICATIONS
Background
Within certain industries and industrial operations, pressure vessels are a critical component of the plant equipment and operations. Pressure vessels commonly used in industry include boilers, reactors, condensers, columns, heat exchangers, pressure tanks, drums, towers and air coolers.

Nozzle-shell welded joints
The rate of failure in pressure vessels
Examples of major pressure vessel failures reported over the years are shown in Table 1.1.
The arc welding process
Arguably, the greatest danger associated with pressure vessels is the potential serious injury or loss of life that can occur if the vessel fails.
Welding-induced residual stress
As the weld pool moves in the y direction, the cooling process causes shrinkage, which "stretches" the weld. Therefore, the weld is under tensile stress in the longitudinal direction (ie parallel to the weld line).
Objectives of the thesis
Scope of the thesis
Structure of the thesis
These results are then discussed in the context of the study objectives and research questions.
Introduction
Experimental methods
- Pressure vessel design codes
- Application of infrared thermography in arc welding
- Residual stress measurement by neutron diffraction
- Residual stress and fatigue strength of welded structures
- Fatigue categorisation
- Fatigue assessment techniques
- S-N curve approach
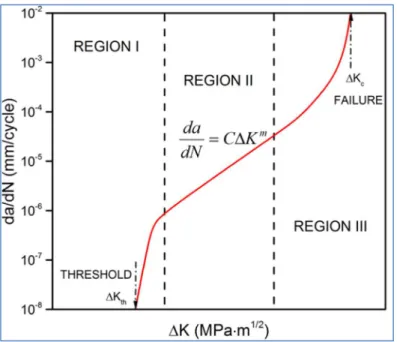
- Fracture mechanics approach
- Factors affecting fatigue strength
- The Effect of WRS
The Notch SIF approach implies that "the fatigue strength assessment of welded joints that fail at the weld root or weld toe is essentially a notch effect problem". Lu (2002) investigated the extent of the influence of WRS on the fatigue life of welded components.

Numerical methods
- Numerical analysis approaches
- Definitions used in numerical analysis
- The thermo-mechanical problem
- Effect of phase transformation on WRS
Pilipenko (2001) observed that microstructural transformation at low temperatures (i.e., martensitic) in the fusion zone and the HAZ can significantly change the residual stress distribution. The effect leads to a change in both the magnitude and the direction of residual stress in the weld.

Optimisation techniques
- Design of experiment and statistical methods
- Global search and optimisation techniques
- The nature of the problem
- Non-conventional optimisation methods
- Evolutionary algorithms
- Popular MOEAs
- Solving MOPs
Purohit and Digamber (2012) investigated the effect of voltage, wire feed speed, feed speed and nozzle-to-plate distance of the SAW process on the response variable of the weld geometry using the Taguchi method. The RSM system function (f) is actually a polynomial function that approximates the relationship between the natural variable and the output response variables in the following form: The RSM technique comprises four main steps, namely: i) conducting screening experiments; ii) achieving an almost optimal state by moving the area of interest closer to the optimal point; iii) development of the model within the region of interest around the optimal point; and iv) determining optimal settings for process parameters with respect to the orientation of the objective function (Kim et al., 2005).

Concluding remarks
2002) used a combination of GA and RSM techniques to determine optimal welding parameters for the GMAW process on mild steel plates. When comparing the same two optimization methods, Correia et al. 2005) found that they were both effective optimization tools for the GMAW process.
Introduction
Motivation for the study
- Weld joint type and geometry
- Experimental procedures
A third point to note is that the pipe-to-plate joint analyzed in this study was a multiple weld bead performed under natural cooling conditions. The arc welding process used in this study was submerged arc welding (SAW), and the temperature monitoring was performed using IR thermography.
Research Questions
What type of changes in mechanical properties of the weld zone, HAZ and the parent metal does the SAW process cause. How does the distribution of WRS fields in the case under investigation affect the fatigue properties of the welded specimens.
Methodology
- Applicable analytical methods
- Relationships of interest to the study
- Hybrid model used in this study
The methodological approach and its discussion in this chapter can be divided into three parts. Sample preparation and welding conditions and procedures are also presented in this section.

Concluding remarks
Introduction
Weld specimen preparation
The chemical composition of the base metals of the plate and pipe is shown in Table 4.2. The table shows that the strength properties of the filler material were equal to or better than those of the base material.

Welding experiment setup
There was no pre-heating of the weld sample before welding and no post-heating treatment after welding. The wire feed speed (FR) was controlled by the ESAB controller, as shown in Figure 4.2 to Figure 4.4.

Temperature measurements
78 | P a g e Flir ResearchIR software version 3.3 was accessed on the controller and the setup configuration that matched the scene temperature was selected. Points P1 and P2 were measured from the inside of the tube (weld root), while P3 and P4 were measured from the outside at the top of the plate side weld.
Residual stress measurements
The measurement positions were chosen as far as possible from the reference cutout and the position of the start/end of the weld. To reduce the complexity of the sample setup, the measurement positions were chosen to be tangential to the flat edge of the flange.

Bead geometry measurements
Microstructural analysis and hardness testing
Fatigue testing procedures
- Preparation and mounting of test specimen
- Applied bending load
- Fatigue test equipment setup
The specimens were subjected to a cantilever load applied at the top of the specimen tube section. The load parameter was kept constant and the pipe displacement was used as the failure criterion.

Concluding remarks
Introduction
Alternatively, the thermomechanical behavior of the weld structure can be modeled by focusing on the heat source. Their accuracy depends on empirical and theoretical parameters that describe the shape and size of the weld pool (Yaghi & Becker, 2004).
Thermal, mechanical and metallurgical interaction
In this study, a nonlinear time-dependent thermal-elastic-plastic analysis of a moving heat source was performed to predict the thermal and mechanical behavior of the weld and HAZ. First, a thermal analysis (which includes phase transformation effects) was performed to predict the temperature history of the model.
The Finite Element Model
The coupled thermal-mechanical analysis was non-linear due to the non-linearity of the material model (i.e. elastic-plastic material). The governing equation for the thermal analysis was conservation of energy, which is used to solve for energy.

Thermal analysis
- Heat source model
- Boundary conditions
- Metallurgical effects
- Material data
In this study, the effects of the solid-state transformation of martensite to the welding-induced residual stress were taken into account by including appropriate parameters in the thermal model. The total value of the properties involved within the transformation range A → M therefore includes the fractional assignments of martensite (VM) and austenite (VA).

Mechanical analysis
The displacement boundary condition is determined by the way in which the sample is clamped according to the experimental setup. A fixed boundary condition was applied far from the region of interest so as not to affect the results in the region of interest.

Concluding remarks
Introduction
108 | The page's input parameters (determined in the third step, discussed above) and comparing the responses to the predicted values. This chapter discusses the identification of the influential welding parameters and responses required for the SAW process (see Chapters 2 and 3).
Fractional factorial design
- SAW process parameters
- Conducting the experiments
- Statistical analysis and optimisation
It is clear from the summary of previous studies on parametric optimization (Chapter 2) that four SAW parameters have consistently shown significant effects on the output - the output being weld geometry. The welding mode of the SAW machine used can be set either to CA (constant amperage) or to CW (constant wire).

Concluding remarks
The MOGA used to solve the WPPOP in this study followed the generalization as detailed in Figure 2.7 in Chapter 2. The results for the mentioned experimental and analytical work are presented and discussed in this chapter.
Experimental Temperature Histories
The incremental growth of the thermal footprint from Figure 7.2(a) to Figure 7.2(b) is clearly visible in the presented frames. The general profile of the graphs in Figure 7.5 is indicative of the temperature distribution in a welding process observed in similar studies (Zondi, 2014).

Thermal Analysis Results
The breaking of the solder slag during the experiment also caused sharp peaks in the temperature readings (visible in Figure 7.7). This refers to reflections from surrounding surfaces, the presence of other heat sources, detector oversaturation, measurement uncertainties, and camera calibration errors.

Residual Stress Measurement Results
The rest of the tube-side samples have the same constant wire (CW) mode configuration and have the same input power. The choice of residual stress distribution will be influenced by the point and direction of loading of the welded structure.

Mechanical Analysis Results
The heat input of sample 12 and sample 13 is exactly the same in magnitude, although the wire feed speed of the two is different. It should be noted that the heat input of the two CA mode samples differs significantly from that of the two CW mode settings.

Comparison of experimental and simulation results
In general, there is a clear correlation between the simulated and experimental results for all three components of the residual stress, especially when looking at the general profiles of the curves. To determine the stress, the entire load history of the material must be taken into account.

Bead Geometry Results
It is likely that the position of the simulation voltage measurement points differs slightly from the actual measurement points. The geometry of the welded specimen makes it difficult to establish the exact measurement point consistently in all cases.
Microstructural Analysis
High-resolution micrograph of the HAZ of the tube side in sample 6 at a magnification of 2000x. 144 | P a g e Figure 7.34 is a micrograph of the subcritical region within the HAZ of the metal plate.

Hardness Results
- Hardness Experimental Results
- Maximum Hardness Calculations
The lowest observed hardness value (excluding PM) is 183.6 in the plate side HAZ of sample 9. The resulting maximum hardness values are given in Table 7.10 for all targeted parts of the weldment.

Fatigue Test Results
- Static and Fatigue Trial Tests
- Specimen Fatigue Tests
The graph shown in Figure 7.44 illustrates a plot of test data as received from the laboratory report. The vertical axis is a record of the displacement measured by the machine's actuator, the horizontal axis represents the number of cycles to failure.

Parametric Optimisation Results
- Statistical Analysis Results
- Multi-Objective Optimisation Results
The optimization settings for CA using the combination of multipurpose equations VHN(PTHAZ), VHN(WM), VHN(PPHAZ), PTRS and PPRS are presented in Table 7.15. These include samples 6, 7 and 9, whose combination of welding parameters exactly match those indicated in Table 7.15.

Concluding Remarks
This final chapter summarizes how the objectives of the study have been met by answering the research questions. The chapter also deals with the present study's contribution to the research area's knowledge, including the contribution from published research work.
Factors that Affect WRS
The subject of this study is the fatigue behavior of the nozzle-shell connection of carbon steel pressure vessel under welding-induced residual stress resulting from parametric combination of the SAW process. The study successfully uses the hybrid methodology that includes experimental work, numerical methods and mathematical programming to determine the effect of residual stress on the fatigue life of welded structures with special emphasis on the welding parameters responsible for generating the residual stress fields in multi-pass circumferential die -must weld joint.
Temperature Characterisation Through IR Imaging
172 | Page's framework is that, given a particular stage in the welding process, one will know which influential factors apply, and which corresponding mitigation techniques to use. The proposed classification framework can therefore be used to determine appropriate influencing factors and corresponding mitigation techniques for WRS throughout the SAW welding process.
Distribution of WRS Fields
Numerical Analysis
Small differences between simulation and experiment results were considered fair for the subject under investigation. A value of 0.22 mm is considered fair given the size and material of the weld sample.
Microstructural Characteristics
The marked differences in some areas between the simulation and experimental results can be accredited to the corresponding differences in the characteristics of an idealized simulation environment and the realistic experimentation process. The numerical model developed adequately represents the welding process for the conditions under investigation in this study and can be used to study the various process parameters of the process.
Weld Properties
The mechanical analysis produced residual stress distribution curves whose profile is comparable to that of the experimental results. The highest degree of distortion is evident around the center of the plate where the constraint is reduced, given the way in which the sample is mounted on the turntable.
Fatigue Properties
Optimal Parameters
Response to the Research Questions
Recommendations for Future Work
This will ensure that researchers and practitioners are able to predict the outcome of the fatigue properties based on the level of variance of specific welding parameters. In real life, pressure vessels operate under positive or negative pressure, and therefore considering the effect of such pressure on the stress state of the welded structure could provide additional knowledge that can be used for pressure vessel welding applications.
Contribution of Published Work
Pressure vessel design codes provide guidance on how residual stresses should be included when predicting the fatigue life of pressure vessels. It would be useful to conduct a study comparing what the codes provide and what field experiments and analyzes reveal.
Originality of the Present Work