It was found that the temperature used to produce CoSi by reactive deposition had a significant effect on the subsequent CoSb formation temperature. Data analysis shows that the lower the reactive deposition temperature used to form the CoSi film, the higher the subsequent CoSh formation temperature.
The figure shows the formation of CoSb phase, which starts at a lower temperature when the sample is prepared at a higher reactive deposition temperature (measurements from XRD data performed by J. Demeulemeester at Ghent University).
List of Tables
Introduction
- Background
- Growth Kinetics
- Diffusion
- Nucleation
- Cobalt Silicide System
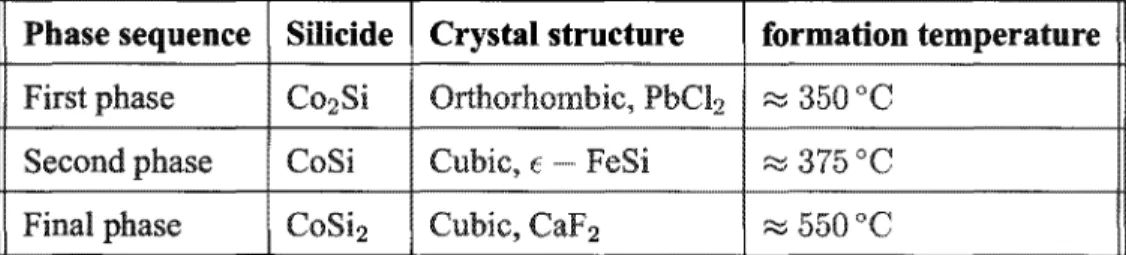
At present, NiSi appears to be the most promising candidate to replace CoSi2 within the microelectronics industry (Lavoie et al. 2003). It has been reported (Appelbaum et al. 1985) that formation of CoSi2 is also nucleation COB-.
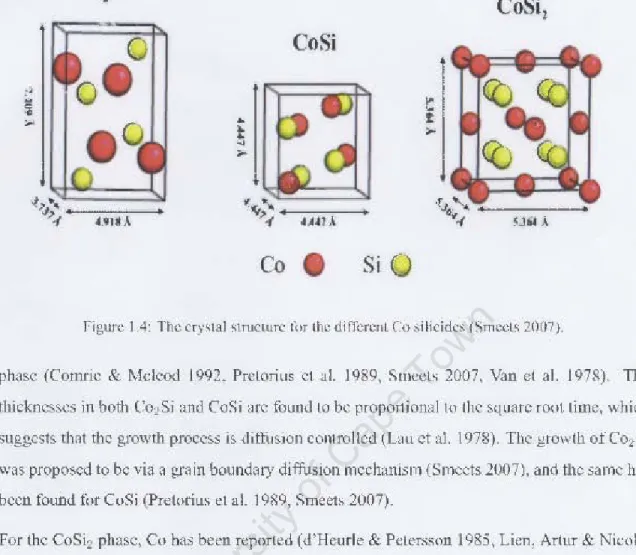
CoSi
Procedure
- Sample preparation
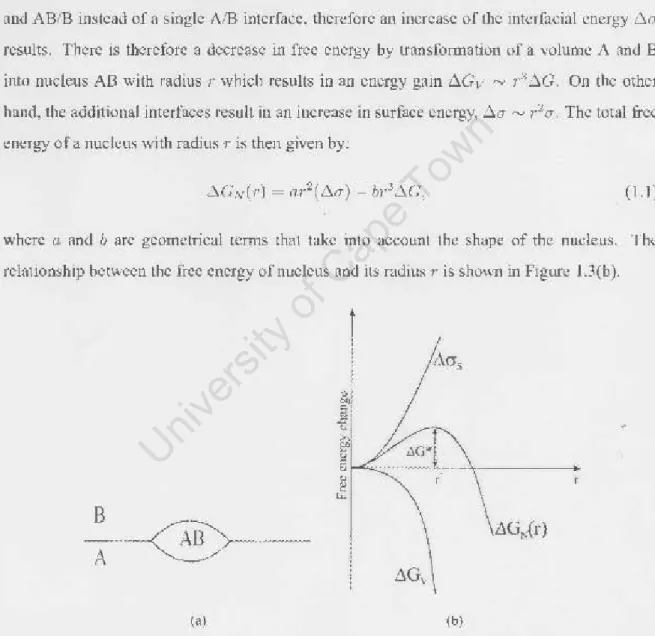
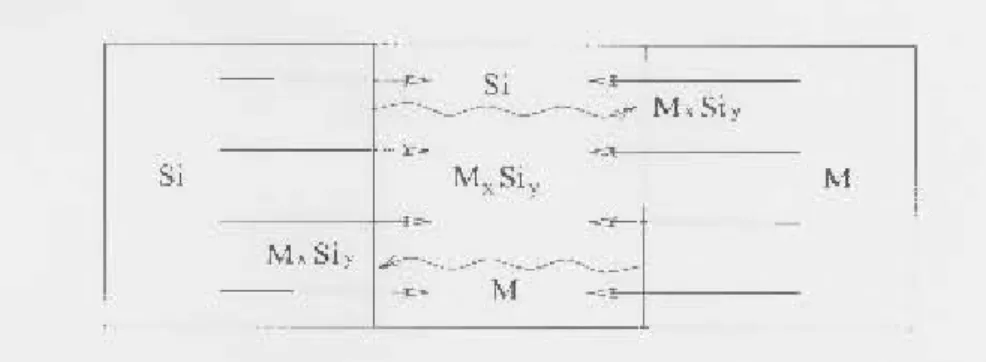
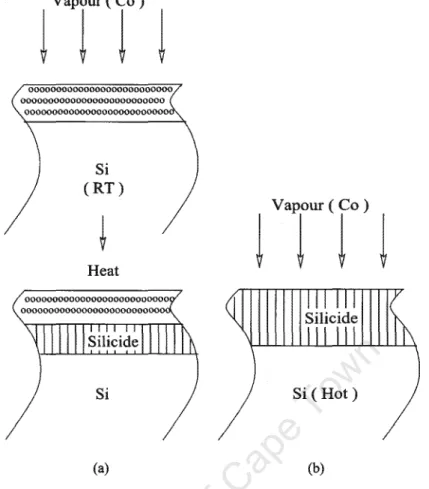
The cobalt film is then heated to provide the necessary energy for the formation of the silicide. In reactive deposition, Figure 2.1(b), the instantaneous reaction between the cobalt and silicon during film deposition is achieved by depositing cobalt onto a heated silicon substrate.
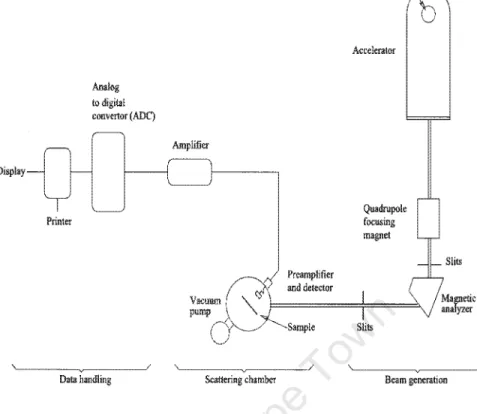
Rutherford Backscattering Technique
- Kinematic factor (K)
- Energy loss (r~~')
- Differential scattering cross section (~~)
- In situ real-time RBS
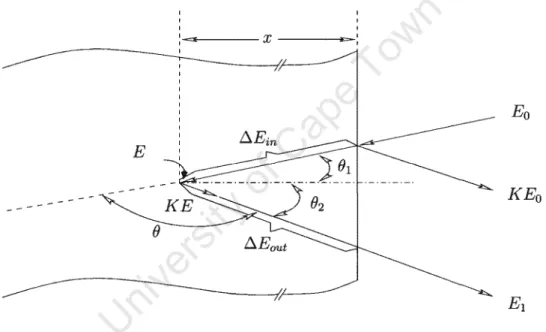
The reduction energy of the scattered incident particles depends on the mass of incident and target atoms. The energy loss per unit length dE/dx at the energy E of the incident projectile is defined as. The energy of the incident particles is Eo, while the energy immediately before scattering at depth is x E.
The energy after scattering is K E, while the energy of the particle emerging from the surface is E1. This makes it possible to establish the relationship between the energy loss of the backscattered particles and the depth x. By measuring the energy difference LlE, the thickness of the sample can be determined from tabulated values of.
The width t::.E is related to the thickness of the film via the energy loss factor as given in equation (2.4). Since in the CoSi layer nco = nSi, equation (2.7) can be approximated as. 2.8) The difference in the heights of the Co and the Si observed in the spectrum is thus essentially determined by the ratio of the scattering cross sections.
X-Ra y Diffraction
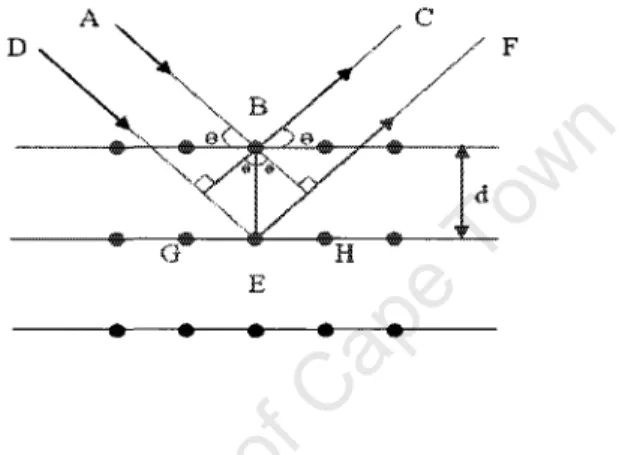
Panel (a) in Figure 2.12 shows how th~ elUTent \\a, fluctuated relative to the analysis, i, of Co deposited at room temperature. This is observed only when certain geometrical conditions are met, which can be expressed by Bragg's law. As seen in Figure 2.13, the diffraction from a set of planes will only occur if the normal to those planes bisects the angle between the incident and the scattered beam.
In this study, the real-time XRD measurements of the samples were carried out at Ghent University by J. It allows the identification of the phases (but gives no depth information) in a thin film, because it determines the interplanar distance dkhl (this interplanar distance dkhl) plane is characteristic for a silicide). The angle of incidence 8 was fixed at 240° and the detector was positioned at a fixed angle of 28 = 51° but spanned a range of 2B values (the Bragg condition will be satisfied for planes parallel to the sample surface and for which The Bragg angle is equal to 8).
The linear detector covered a window range between 41.5° and enabled rapid acquisition of the XRD spectra. Ramp thermal anneals from room temperature to 900 °C were performed in a H2 environment with a linear heating rate of 1 °C/s.
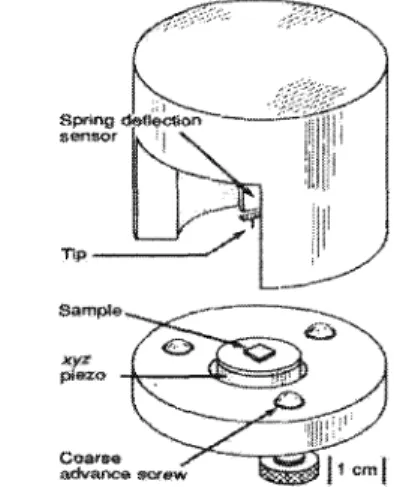
Atomic Force Microscopy
More detailed information on XRD technique can be found in Klug & Alexander (1974) and Sweet (2000). Although there are several different techniques to detect the cantilever deflections, a laser beam deflection system, introduced by Meyer and Amer in 1988 (Chen & Waston 1999), was used in this study. A schematic diagram of the optical beam deflection AFM is illustrated in Figure 2.16, where a laser beam is reflected by the top surface of the cantilever onto a position-sensitive detector.
In this investigation, the analysis of AFM images was performed using the computer software package Nanoscope v700.
RBS analysis
- Solid phase reaction results
- Rcactiw deposition re sults
- Co dt'po~ited at RT followed by a 450 -C anneal
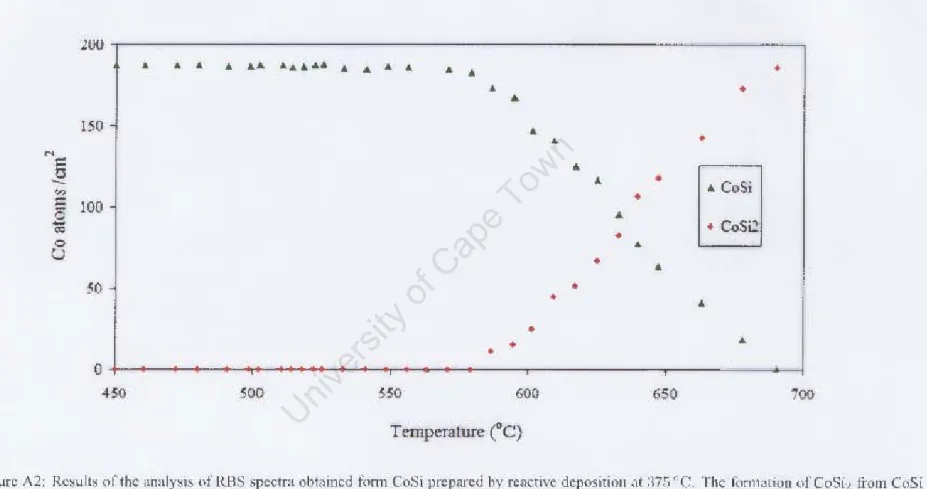
The complete set of results obtained by simulation iOIl of real "me spectm is shown in figure 3_7_ Tllie analysis;, COl1confirms that in CotS; 'i 'tem, Co,Si is the first phase. In Figure J.7 the nllmberofCo atom~icm2 in each phase is plotted as a function of lcmperalUlc The plot is divided into Ihi s maImer to cro"checl our and lysis, as the tolal number of Co atoms must remain in lh~ fllm. 't~nl lllrougho It can be seen from the figlLre tllat In the spectrum of the sample prepared by real'live dep The filmmti(ln of CoSi2 was observed to start at a temperature of 4G~oC for the sample prepared at the reading temperature of ",l() °C (see plot pl()t ; n Figure 3_ I 9) e completed it, put into COSi2 at a temperature of about 5¥lcC a, presented in Figure 3.21_ The complete results from the spectra taken during the mushrooms are ill displayed. .1.22. As L'\'identified by the aoow results, the form of CoSi , from grown CoSi film, b) reildi'e dCJX"ilion hilS cii beginning ferent tempcrat\l res. Di!oCUM,ion XRD analysis Discussion AJ< M Analysis Discussion In this work, the formation of the CoSi2 phase from CoSi films prepared by solid phase reaction and by reactive deposition has been investigated using real-time RBS and real-time XRD techniques. The surface roughness of the initial CoSi film and of the CoSh formed during take-off was also investigated using the AFM technique. Comparing the real-time RBS and XRD techniques used to study CoSi2 formation, it can be concluded that both techniques can be used to measure the onset temperature of CoSi2 formation, but real-time XRD is faster ( a measurement from room temperature to 900 °C is completed in approximately 15 minutes). The reaction rate can be obtained by both techniques, but only real-time RBS can provide quantitative data over the entire reaction period. The reactive deposition temperature had a significant effect on the formation temperature of the CoSh phase, as it was found that the higher the reactive deposition temperature at which CoSi was formed, the lower the CoSi2 formation temperature. The reactive deposition temperature also affected the reaction rate, as it was found that the higher the reactive deposition temperature, the faster the reaction rate. The CoSb films grown during ramping annealing showed similar behavior, with the films grown from CoSi produced at a higher reactive deposition temperature having the smallest CoSi2 grams. The growth mechanism seemed to change in type from columnar growth for lower reactive deposition temperatures, to layer by layer for higher reactive deposition temperatures. Appendix B Appendix B 1978), Backscattering spectrometry, Academic Press, New York. 1973), 'Principles and Applications of Ion Beam Techniques for the Analysis of Solids and Thin Films', Thin Solid Films Activation Energy for CoSi and CoSh Formation Measured During Rapid Thermal Annealing', Journal of Applied Physics Distribution of Species and Growth Interfaces during cobalt disilide formation', Nuclear Instruments and Methods in Physics Research B Real-time rbs / xrd study of CoSb formation from CoSi grown by reactive deposition', Nuclear Instruments and Methods in Physics Research B. 1988), 'Distribution of silicon in Pd2Si during silicide formation', Journal for Applied Physics An investigation into the mechanism of epitaxial Pd2Si formation', South Africa Journal of Natural Science. 2004), 'Metastable iron silicide phase formation by pulsed laser annealing', Journal of Applied Physics Epitaxial cobalt disilicide formation by pulsed laser annealing', South Africa Journal of Physics Diffusion in cobalt silicide during silicide formation', Important issues in semiconductor materials and processing technologies, eds. 1986), 'Kinetics of formation of silicides: A review', Journal of Materials Research Formation of thin films of CoSi2: nucleation and diffusion mechanisms', Thin Solid Films. 1985), 'Algorithms for the rapid simulation of Rutherford backscattering spectra', Nuclear Instruments and Methods in Physics Research B A Semiautomatic Algorithm for Analysis of Rutherford Backscattering', Nuclear Instruments and Methods in Physics Research B Formation and Microstructure of Synthesized Cubic Metastables iron silicides during pulsed laser annealing', Hyperfine Interactions Fundamentals of Surface and Thin Film Analysis, Noord-Holland, New York. 2003), 'Ni and co-based silicides for advanced cmos applications', Microelec-. 1974), X-ray diffraction procedures for polycrystalline and amorphous materials, New York. A new program for optimizing the achievable depth resolution of ion beam analysis methods', Nuclear Instruments and Methods in Physics Research B Marker and radioactive silicon tracer studies of PtSiformation', Journal of Applied Physics 72(1). 1993), 'Shallow si p+ -n junctions fabricated by focused ion beam Ga+ implantation through thin Ti and TiSi2 layers', Journal of Applied Physics A quantitative study of austenite formation and cementite dissolution at different austentization temperatures for 1.27 % carbon steel', Acta Metallurgica High quality thin film superconductors formed in situ by sputter deposition', South African Journal of Physics Formation and characterization of transition-metal silicides', VLSI Electronics: Microstructure Science Determination of the diffusing species and diffusion mechanism during CoSi -, nisi and ptsi formation using radioactive silicon as a tracer', Journal of the Electrochemical Society Nucleation, diffusion and texture while growth of coni-silicides. 2000), 'Synchrotron X-ray scattering techniques for microelectronics-related materials studies', IBM J. 1994), The influence of oxygen on the solid state reaction between nickel and silicon. 1998), 'In situ, real-time rbs measurement of solid state reaction in thin films', Nuclear instruments and methods in physics research Formation of co-si intermetallics in bulk diffusion couples. 1996), 'Effects of growth parameters on epitaxy of CoSi2(100) formation by reactive deposition epitaxy', Mater. diffusion marker and radioactive silicon tracer studies', Journal of Applied Physics Scanning probe microscopy and spectroscopy: methods and applications, Cambridge University Press.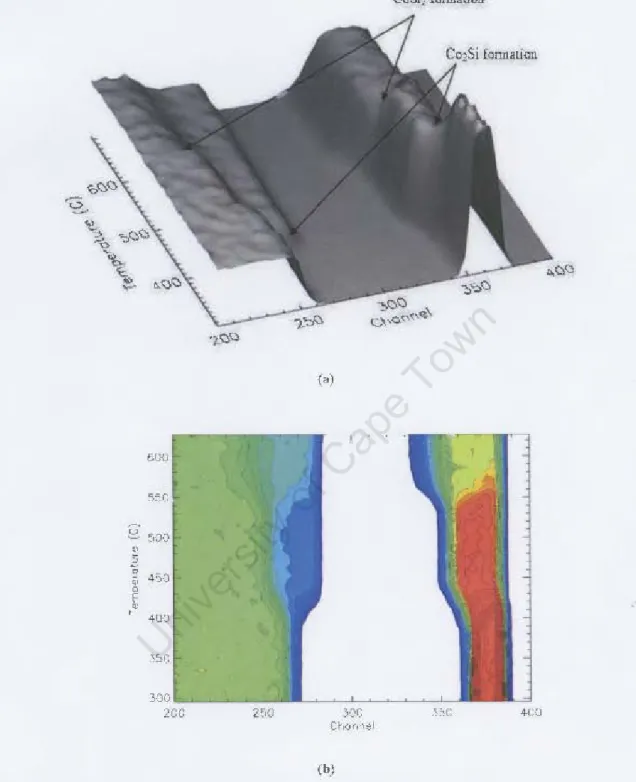
Discussion
Conclusions
Bibliography