The thesis must only be used for private studies or non-commercial research purposes. The primary focus of this study is to determine whether financial advisors create value for investors relative to the cost of advice by examining whether there is a significant difference between the net of advisor fee returns earned by advised and non-advised investors. The results of this study show that the returns generated by non-advised investors are not significantly different from the returns generated by advised investors before advisor fees are taken into account.
When advisor fees are considered, the impact of advisor fees creates a significant difference in performance between advised and non-advised investors; causing non-advised investors to perform the same or better after fees are taken into account. Trading behavior showed that advised investors made statistically fewer trades than unadvised investors. V return differentials resulting from the timing of trading decisions, for advised or non-advised investors.
Introduction
Literature Review
- Study by Allie, West & Willows
- The value of financial advice
- Financial literacy
- Behavioural biases
- Information & choice over-load
- Conflict of interest
- Conclusion
More specifically, it was found that increasing cognitive ability through education is what. Heath and Tversky (1991) found that people are more confident in their predictions in areas where they have self-reported expertise. The results of the experiment revealed that disclosure benefited the information providers but not its receivers.
Given the wide range of investment funds to choose from in the South African context, Anderson (2003) found that individuals may expect regret or choose to do nothing to avoid the decision. They also found that advised investors traded more than non-advised investors, and this trading activity was found to be negatively related to performance. Hackethal, Haliassos, and Jappelli (2011) found that advised investors experienced lower net returns on average due to trading costs and that this is consistent with commissions being the main source of income for advisors.
Data & Methodology
Research questions
- Return analysis
- Trading behaviour analysis
In addition to assessing return differences between the two groups, advised and non-advised investors, this study also considers whether there is a difference in the gross returns earned by investors compared to the underlying fund return. Is there a difference in the gross returns earned by advised and non-advised investors, over the investigation period. Is there a difference in the gross returns earned by advised investors compared to the fund return, as well as non-advised investors compared to the fund return, over the investigation period.
Is there a difference between the net advisory fee returns earned by advised and non-advised investors during the investigation period. Is there a difference between the number of trades made by advised and advised investors during the investigation period? Is there a correlation between the number of trades completed and the gross returns earned for both advised and non-advised investors over the period of investigation.
Research approach & data
- Acquiring data
- Data processing
- Limitations
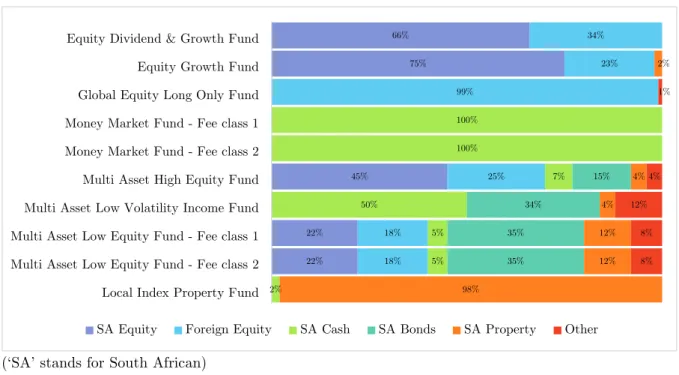
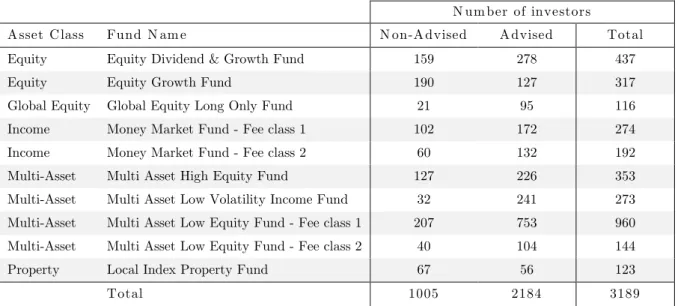
To ensure comparability of the calculated results across investors, investors who did not invest during the investigation period were excluded. A count of the investors in the revised data set was divided between advised and non-advised and then further divided by fund and fund class. Funds with fewer than 20 advised or non-advised investors were excluded, leaving only 10 unique fund type and fee class combinations in the final data set.
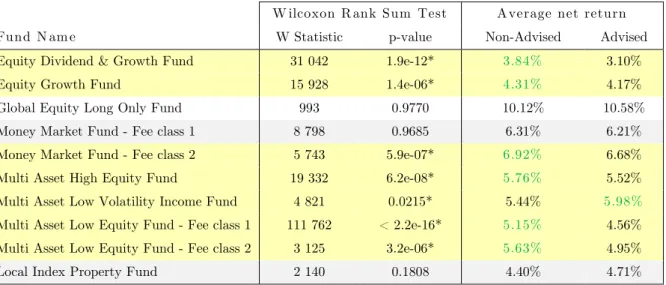
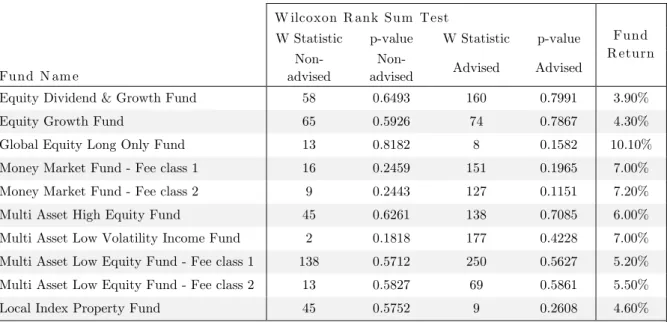
The final sample contained 3,189 unique investor mutual funds consisting of 1,005 non-advised and 2,184 advised investors. Average gross and net advisory fee returns per fund for both advised and non-advised investors are shown in Table 2. To ensure comparability of results between advised and non-advised investors, which they do not advise were transactions with the purchase of commissions.
Research method
- Approach for testing
- Testing for normality
- Non-parametric statistical tests
H0: The return data of the advised and non-advised returns are normally distributed. These tests were performed for advised and non-advised investors separately for each fund type. Under the Kolmogorov-Smirnov test, the null hypothesis was rejected for all funds and both advised and non-advised investors at a 95% confidence level. Therefore, non-parametric statistical tests will be used to evaluate the research questions, as these tests do not assume anything about the underlying distribution of the data.
If the null hypothesis is rejected, then there is evidence that one of the distributions is shifted to the right or left of the other and therefore there is evidence that the medians of the two populations differ. Spearman's rank correlation "rho" is used to measure the strength and direction of the relationship between two variables. If the null hypothesis is rejected, there is evidence that a statistically significant relationship exists.
Results
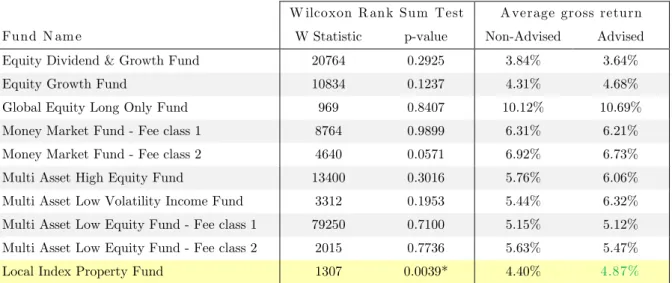
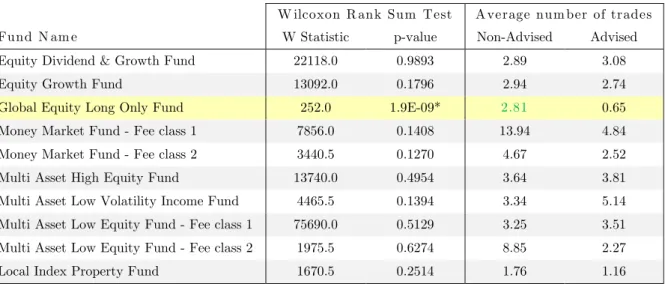
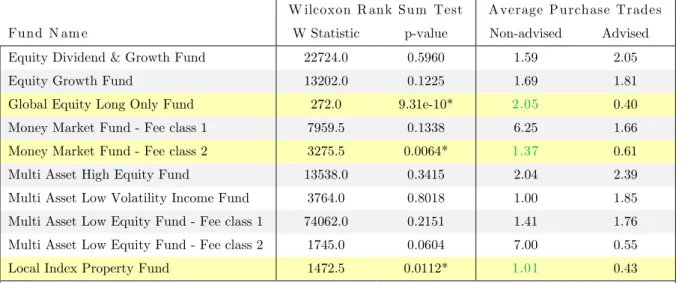
For the remaining funds, the null hypothesis is not rejected and therefore there is no statistically significant difference in the net return between advised and non-advised investors. Funds highlighted in yellow or where the p-value is marked with a '*' indicate that the difference between the number of advised and non-advised active trades is statistically significant at a 95% confidence level. Funds highlighted in yellow or where the p-value is marked with a '*' indicate that the difference between the number of advised and non-advised active purchase transactions is statistically significant at a 95% confidence level.
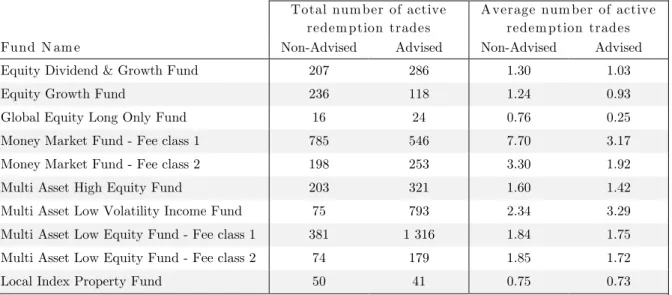
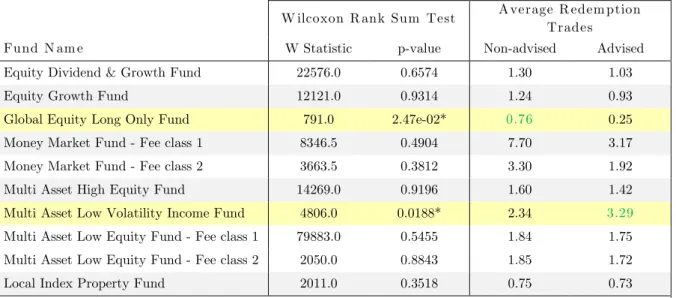
When comparing the average number of advised and non-advised active buy trades, bold green text indicates which average number was higher. Funds highlighted in yellow or where the p-value is marked with a '*' indicates that the difference between the number of active advised and non-advised repurchase trades is statistically significant at a 95% confidence level. When comparing the number of advised and non-advised trades, the bold green text shows which average number was higher.
Is there a correlation between the number of trades made and the gross return earned by both advised and non-advised. The correlation coefficients shown in Table 13 for non-advised investors show a very weak positive correlation for both Share Dividend & Growth and Equity. 51 Table 14 Test of the correlation between the number of active buy trades made and the gross return earned, advised versus non-advised investors.
52 Table 15 Testing the Correlation Between Number of Active Redemption Trades Executed and Gross Returns Earned for Advised Investors vs. Non-Advised Investors. The correlation coefficients shown in Table 14 for unadvised investors show a very weak positive correlation for both dividend and equity growth and equity. The correlation coefficients shown in Table 15 for uninformed investors show a weak positive correlation for the Local Index Property Fund.
For uninformed investors, the significant positive correlations for the Equity Dividend & Growth and Equity Growth funds shown in Table 13 are due to significant active buying.
Conclusion & Recommendations
Summary of results
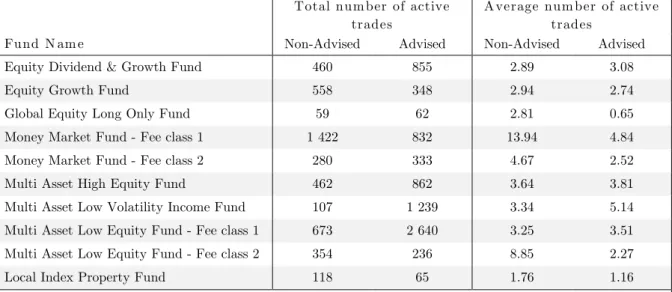
58 In investigating the drivers of return differences between advised and non-advised investors, the results of this study show that overall advised investors made fewer active trades than non-advised investors. Across all funds considered in this study, 43% of advised investors did not trade during the investigation period, compared to 35% of non-advised investors (Figure 2). 21% of advised investors made 4 or more active trades during the investigation period, compared to 27% of non-advised investors (Figure 2).
This result contradicts what was found by Allie, West, and Willows (2015), who found that advised investors traded significantly more than unadvised investors. It may be that advisors have overcome the negative behavioral effect arising from overconfidence and transgression, as discussed by Barber and Odean (2001). Perhaps unadvised investors have overestimated their abilities, as discussed by De Bondt and Thaler (1995), leading them to trade more.
When assessing the correlation between active trades and gross returns earned, the results showed no strong evidence of returns differentials arising from the timing of trading decisions, for both advised and non-advised investors. The results of this study show that despite the fact that non-advised investors trade more on average than advised investors, their investment performance is not worse off as a result.
Conclusion
59 This study considers only the quantitative value of advice, as measured by differences in returns between advised and non-advised investors. The results of this study show that while advisors add value through excess returns to investors' portfolios, the difference in return is not significant compared to non-advised investors. The results also show that when advisory costs are taken into account for advised investors, they reduce the value as the additional returns added are lower than the advisory costs.
The results of this study are consistent with the fourth quadrant of the 'Counseling Values Framework' described by Dutkiewicz, Levin and Dukhi (2007), where "on a net basis the financial well-being of the consumer is negatively affected" (Dutkiewicz, Levin and Dukhi, 2007) . Dutkiewicz, Levin and Dukhi (2007) suggest that reducing the cost of consulting would be a way to turn the experience into a positive value. The alternative view is that the cost of advice is necessary to overcome the many behavioral and cognitive biases that investors face when making investment decisions, which can “interfere with decision making” (Willis, 2008).
Furthermore, Willis (2008) finds that information asymmetry between product providers and consumers, together with the changing regulatory landscape, lack of consumer understanding and numerical skills put consumers at a disadvantage to -advised. Given that retail investors have a plethora of investment options available to them, this can lead to 'choice overload'. Willis (2011) suggests that this may lead consumers to choose oversimplified decision-making strategies that do not take into account all the dimensions of the decision.
Anderson (2003) suggests that consumers may avoid making decisions if they are unsure of the best option or if they expect regret. Ultimately, there has to be a balance between forgoing investment returns to pay for financial advice and receiving no advice at all and enabling poor investment decisions or making no financial decisions at all and neglecting one's financial well-being. While the results of this study show that financial advisors failed to add significant quantitative value after fees, investors can benefit from qualitative value.
It goes without saying that the more extensive the advisory process is followed, such as a complete needs analysis approach (so that the investor's full financial needs are met), and the more qualified and experienced the financial advisor is, the more qualitative value should be added. by financial advisors.
Areas for future research
Appendices
Appendix 1
Appendix 2
Appendix 3
Appendix 4
Appendix 5
Appendix 6
Appendix 7