Published by the University of Cape Town (UCT) under a non-exclusive license granted to UCT by the author. I authorize the university to reproduce for research purposes all or any part of the content in any way. The University of Cape Town (including academic staff) for giving me the opportunity to pursue a Masters at their prestigious university and to enhance my knowledge and skills during the course of the program.
These findings provide insight into the role that investment in IC can play in supporting firm performance and firm market value. Originality/value – This study provides a more recent analysis of original work by Firer & Williams (2003) and Firer & Stainbank (2003).
INTRODUCTION
- B ACKGROUND
- P ROBLEM S TATEMENT
- R ESEARCH O BJECTIVES
- R ESEARCH QUESTIONS
- R ESEARCH M OTIVATION
- S IGNIFICANT O RIGINAL C ONTRIBUTION
- R ELATED R ESEARCH
- D ATA AND M ETHODOLOGY
- D ATA
- M ETHODOLOGY
- R ESEARCH O UTPUT
- L IMITATIONS
- D ELIMITATIONS ( SCOPE )
- S TRUCTURE
- S UMMARY AND C ONCLUSION
However, an understanding of IC measurement, while improving, is still limited, and understanding of the relationship between IC and company performance and market value is also limited. Therefore, the problem is that there is a gap in the literature regarding the understanding of IC and its contribution to company performance and market value, which limits the insight into the impact of IC investment on company performance and market value. Is there a significant relationship between VAICTM components (ie IC components) and market value in South African listed companies.
The important contribution of this study is that it extends the original work of Firer & Stainbank (2003) and Firer & Williams (2003) by providing an updated view of the relationship between investment in IC and firm performance and market value for South Africa. African companies against the background of the aforementioned changes in the economic climate facing South African companies. It elaborates on the purpose of the study to address a research gap pertaining to the relationship between company IC and company performance, and between IC and market value in the South African context.
LITERATURE REVIEW
D EFINING AND C ATEGORISING I NTELLECTUAL C APITAL
- H UMAN C APITAL
- S TRUCTURAL C APITAL
- R ELATIONAL C APITAL
Therefore, HC is primarily focused on the people element, their individuality as well as the combined value added to a company within the context of the individual's role as well as the company's specific culture, values and philosophy (Bontis, 2001). An important characteristic of SC is that SC stays behind in the company regardless of whether the HC (employee/staff) element leaves the company (Bontis, 2001), so unlike HC, SC can be owned, controlled and potentially sold by a company. (Edvinsson, 1997). Therefore, it is essential for companies to convert as much of the individual and collective knowledge of employees (i.e. HC) into organizational knowledge (i.e. SC) (Ordóñez de Pablos, 2004).
As with HC, a strong supportive culture within a firm allows the firm to have a stronger presence of the SC component in its overall IC base. RC, as the title suggested, primarily refers to the relationships that exist between a company and its external stakeholders.
I NTELLECTUAL C APITAL : R ESEARCH F OCUS AND M EASUREMENT M ODELS
- Non-monetary Measurement Models
- Generic Intellectual Capital Performance Measurement Models
- The Skandia Navigator
- The IC-Index
- EVA TM Model
- Tobin’s Q
- Value Added Intellectual Coefficient (VAIC TM )
The most important of these is the focus on financial performance, but successful financial performance requires a focus on four key areas, namely the company's customers, its human resources, it processes and its innovation and development (capacity building). Bontis (2001) suggests that a company must have a clear strategy and identify the sources of value of the company arising from the IC to assist in the selection of the appropriate indicators. If the number is positive, the company has generated EVATM and if it is negative, the company has not generated EVATM.
Tobin's Q was created by James Tobin and attempts to capture the relationship between the market value of a company and the book value of the company to derive a surrogate asset value index called Tobin's Q (Bontis 1998; van den Berg, 2002). This index was used to identify the importance (or degree) of IC in the company and what part of the company's value was essentially not captured within the conventions of its book value according to financial reporting standards.
I NTELLECTUAL C APITAL , MARKET VALUE AND COMPANY PERFORMANCE
- Studies in Developed Countries
- Sector, Period and Sample Size
- Independent and Dependent Variables
- Type of testing and control variables utilised
- Review of VAIC TM Findings and Results
- Review of HCE Findings and Results
- Review of SCE Findings and Results
- Review of CEE Findings and Results
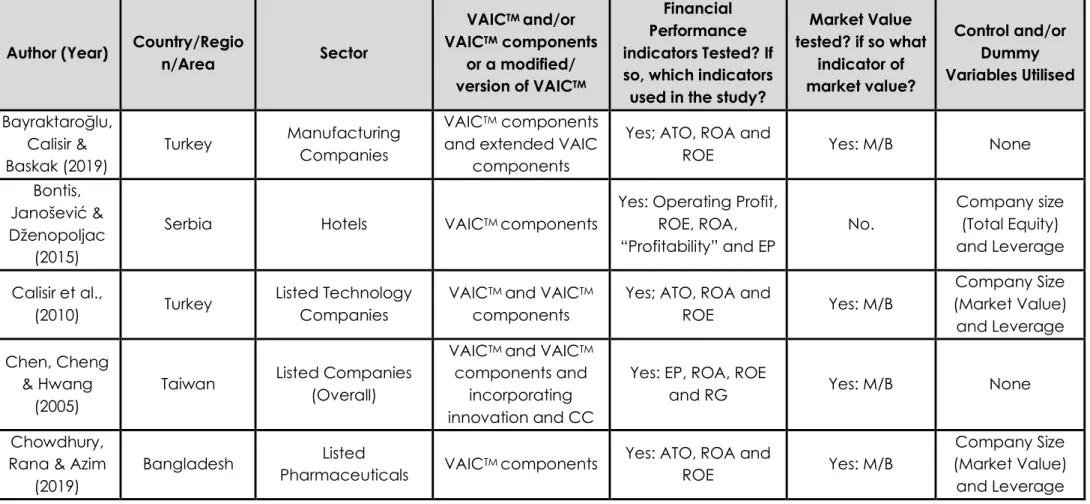
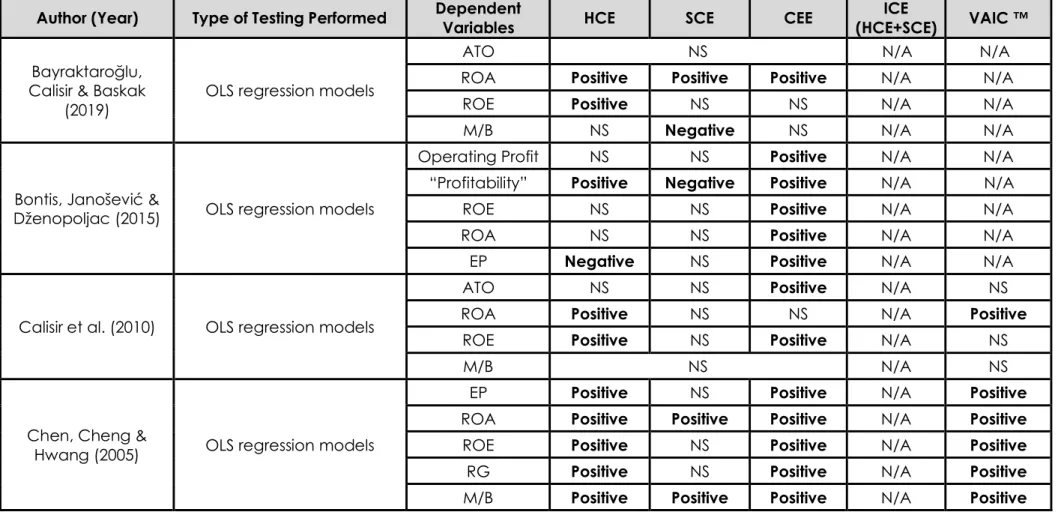
- Studies in Emerging Markets
- Sector, Period and Sample Size
- Independent and Dependent Variables
- Type of testing and control variables utilised
- Review of VAIC TM Findings and Results
- Review of HCE Findings and Results
- Review of SCE Findings and Results
- Review of CEE Findings and Results
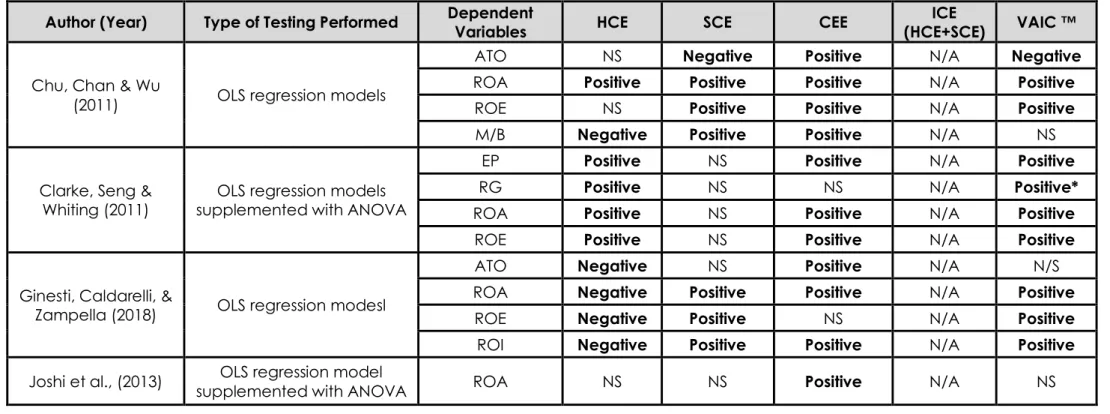
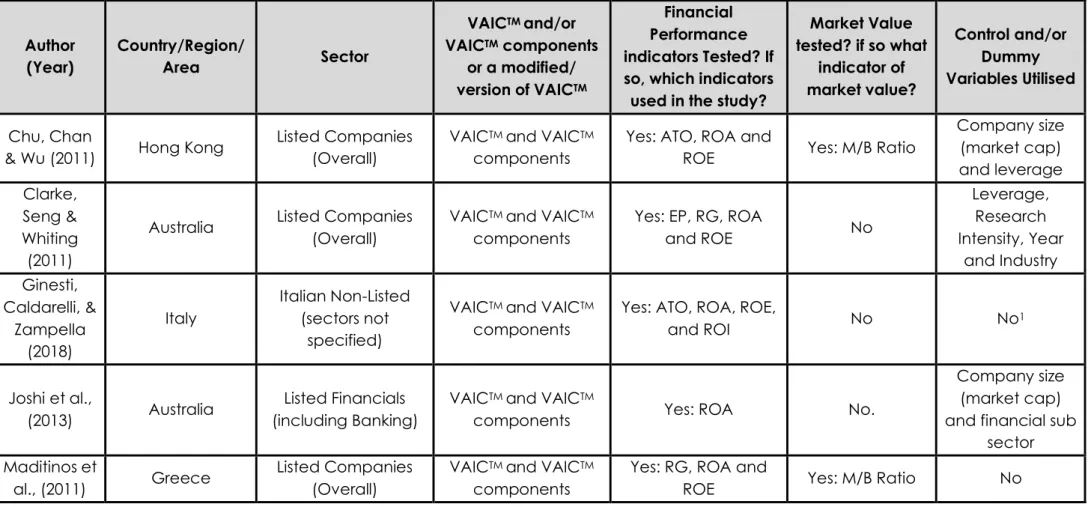
Of the studies in developed countries that tested the relationship between VAICTM and the company's market and book values, the results were mixed. Companies listed in Hong Kong showed a positive relationship between VAICTM and measure of performance (ROE and ROA) and a negative relationship between VAICTM and ATO (Chu, Chan & Wu, 2011). Joshi et al., (2013) and Maditinos et al., (2011) could not find a definitive relationship between VAICTM and all forms of the company's market and accounting performance.
In summary, studies on the relationship between VAICTM and firm performance based on market and book values have shown mixed results. As with the general VAICTM, prior studies on the relationship between HCE and firm profitability have produced mixed results across studies. The next section discusses the relationship between IC in the form of SCE and market and accounting or book values of return.
Section 2.3.2 documents a similar review considering the relationship between IC as a whole (VAICTM), SCE, HCE, CEE and company performance. Unlike developed countries, there are significantly more studies of the relationship between VAICTM and company performance in emerging markets. For companies in South Africa, the relationship between ATO and VAICTM was found to be significantly positive (Firer & Stainbank, 2003), while Ghosh &.
Mondal (2009) and Pal & Soriya (2012) found no significant relationship between ATO and VAICTM for firms in India. The results for the relationship between firm performance based on market value and HCE yielded mixed results for firms in emerging markets as well as for firms in developed countries. In summary, the relationship between HCE and firm performance is mixed, but with a positive bias for emerging market firms.
The relationship between EQL and company performance based on book or book values was shown to be positive for all studies in all. Dženopoljac et al., (2017) found a negative relationship between CLE and company performance based on NPM and ROA for countries in the Middle East and Dženopoljac, Janoševic & Bontis, (2016) found a negative relationship between CLE and company performance company for companies in Serbia.
S UMMARY AND CONCLUSIONS
DATA AND METHODOLOGY
- D ATA
- M ETHODOLOGY
- Statistical Approach
- H YPOTHESIS
- R EGRESSION M ODELS
- D IAGNOSTIC T ESTS
- Multicollinearity
- Unit Root Test and Stationarity
- Heteroskedasticity and Serial Correlation
- Endogeneity
- S UMMARY AND C ONCLUSIONS
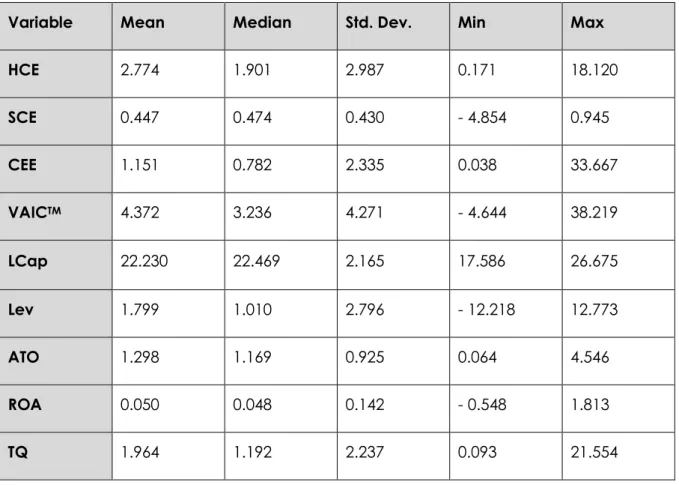
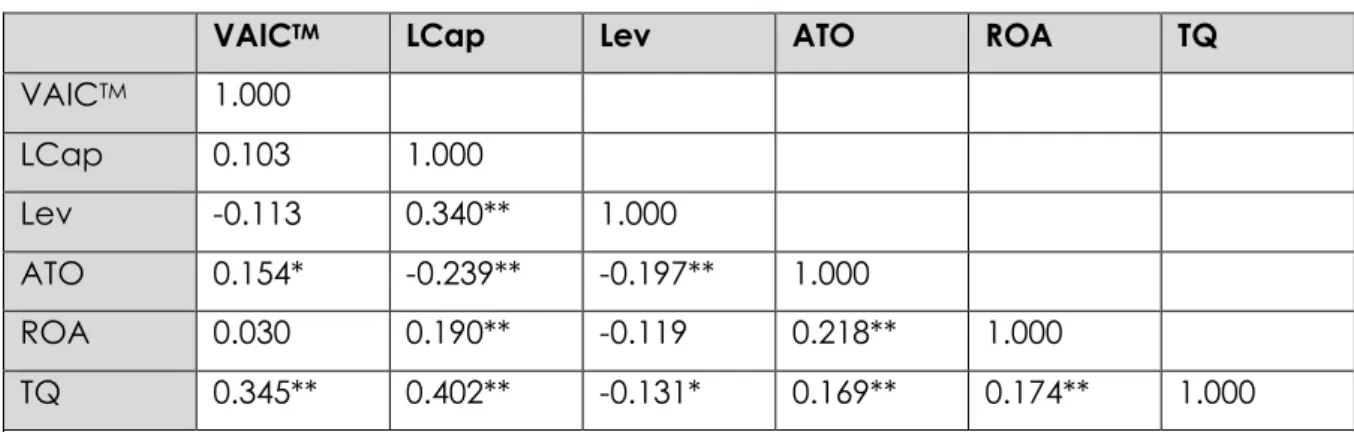
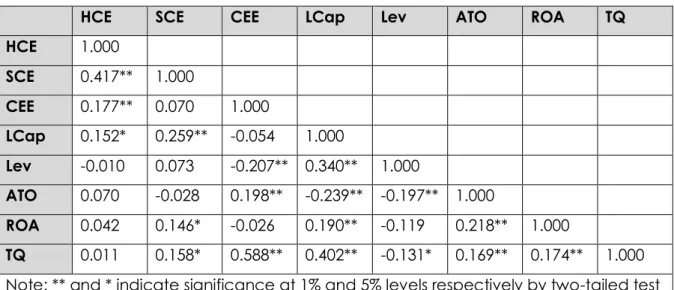
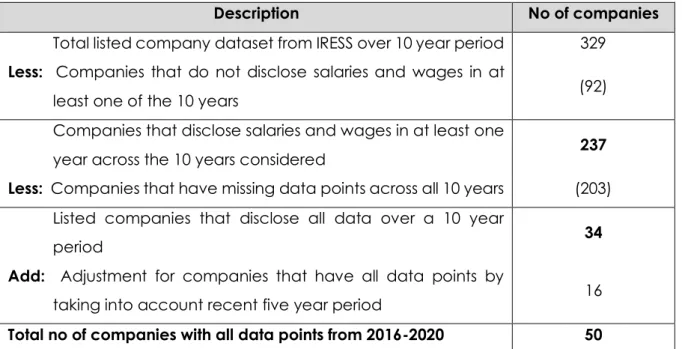
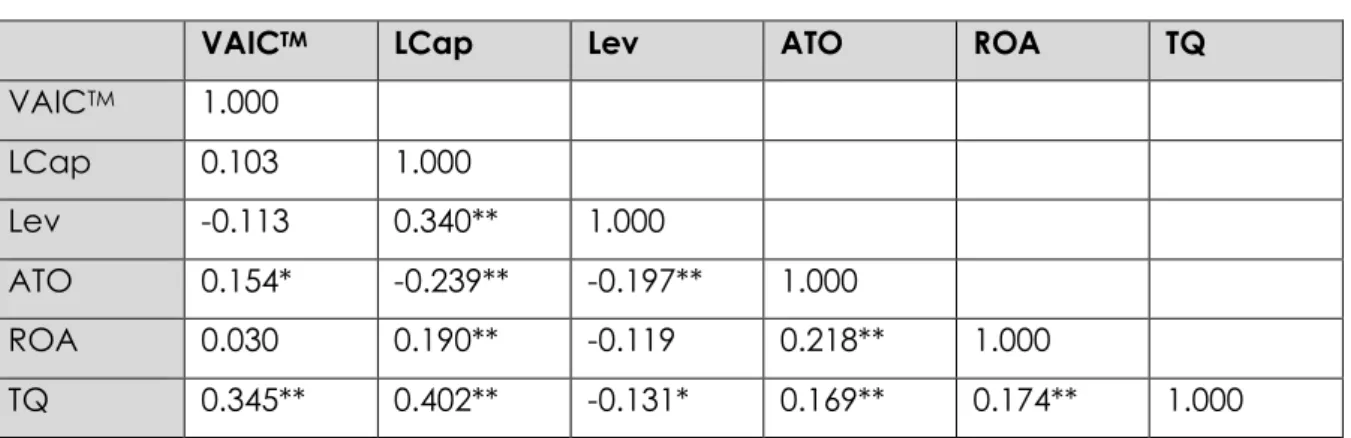
Refer to Table 5 for a summary of the methodology used to arrive at the final sample of companies used in this study. In addition to the panel data regression applied, Pearson Correlation Analysis was also applied to provide a high-level indication of the relationship between variables. Severe multicollinearity between independent variables in the regression model can cause large variances in the model's coefficients (Baltagi, 2021).
This may be an indication of the existence of multicollinearity in the sample data used in the analysis. This is because one or more independent variables can be predicted from another independent variable, which makes the prediction of the relationship dependent and independent variable more difficult (Hair et al., 2010). VIF performs a regression of the independent variables against each other, where large VIF value will show a high degree of multicollinearity between independent variables (Hair et al., 2010; Kleinbaum, Kupper & Muller, 1988).
If unit root is present in the time series (i.e. data is non-stationary), the results of the analysis using these data may be unreliable, it may indicate relationships between variables that do not really exist (Hair et al., 2010; Kleinbaum Kupper & Müller, 1988). This study uses the ADF test to test for unit root in each of the time series studied. The W test makes use of the residual from the principle regression model, which can take
In this chapter, we also explain the measures taken to ensure the integrity of the data used and their suitability for the performed analysis. In Section 4, we report the results of tests for unit root, heteroskedasticity, and serial correlation. This is followed by a discussion of the output of the six regression models defined in Chapter 3.
FINDINGS AND DISCUSSION
- D ESCRIPTIVE S TATISTICS
- M ULTICOLLINEARITY
- Pearson Correlation
- Variance Inflation Factor
- U NIT R OOT T EST AND S TATIONARITY
- H ETEROSKEDASTICITY AND S ERIAL C ORRELATION
- R EGRESSION R ESULTS
- Results of Model 1
- Results of Model 2
- Results of Model 3
- Results of Model 4
- Results of Model 5
- Results of Model 6
- S UMMARY AND C ONCLUSION
The p-value of the ADF test is less than 0.05, so the null hypothesis indicating the presence of a unit root can be rejected. NS – The P-value of the ADF test is greater than 0.05, so the null hypothesis is accepted and unit roots (non-stationarity) are present in the within-panel variable. The S – p-value of the ADF test is less than 0.05, so the null hypothesis is rejected and the variable is considered stationary in the panel data set.
The results of Model 1 confirm hypothesis H1(a), which indicates a positive relationship between VAICTM and the firm's market value (TQ). The model shows that none of the independent variables show a significant relationship with the dependent variable (ROA). The findings of this study contrast with those of Firer & Stainbank (2003), who found a significant negative relationship between VAICTM and company ROA.
Given the low explanatory power of the model as indicated by the R2 values and its F statistic, Model 2 fails to confirm the hypothesized negative relationship between VAICTM and the company's ROA. The results are similar to that of Model 2 in that none of the independent variables is significant. The control variables, LCap and Lev show significant positive and negative relationships with company TQ, respectively.
The results of the relationship between the components of VAICTM and the company's profitability, based on Model 5, do not support the relationship assumed in hypotheses H2(b), H3(b) and H4(b). This weaker relationship between the components of VAICTM and the firm's ATO is similar to the results of previous studies by Firer & Williams (2003) of South African firms in which only HCE has a significant relationship with productivity. The Model 6 results therefore do not support the assumed relationship between the components of VAICTM and the firm's ATO, as assumed in hypotheses H2(c), H3(c) and H4(c).
CONCLUSION
L IMITATIONS IN THE STUDY
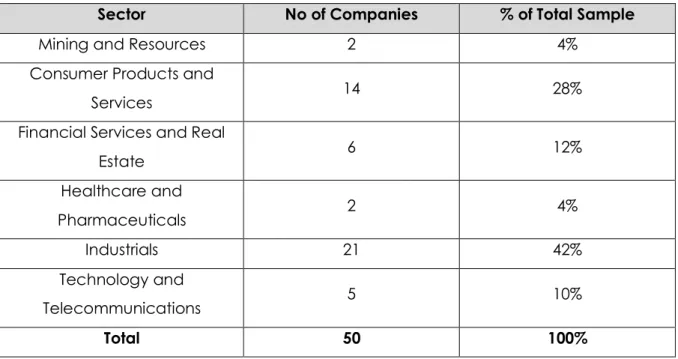
This problem is exacerbated by the crucial disclosure of salaries and wages to apply the VAICTM methodology to measure IC components. The demographics of the sample size considered in this study are largely dominated by companies within the industrial sector (42%) and the consumer products and services sector (28%). The typical IC-intensive sectors such as mining and materials (4%), healthcare and pharmaceuticals (4%) and technology and telecommunications (10%) are underrepresented in this sample.
This may be the main reason for the insignificance of IC components HCE and SCE, in the testing performed.
F UTURE RESEARCH
An empirical investigation of the relationship between intellectual capital and firms' market value and financial performance. Intellectual capital efficiency and organizational performance: In the context of pharmaceutical industry in Bangladesh. Measures that matter: an empirical investigation of intellectual capital and financial performance of banking firms in Indonesia.