The potential overlap in habitat space of caracal (Caracal caracal) and blue duiker (Philantomba monticola) in KwaZulu-Natal, South Africa: an environmental niche
modelling approach
by
AMANDA LYN JONES
Submitted in fulfilment of the academic requirements of Master of Science in Ecology
School of Life Sciences
College of Agriculture, Engineering and Science University of KwaZulu-Natal
Durban South Africa
Supervisor: Associate Professor M. Corrie Schoeman
March 2016
PREFACE
The research contained in this dissertation was completed by the candidate while based in the School of Life Sciences of the College of Agriculture, Engineering and Science, University of KwaZulu-Natal, Westville Campus, South Africa.
The contents of this work have not been submitted in any form to another university and, except where the work of others is acknowledged in the text, the results reported are due to investigations by the candidate.
_________________________
Signed: Associate Professor M. Corrie Schoeman
_________________________
Date
DECLARATION : PLAGIARISM
I, Amanda Lyn Jones, declare that:
(i) the research reported in this dissertation, except where otherwise indicated or acknowledged, is my original work;
(ii) this dissertation has not been submitted in full or in part for any degree or examination to any other university;
(iii) this dissertation does not contain other persons’ data, pictures, graphs or other information, unless specifically acknowledged as being sourced from other persons;
(iv) this dissertation does not contain other persons’ writing, unless specifically acknowledged as being sourced from other researchers. Where other written sources have been quoted, then:
a) their words have been re-written but the general information attributed to them has been referenced;
b) where their exact words have been used, their writing has been placed inside quotation marks, and referenced;
(v) where I have used material for which publications followed, I have indicated in detail my role in the work;
(vi) this dissertation is primarily a collection of material, prepared by myself, published as journal articles or presented as a poster and oral presentations at conferences. In some cases, additional material has been included;
(vii) this dissertation does not contain text, graphics or tables copied and pasted from the Internet, unless specifically acknowledged, and the source being detailed in the dissertation and in the References sections.
_________________________
Signed: A.L Jones
_________________________
Date
ABSTRACT
According to the mesopredator release hypothesis, when apex predators disappear from an ecosystem, the number of mesopredators increase and thus predation of prey species increases. Since the extermination of large predators in KwaZulu-Natal (KZN), South Africa, the caracal (Caracal caracal), a feline mesopredator, is presumed to have spread throughout the province. At the same time, populations of the rare blue duiker (Philantomba monticola), a small forest antelope, have markedly declined; probably due to habitat loss and degradation, yet possibly also by increasing numbers of mesopredators. As forest patches become smaller and more isolated, the blue duiker’s ability to disperse and find refuges becomes limited. Any additional predation threats due to increased probability of encounters between blue duiker and caracal could drive local populations to extinction. However, quantitative data on current broad-scale distribution ranges and habitat requirements of both species are scant. The aim of this study was to use an environmental niche modelling approach to test the hypotheses that the caracal has expanded its distribution range; that its suitable habitat space (i.e. Grinnellian niche) overlaps considerably with that of the blue duiker; and that human impact affects suitable habitat space.
I compiled a comprehensive occurrence database for caracal and blue duiker using historical data, recent sightings and survey responses from conservancies and protected areas throughout KZN. I then used niche-based environmental models (Maxent) to map the potential suitable habitat space of caracal and blue duiker, based on the occurrence data and different combinations of environmental and human impact variables. I calculated two niche overlap indices to quantify habitat niche overlap and compared these to 1000 expected overlap indices in a null model to test for niche equivalence.
After spatial filtering, my database comprised 94 caracal and 90 blue duiker occurrence points for 1994 to 2013. For both species, vegetation biome, specifically forests, was the most important variable, with rainfall second most important. Approximately two-thirds of KZN was moderate to highly suitable habitat for caracal and one third was moderate to highly suitable habitat for blue duiker. The potential suitable habitat maps matched mostly with published distribution ranges for both species. Nonetheless, occurrence data within comparably lower habitat suitability, suggest caracal may have expanded their range further towards the north east of the province. The niche overlap scores were considerably high (D = 0.683 and I = 0.924), yet the caracal and blue duiker niche models were not identical, which can be expected of a generalist carnivore with a broad niche compared to the narrow niche of a specialist herbivore. At the highest threshold of habitat suitability the overlap between caracal and blue duiker covered 7% of KZN with 20% of the overlap occurring in 70% of the forest biome. The overlap consisted primarily of a large region in the midlands, smaller regions in the south and forest patches throughout KZN. Human impact variables contributed much less to the models than environmental variables and although the negative impact was mostly < 10%, the effect was widespread over ~60% of KZN for both species.
My results confirm that the caracal distribution range has expanded historically from the western highlands to the south coast of KZN and thus overlaps considerably with the blue duiker distribution range in the midlands and southern coastal forests. Although the proportion of blue duiker in caracal diet reported in studies elsewhere is low (5% or less), any new threat to a blue duiker population already under pressure from a variety of other threats, could lead to an irrecoverable decline. Thus further studies investigating the effects of the expanding caracal population on the diminishing blue duiker population and other vulnerable prey species are warranted.
ACKNOWLEDGEMENTS
I hereby acknowledge the following people for their invaluable contribution to my dissertation:
Associate Professor M. Corrie Schoeman of the University of KwaZulu-Natal (UKZN) for his supervision and encouragement;
Dr Roger Uys of Ezemvelo KZN Wildlife for providing the topic of this research and for his guidance and knowledge;
Members of the KwaZulu-Natal Conservancies Association for completing the surveys, submitting sightings and trail camera images;
The ecologists of Ezemvelo KZN Wildlife for completing the protected area surveys;
Dr Ian Little from Endangered Wildlife Trust Oribi Project for supplying caracal occurrence data and Dr David Everard from Sappi Environmental Management Department for supplying trail camera data;
Sharon Louw from Ezemvelo KZN Wildlife, Heike Zitzer from Pongola Private Reserve, Andrew Alcock from Mhlopeni Nature Reserve, Yvette Ehlers-Smith and Shane McPherson from UKZN for providing their trail camera data;
Krantzkloof Honorary Officers for assisting with my trail camera project in Kranzkloof Nature Reserve;
My friends, colleagues and family who are not quite sure why I am ‘still studying’, but nevertheless supported me over the years since I began this journey in 2001.
Dedication
In memory of my father who always believed in me and knew that I would achieve anything that I set my mind to do.
TABLE OF CONTENTS
Page
PREFACE ... ii
DECLARATION : PLAGIARISM ... iii
ABSTRACT ... iv
ACKNOWLEDGEMENTS ... v
TABLE OF CONTENTS ... vi
LIST OF TABLES ... viii
LIST OF FIGURES ... ix
CHAPTER 1: INTRODUCTION ... 1
1.1 Mesopredator release hypothesis ... 1
1.2 Ecology and range expansion of caracal ... 1
1.3 Ecology and range contraction of blue duiker ... 2
1.4 Risk of predation of blue duiker by caracal ... 4
1.5 Environmental niche modelling ... 5
1.6 Aims and objectives ... 7
CHAPTER 2: MATERIALS AND METHODS ... 8
2.1 Study area ... 8
2.2 Occurrence database ... 8
2.2.1 Ezemvelo biodiversity database... 9
2.2.2 Conservancy survey ... 9
2.2.3 Protected area survey ... 9
2.2.4 Additional surveys ... 9
2.2.5 Sightings data... 9
2.2.6 Data consolidation ... 10
2.3 Niche modelling ... 10
2.3.1 Maxent ... 10
2.3.2 Predictor variables ... 11
2.3.3 Maxent settings and threshold values ... 16
2.3.4 Model evaluation ... 16
2.3.5 Niche Overlap ... 16
CHAPTER 3: RESULTS ... 18
3.1 Occurrence database ... 18
3.2 Environmental ENMs... 20
3.2.1 Model evaluation ... 20
3.2.2 Environmental variables ... 21
3.2.3 Potential suitable habitat space ... 25
3.3 Human impact ENMs ... 28
3.4 Niche overlap ... 32
CHAPTER 4: DISCUSSION... 34
4.1 Environmental ENMs... 34
4.2 Human impact ENMs ... 36
4.3 Niche overlap ... 37
4.4 Conclusions and recommendations ... 37
REFERENCES ... 39
APPENDIX A: Survey Form ... 49
APPENDIX B: Duiker Identification Chart ... 52
APPENDIX C: Protected Area Survey ... 53
APPENDIX D: PrincipleComponentAnalysisResults ... 54
LIST OF TABLES
Table Page
Table 3.1. Sources of occurrence data with number of records before and after data consolidation ... 18 Table 3.2. ENM evaluation results ... 21 Table 3.3. Variable contributions and thresholds for the environmental and human impact ENMs... 22
LIST OF FIGURES
Figure Page
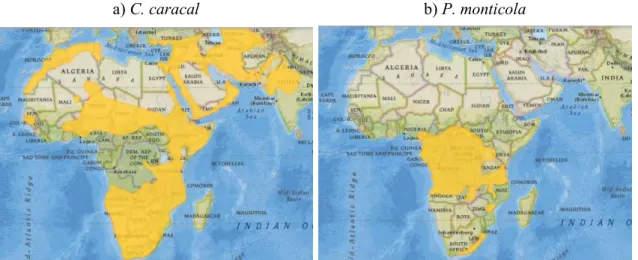
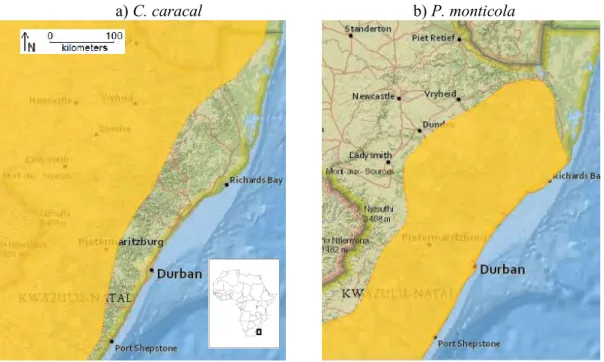
Figure 1.1. Global distribution of a) C. caracal and b) P. monticola according to the IUCN Red List assessment in 2008... 6 Figure 1.2. Distribution of a) C. caracal and b) P. monticola in KwaZulu-Natal, South Africa, according to the IUCN Red List assessment in 2008. Durban, the largest city, is located at 29.88°S, 31.05°E. ... 6 Figure 2.1. Spatial distribution of climate variables: a) to c) Principal Component Analysis scores derived from 19 Bioclim variables. d) to f) Variable associated with PC1-3. ... 13 Figure 2.2. Spatial distribution of a) altitude and b) KZN vegetation biome variables. ... 14 Figure 2.3. Spatial distribution of human impact variables a) human density and b) land use.
... 15 Figure 3.1. Map of surveys (including absence responses), historical data and sightings data collected against the half-degree grid of KwaZulu-Natal... 19 Figure 3.2. Occurrence data after data consolidation and spatial filtering. IUCN borders according to the IUCN Red List assessment 2008. ... 20 Figure 3.3. Response curves of the variables used in the environmental ENMs. ... 24 Figure 3.4. Probability of occurrence of C. caracal and P. monticola in KwaZulu-Natal estimated by Maxent, from low (0 blue) to high (1 red). a) Environmental ENMs, b) Human impact ENMs, c) The percentage difference between the human impact and environmental ENMs... 26 Figure 3.5. Potential suitable habitat space of a) C. caracal and b) P. monticola with suitability classified according to three logistic thresholds. c) Overlap of C. caracal and P.
monticola potential habitat space according to the 10 percentile (moderate suitability) and maximum training sensitivity plus specificity (high suitability) logistic thresholds. d) KZN vegetation biome in the high suitability overlap areas, 1 to 7 describes the key regions – see text for details. ... 27 Figure 3.6. Response curves of the variables used in the human impact ENMs. ... 31 Figure 3.7. Identity test results from the a) Environmental ENM and b)Human impact ENM niche overlap assessments showing that the niche overlap indices are high, yet significantly lower than overlap expected by chance (p < 0.01) for both D and I. ... 33
CHAPTER 1: INTRODUCTION
1.1 Mesopredator release hypothesis
Human activities related to urbanisation and agriculture over the past few centuries have resulted in fragmented, altered landscapes (Galvin & Reid 2008; Hobbs et al. 2008). These activities have also driven the large scale extermination of large terrestrial apex predators such as lions (Panthera leo) and wolves (Canis lupus) (Strong & Frank 2010). However, it is becoming increasingly apparent that apex predators play important roles in ecosystem function (Soulé et al. 2005). For example, apex predators directly suppress prey abundance, as well as smaller predators - mesopredators - through exploitation or interference competition (Glen et al. 2007; Berger & Gese 2007; Ritchie & Johnson 2009). The mesopredator release hypothesis proposes that the absence of apex predators may result in the population expansion of generalist mesopredators into new regions (Prugh et al. 2009). Case studies include the spread of red foxes (Vulpes vulpes) in Europe after the decline of the Eurasian lynx (Lynx lynx) (Elmhagen & Rushton 2007) and the spread of coyotes (Canis latrans) in America where wolves have been eradicated (Ripple et al. 2013). There is evidence that the increased numbers of mesopredators can impact negatively on prey populations, particularly indigenous, vulnerable prey species; for example non-native coyotes and an endemic marmot (Marmota olympus) (Witczuk 2003), and invasive red foxes and an endangered mouse (Notomys fuscus) (Letnic & Dworjanyn 2011). In Africa there have been studies on apex - mesopredator dynamics of canids and their prey (Yarnell et al. 2013;
Bagniewska & Kamler 2014), however this is the first study to investigate the expansion of an African felid mesopredator, and the potential impact on a vulnerable ungulate prey species.
A mesopredator can be defined as any middle ranking predator in a food web. There can be multiple mesopredators in an ecosystem and a predator species could be an apex predator in one ecosystem and a mesopredator in another (Prugh et al. 2009). In the African carnivore context, apex predators are those typically larger than 20 kilograms (Mills 1991) and mesopredators smaller than 20 kilograms (Caro & Stoner 2003). In South Africa, mesopredators in this category include the African Civet (Civettictis civetta), black-backed jackal (Canis mesomelas), side-striped jackal (Canis adustus), aardwolf (Proteles cristatus), honey badger (Mellivora capensis), caracal (Caracal caracal, Schreber, 1776) and serval (Leptailurus serval). The most widespread and common mesopredators are black-backed jackals and caracals (Skinner & Chimimba 2005; Bothma 2012). Outside of protected areas many of these mesopredators are now the apex predator in the food web due to the extermination of the large apex predators, although still referred to as ‘mesopredators’ from the alternative definition, meaning ‘medium sized’ predators.
1.2 Ecology and range expansion of caracal
Caracals are a common medium sized felid (weighing an average of 14 kg) occurring in Africa and Asia. Although their numbers are declining in their north African and Asian ranges, caracals are widespread and prevalent in sub-Saharan Africa, except for the equatorial forest belt (Fig. 1.1a) (Ray, Hunter & Zigouris 2005; Breitenmoser-Wursten, Henschel &
Sogbohossou 2008). Caracals are listed as “Least Concern” globally on the IUCN (International Union for Conservation of Nature) Red List (Breitenmoser-Wursten et al.
2008) as well as in South Africa (Friedman & Daly 2004). In South Africa caracals can be destroyed with or without permits (legislation varies per province) as they are classified as a Damage Causing Animal (Cape Nature 2013).
Data on the distribution, biology and ecology of caracal have been summarised in numerous publications on African carnivores and mammals (e.g. Bothma & Walker 1999; Skinner &
Chimimba 2005; Wilson & Mittermeier 2009; Estes 2012a; Stuart & Stuart 2013). These generalist carnivores are found in most habitat types from dry mountainous regions to humid coastal forests, yet commonly occur in semi-arid landscapes that include some form of cover such as trees, bush or rocks (Sunquist & Sunquist 2002). Caracals are opportunist feeders that hunt the most abundant prey, primarily rodents and birds, and are quite capable of catching large antelope prey up to twice their own weight (Avenant & Nel 2002; Melville, Bothma &
Mills 2004; Braczkowski et al. 2012a). They will also hunt poultry and livestock (Farhadinia et al. 2007; Avenant & Du Plessis 2008; Bothma 2012) and are considered one of the top nine felid species in terms of human-felid conflict globally (Inskip & Zimmermann 2009). Most of the studies on caracal in South Africa have taken place in the former Cape Province during the 1980s with a focus on diet (Du Plessis 2013) to address their status as a ‘problem’
predator.
In southern Africa the caracal occurs widely. Territory sizes range from < 10 km2 for females in prey-rich habitats (Moolman 1986; Avenant & Nel 1998) to > 300 km2 for males in prey- poor habitats (Bothma & Le Riche 1994; Marker & Dickman 2005). Populations have increased in numbers and distribution range (Lensing & Joubert 1976; Stuart & Wilson 1988), particularly in the southern and western Cape of South Africa (Pringle & Pringle 1979; Stuart 1981; Stuart & Wilson 1988). This population increase has been linked to the historical extermination of large predators in the region, specifically the lion, leopard (Panthera pardus) and spotted hyena (Crocuta crocuta) (Stuart 1981; Stuart & Wilson 1988; Skinner & Smithers 1990; Ray et al. 2005), and later the strict control of the sympatric, competitive mesopredator;
the black-backed jackal (Pringle & Pringle 1979; Rautenbach 1982; Stuart & Wilson 1988).
Generalist predators such as the caracal have high intrinsic growth rates which together with competitive release can lead to increased numbers (Lozano et al. 2013). Additionally, year round food supply of livestock and rodents in agricultural lands (Mukherjee et al. 2004;
Melville & Bothma 2006; Elmhagen & Rushton 2007) can lead to an increase in breeding frequency (Bernard & Stuart 1987) allowing the caracal to persist in spite of high levels of persecution (Bothma 2012; Bailey & Conradie 2013). Finally, caracals can disperse long distances to colonise vacant territories (Norton & Lawson 1985; Van Heezik & Seddon 1998;
Marker & Dickman 2005) and thus negate the effectiveness of removal programs (Marker &
Dickman 2005; Bailey & Conradie 2013).
Prior to the 1980s caracal distribution did not extend to the eastern coastal regions of South Africa (Roberts 1954; Visser 1976; Rowe-Rowe 1978; Smithers 1983) and it was reported as
‘absent from most of Natal and Zululand’ (now KwaZulu-Natal) occurring marginally in the western drier highlands (Stuart and Wilson, 1988; Stuart, 1984). During the 1990s it appeared that the caracal had expanded into the moist upland grasslands (Skinner & Smithers 1990;
Rowe-Rowe 1992a; Nowell & Jackson 1996) and by 2005 to the midlands region (Skinner &
Chimimba 2005; Breitenmoser-Wursten et al. 2008). Notably, by the 1990s apex predators such as spotted hyena, lion, leopard and cheetah (Acinonyx jubatus) had largely been exterminated and confined to game reserves in the northern savanna (Rowe-Rowe 1992a;
Hunter 2007) thus creating conditions for mesopredator release. However, the extent of the spread of caracal, and the potential impact on vulnerable prey species in KwaZulu-Natal such as the blue duiker has not yet been quantified.
1.3 Ecology and range contraction of blue duiker
Blue duiker (tribe Cephalophini, Philantomba monticola, Thunberg, 1789) are the smallest of the 19 species of duiker occurring in Africa weighing an average of 4 kg (Wilson 2005; Estes
in Central Africa extending into west and east Africa, but are rare in southern Africa and only occur in fragmented populations in the eastern coastal forests (Fig. 1.1b) (IUCN SSC Antelope Specialist Group 2008; Estes 2012b; Hart & Kingdon 2013). Blue duiker is listed as
“Least Concern” globally on the IUCN Red List with an estimated population of over seven million (IUCN SSC Antelope Specialist Group 2008) but in South Africa they are listed as
“Vulnerable” (Friedman & Daly 2004; Venter et al. 2015) and are included on the Threatened or Protected Species List in Section 56 of the National Environmental Management:
Biodiversity Act, 2004 (Act No. 10 of 2004).
Blue duikers are territorial, specialist forest dwellers, foraging only on certain fruits and leaves (Bowland & Perrin 1998; Molloy & Hart 2002; Estes 2012b; Hart & Kingdon 2013).
Densities in the central African rainforests can reach up to 22.5 animals per 100 ha (Nakashima, Inoue & Akomo-Okoue 2013) and similar densities - up to 19.9 per 100 ha – were found in the forests of the southern Cape, South Africa (Hanekom & Wilson 1991;
Seydack, Huisamen & Kok 1998). By contrast, higher densities were estimated in coastal lowland forests of KwaZulu-Natal, South Africa; from 144 to 320 animals per 100 ha (Bowland & Perrin 1994) with an average territory size of 0.7 ha for a pair of blue duiker (Bowland & Perrin 1995). It appears that in spite of many threats and high levels of disturbance (Vanthomme et al. 2013), the blue duiker persists where there is suitable habitat, likely due to its small size, cryptic nature and ability to ensure the survival of their young (Estes 2012b). In Central Africa blue duikers are known to survive well in the large tropical forests despite increased poaching for the bush meat trade (Lwanga 2006; Mockrin 2010;
Viquerat et al. 2012).
In South Africa blue duiker are often the only antelope remaining in small patches of forests.
Twenty years ago Rowe-Rowe (1994) estimated ca. 2200 blue duiker in 60 sub-populations in KwaZulu-Natal. In 2004 the Red Data Book of the Mammals of South Africa (Friedman &
Daly 2004) estimated ca. 20% loss of blue duiker habitat between 1999-2004 due to deforestation, habitat modification, coastal developments, clearing of thickets and agriculture.
Habitat quality was further reduced due to understory changes and grazing impacts. Estimated total blue duiker population of South Africa numbered less than 10 000 with less than 2500 adults, distributed in 30 sub-populations across the Eastern Cape and KwaZulu-Natal, with a predicted 10% decline in the following five years. A decade later the blue duiker national assessment reported a suspected decline (Venter et al. 2015), however due to lack of surveys the assessment could only estimate similar numbers as reported in 2004. Blue duiker in South Africa are vulnerable to a number of threats including habitat loss, climate change, alien invasive plants, feral and domestic dogs, poaching, human disturbance, disease and inbreeding (Rowe-Rowe 1992b; Friedman & Daly 2004; Venter et al. 2015).
One of the main causes of the decline in blue duiker population numbers is forest fragmentation (Venter et al. 2015). Forests in South Africa are naturally fragmented, however patch sizes have become smaller due to human activities (Berliner 2005). Berliner (2009) estimated a total of 16171 forest patches with a mean size of 30.4 ha; 36% were smaller than 10 ha, 80% smaller than 50 ha and only 5% larger than 100 ha. Berliner (2009) also identified 3016 clusters where forest patches were closer than 1 km from each other and the overall cluster size was greater than 50 ha. Clusters are important for forest species that can only disperse over very short distances (Lawes, Mealin & Piper 2000). Small and isolated forest patches can only support small populations of plants and animals. Small populations are vulnerable to demographic and environmental stochasticity and genetic problems (Melbourne
& Hastings 2008). Additionally, demographic heterogeneity can result in abiotic factors such as climate, or biotic factors such as predation, that would have little effect in large populations to be catastrophic in small, isolated populations (Kendall & Fox 2002). In unfragmented landscapes declining populations can be "rescued" by immigration from a nearby population.
In fragmented landscapes, the distance between fragments may be too large hence preventing this from happening (Hanski 1999). Further, the urban or rural landscape surrounding fragments may function as a barrier where isolated fragments are less likely to be repopulated than adjoining fragments. The blue duiker’s limited ability to disperse and find forest refuges may severely affect their persistence (Lawes et al. 2000). Moreover, there is evidence that prey populations isolated in fragments may be particularly vulnerable to predation from expanding mesopredator populations (Witczuk 2003; Letnic & Dworjanyn 2011).
1.4 Risk of predation of blue duiker by caracal
Natural predators of blue duiker include spotted hyena, wild dogs (Lycaon pictus), African golden cats (Caracal aurata), leopards, crocodiles (Crocodylus niloticus), baboons (Papio spp.), pythons (Python sebae), civets, crowned eagles (Stephanoaetus coronatus) and monitor lizards (Varanus spp.) (Wilson 2005; Hart & Kingdon 2013). Regarding felid predators, small forest duiker are the African golden cat’s second most important prey category after rodents (Bahaa-el-din et al. 2015) and blue duiker were reported in 25% of African golden cat scats and in 12.2% of leopard scats in a forest in Zaire (Hart, Katembo & Punga 1996), and in 23.5% of African golden cat scats and 23.3% of leopard scats in a forest in the Central African Republic (Ray and Sunquist, 2001). Although the caracal and the African golden cat are closely related and similar sized, they occur in mutually exclusive habitats in Central Africa (savanna versus forests, respectively), and no reports were found of forest duiker in caracal diet in this region.
In South Africa natural predators of blue duiker are primarily mongoose (family Herpestidae), pythons and forest raptors (Skinner & Chimimba 2005). Felids are not listed as common predators of blue duiker in South Africa, yet blue duiker has been reported in felid diet in the forests of the Eastern Cape. The relative frequency of occurrence of blue duiker in caracal and leopard diet from studies in the Cape was 5% and 20%, respectively, in the Tsitsikamma National Park (Hanekom & Wilson 1991), and 1.6% and 6.3%, respectively, in the southern Cape (Braczkowski et al. 2012a; b). A study in the Eastern Cape reported 2.4% blue duiker in caracal scats (Stuart and Hickman, 1991). Even though forests are not common habitat for caracal, they are known to utilise forest edges as cover to rest during the day (Sunquist &
Sunquist 2002). Caracals, with their opportunist, adaptable habits, often switch prey during times of low abundance of preferred prey (Avenant & Nel 2002; Melville et al. 2004) or to avoid other threats in their preferred habitat. Even a small percentage increase in predation by caracals switching to forest prey could cause a small blue duiker population, already under pressure from many other threats, to start or accelerate a decline (Dr Roger Uys, Ezemvelo KZN Wildlife, pers. comm., 2011). Crawford & Robinson (1984) suggested that the increase in caracal abundance together with increased poaching may have been responsible for a dramatic decline in blue duiker populations in the Eastern Cape forests during the 1940s.
However, Hanekom and Wilson (1991) countered that the drought conditions and consequent poor habitat conditions in the 1940s may have had more of an impact on the blue duiker decline than caracal predation. Although caracal numbers appeared to wane after the drought, blue duiker numbers only recovered once the forests were legally protected and anti-poaching measures were introduced in the late 1960s (Crawford & Robinson 1984). Subsequent long term monitoring of blue duiker in the region have indicated a sharp decline from 1970 to 1980 (from a density of 19.90 animals per 100 ha to zero in Diepwalle state forest) and densities have remained low (0.45 animals per 100 ha in Diepwalle in 1997) (Seydack et al. 1998). The blue duiker decline was also noted in other South African forests and linked to possible climate change factors affecting nutrient carbon ratios in plant tissues that were not favourable for blue duiker (Seydack & Huisamen 2000).
Distribution accounts of caracal and blue duiker in KwaZulu-Natal during the 1980’s (Smithers 1983; Howard & Marchant 1984) suggest that there was very little geographic overlap between the two species; caracal occurred marginally in the western drier highlands and the blue duiker in the midlands and lower humid eastern coastal forests. However, Rowe- Rowe’s (1992a, 1994) detailed distribution maps of KwaZulu-Natal’s wildlife species in the early 1990’s show that the caracal’s distribution range overlaps with the blue duiker’s range in the midlands towards the south coast and Rowe-Rowe (1992a) stated there had been a noticeable increase in caracal range since the late 1970’s. This pattern of overlap is replicated in the IUCN Red List distribution maps version 2011.1 (Fig. 1.2) (Breitenmoser-Wursten et al. 2008; IUCN SSC Antelope Specialist Group 2008). Essentially, Rowe-Rowe’s maps (1992a, 1994) are the most recent maps of potential caracal and blue duiker distribution in KwaZulu-Natal. Since 2000 the provincial conservation authorities have recorded sightings of caracal from the lower midlands to locations very close to the coastal strip (Ezemvelo KZN Wildlife Biodiversity Database, unpubl. data, 2011). At the same time there have been reported marked declines in blue duiker populations in the midlands and coastal forests (Dr Roger Uys and Dr Athol Marchant, Ezemvelo KZN Wildlife, pers. comm., 2011).
If the caracal and blue duiker’s geographic ranges overlap in KwaZulu-Natal, there may be an increased probability of encounters between these two species in KwaZulu-Natal forests.
Further, the blue duiker falls within the types and size range of caracal prey species, and there is some evidence from the Eastern Cape that caracal do prey on blue duiker in forests.
Consequently, conservation ecologists suspect that, in addition to the many other threats faced by blue duiker, the spread of caracal may be playing a significant role in local extinctions of blue duiker populations in KwaZulu-Natal (Dr Roger Uys, Ezemvelo KZN Wildlife, pers.
comm., 2011). However, before assessing interactions at a local scale between these two species, quantitative data on their current distribution ranges, and potential overlap in habitat space are necessary.
1.5 Environmental niche modelling
Ideally, occurrence data of species should be obtained by systematically surveying a region with a constant sampling effort at study sites or grid cells. The process is very labour intensive requiring considerable manpower and can take a few years to complete, particularly at broad spatial scales. Species’ ranges are often demarcated by drawing a polygon around known occurrence points to generate maps reminiscent of field guides (e.g. Smithers 1983;
Skinner & Chimimba 2005). To determine the most likely habitats where a species occurs, occurrence data and/or distribution maps were compared with mapped bioclimatic regions (Lloyd & Millar 1983; Howard & Marchant 1984). In the last few decades, advances in information technology and remote sensing have accelerated the development of mapping tools, and increased access to global climatic datasets. Additionally, sophisticated niche modelling tools have been developed that can manipulate occurrence and environmental data over large regions (Elith & Leathwick 2009).
a) C. caracal b) P. monticola
Figure 1.1. Global distribution of a) C. caracal and b) P. monticola according to the IUCN Red List assessment in 2008.
a) C. caracal b) P. monticola
Figure 1.2. Distribution of a) C. caracal and b) P. monticola in KwaZulu-Natal, South Africa, according to the IUCN Red List assessment in 2008. Durban, the largest city, is located at 29.88°S, 31.05°E.
Environmental niche models (ENMs), also known as species distribution models, climate envelopes and ecological niche models (Elith & Leathwick 2009; Warren 2012) are correlative, spatial methods that combine species occurrence data with associated environmental data to predict the potential habitat suitability for species in geographic space (Franklin 2009; Elith & Leathwick 2009; Warren & Seifert 2011; Anderson 2013). The resultant maps are essentially statistically derived thresholds that indicate areas of high suitability probability (Phillips, Anderson & Schapire 2006; Elith et al. 2011).
Predictor variables of ENMs are usually coarse scale scenopoetic (abiotic, non-interactive, non-consumable) variables such as climatic and topographical variables, as opposed to fine scale bionomic (biotic, interacting, consumable) variables (Soberoń 2007; Anderson 2013).
Scenopoetic variables define the Grinnellian niche axiom as they mediate the broad distributional limits of species. By contrast, bionomic variables such as dispersal and predator-prey dynamics have more influence on the Eltonian niche and local species assembly (Soberoń 2007). Nevertheless these bionomic variables may preclude a species from occurring in all the abiotically suitable locations and may even be correlated with occurrence data in a particular region. This may therefore be an important consideration in transferable ENMs (Anderson 2013). Besides estimating habitat suitability of occupied regions (interpolation) and species’ niche (Warren & Seifert 2011), ENMs can also be transferred across space and time to predict habitat suitability in areas of unknown occurrence or environmental change (extrapolation). ENMs have been used to address important questions in ecology and conservation biology across many taxa and environments (Elith & Leathwick 2009). Examples include predator-prey interactions (Aragón & Sánchez-Fernández 2013;
Kunkel et al. 2013) and identifying suitable habitat to protect rare endemic species (Wilting et al. 2010; Chunco et al. 2013).
1.6 Aims and objectives
The aim of this study was to determine the similarity in Grinnellian niches between caracal and blue duiker to evaluate the potential role of caracal in the reported decline of blue duiker populations in KwaZulu-Natal, South Africa.
The objectives were to:
1. Compile baseline occurrence databases for caracal and blue duiker based on (i) historical data from Ezemvelo KZN Wildlife, (ii) current data from electronic surveys conducted among the KwaZulu-Natal conservancies and protected areas, and (iii) additional reliable sources of occurrence data.
2. Map the potential suitable habitat space of caracal and blue duiker in KwaZulu-Natal using ENMs informed by compiled occurrence data (see #1 above) and (i) environmental variables including climate, altitude and vegetation, and (ii) environmental and human impact variables including human density and land use.
3. Quantify the niche overlap by calculating two ENM overlap indices – Hellinger’s based I and Schoener’s D – for the caracal and blue duiker potential habitat suitability maps, and compare the observed I and D overlap values to 1000 expected I and D overlap values using null models.
This study tests the following hypotheses:
1. If there has been a recent release of range of the caracal as mesopredator, suitable habitat space should be greater than the previously estimated range of the caracal in KwaZulu-Natal (Rowe-Rowe 1992a).
2. If current caracal and blue duiker distributions increase their likelihood of encounters as predators-prey, Grinnellian niches of the caracal and blue duiker should be predicted by similar variables in ENMs and exhibit statistically significant ecological similarity.
3. If human impact has a strong effect on potential suitable habitat space, ENMs using both environmental variables and human impact variables should have higher model accuracy than ENMs based exclusively on environmental variables.
CHAPTER 2: MATERIALS AND METHODS
2.1 Study area
KwaZulu-Natal (KZN, 94 361 km2) is the most easterly province of South Africa, located between 26.5°S - 31.5°S and 28°E - 33°E, covering 35 half-degree cells of land (Fig. 3.1).
Altitude ranges from sea level along the east coast to over 3000 m in the western Drakensberg mountain range, in a very short distance of 160 - 200 km. The climate varies from subtropical humid hot summers and dry warm winters along the coast to drier and cooler conditions in the higher inland regions (Schulze 1997). Annual mean rainfall is 845 mm and annual mean temperature is 21 °C along the coast and 17 °C inland (Schulze 1997). KZN is the only province in South Africa not considered water scarce, with 24 free-flowing rivers within a network of 18400 km of perennial and ephemeral rivers (Rivers-Moore & Goodman 2007).
The vegetation of KZN comprises four of the seven major biomes of South Africa - an eastern subtropical coastal biome (Indian Ocean coastal belt) at sea level, a central savanna, a western upland grassland biome and a fragmented forest biome dotted across the province (Mucina &
Rutherford 2006). Indigenous forest patches cover only two percent of KZN and range from 25 ha to 10000 ha (Berliner 2005; Scott-Shaw & Escott 2011), however 80% of the patches are less than 300 ha (A. L. Jones unpublished data). South African forests can be classified into 20 zonal and intra-zonal forest types, and four azonal types (riverine, swamp, mangrove and sand forest) with ten of these forest types occurring in KZN (von Maltitz 2003).
The subtropical conditions and varied topography favours high productivity and biodiversity and KZN falls within the internationally declared Maputaland-Pondoland-Albany biodiversity hotspots (Conservation International & SANBI 2010). Mammal species richness in KZN was analysed by bioregion in 1996 (Rowe-Rowe & Taylor 1996) and the five largest orders were Chiroptera (n = 36 species), Carnivora (n = 32 species), Rodentia (n = 30 species), Artiodactlya (n = 29 species) and the former Insectivora (n = 18 species) for a total of 162 mammal species. In summary, mammalian predators and their prey are diverse and relatively abundant in this region (Rowe-Rowe 1992a, 1994; Taylor 1998).
Many well-known large provincial and private game reserves occur in the north eastern savanna of KZN such as Hluhluwe-iMfolozi Park, Zululand Rhino Reserve and Phinda Private Game Reserve bordering with uMkhuze Game Reserve. These reserves support mega herbivores and apex predators such as lion, hyena and cheetah, some of which have been introduced (Rowe-Rowe 1992a, 1994; Hunter 2007). Scattered around the rest of the province are numerous smaller protected areas totalling 110 reserves covering 8.1% of KZN (Ezemvelo KZN Wildlife 2008). These reserves provide secure habitat for the lesser herbivores (like the blue duiker) and smaller predators (like the caracal), although many of the smaller wildlife species also occur outside of protected areas on private and communal lands (Rowe-Rowe & Taylor 1996; Jewitt et al. 2015).
2.2 Occurrence database
I compiled occurrence databases for caracal and blue duiker using: (i) data from the Ezemvelo KZN Wildlife (Ezemvelo) biodiversity database; (ii) current survey data from KZN conservancies and (iii) Ezemvelo protected areas; (iv) additional surveys in half degree cells that lacked data from ii and iii; and (v) sightings from the public. Collecting data from a
variety of sources helps minimise sampling bias that may be present in any individual data set.
2.2.1 Ezemvelo biodiversity database
The Ezemvelo biodiversity database (Ezemvelo KZN Wildlife Biodiversity Database unpubl.
data 2011) contained 73 records for caracal (going back to 1976) and 136 records for blue duiker (going back to 1919). There were fewer than 25 records for each species since 2000 and some of these were at or near the same location, hence this data set was classified as
‘historical’.
2.2.2 Conservancy survey
In 2009 there were 128 registered, active conservancies (National Association of Conservancies and Stewardship of South Africa 2012) spread across the entire province in rural and urban areas (Thomson 2009). Many members of conservancies are current or retired experienced practitioners in conservation and environmental fields, therefore I considered conservancy members as a relevant, willing, widespread and informed group of people to respond to my survey. The conservancy survey was conducted during 2012 using the conservancy member contact list provided by the KwaZulu-Natal Conservancies Association (KZNCA). I sent the survey by email to each conservancy as this was the most cost effective method, with follow ups by telephone if there was no response to three emails sent a week apart. The survey (Appendix A) format was based partly on a private landowner survey on mammals conducted by the Natal Parks Board in 1984 (Howard & Marchant 1984). The survey asked to indicate which of the following species had been seen in the conservancy over the past five years (since 2007): a) mesopredators (caracal, serval, leopard, jackal, feral dog) and b) duiker (blue, red (Cephalophus natalensis) and grey (Sylvicapra grimmia)), and whether populations seem to be increasing, decreasing, stable or unknown. Although most conservancy members are very familiar with local wildlife, the survey directed respondents to www.arkive.org, a global internet database of species images, and included a chart describing the three duiker species in detail (Appendix B). A few of the larger conservancies sent the surveys to their members, or sent me the list of their members to contact; in which case I combined member responses into one response for that conservancy. To achieve a good survey response rate, I found it was very important to be in direct contact with individual conservancy representatives and to send personal reminders.
2.2.3 Protected area survey
Dr Roger Uys, Ezemvelo ecologist and collaborator on this project, arranged permission to conduct a protected areas survey which took place during the first half of 2013. The survey questions were summarised against a list of the protected areas (Appendix C) and sent to each of the Ezemvelo regional ecologists to complete.
2.2.4 Additional surveys
I also attempted to obtain occurrence records for half-degree cells which lacked historical, conservancy or protected area survey data. Fifty survey forms were placed at random in post boxes in Ingwavuma in the north-eastern Umkhanyakuda District and Utrecht in the north- western Amajuba district using the Infomail service. I also placed a classified advert in November 2013 in Newcastle and Ladysmith newspapers, which are fairly large towns in the north-western Amajuba district. Additionally, I sent survey forms to private reserves, state forests, natural heritage sites and stewardship sites (Ezemvelo KZN Wildlife Biodiversity Database unpubl. data 2013) located in cells with three or fewer received surveys.
2.2.5 Sightings data
The sightings data were collected from a number of external sources that had verified sighting data available and also from current sightings reported by reliable sources directly to me. The external sources included the Endangered Wildlife Trust Oribi Project, University of Cape Town’s Mammal Map database, Sappi Environmental Management Department and trail
camera projects. When numerous records were received for the same location (for example from a trail camera) I extracted only the latest records.
Caracal are quite difficult to confuse with other wild animals, except perhaps large tan coloured dogs of similar size. Blue duiker sightings can be misidentified if the observer is not aware or familiar with the three duiker species found in southern Africa or they can be confused with small black or brown coloured dogs, especially in a dark forest setting.
However, most sightings records were accompanied by photographs and thus could be verified. Although I also received photographs of felid scats and tracks, it is very difficult to accurately identify these to caracal, serval or leopard and therefore I did not include these data in the database.
2.2.6 Data consolidation
I removed duplicates and very coarse spatial data at quarter degree grid scale from the occurrence database and records older than 1990 from the historical data set. I added an accuracy field of 2.5 km intervals to all records and calculated the spatial accuracy of centroid and grid based co-ordinates, which is related to the area of the location or cell. All records were accurate to 12.5 km or less. Cells along the coast and borders of the province were included if at least half the cell’s land area was within the provincial boundary of KZN.
ArcGIS v.9.3 (ESRI, Redlands, CA, USA) was used to map boundaries, calculate centroids and map the occurrence data from all sources. QGIS v2.0 (QGIS Development Team 2013) was used to filter and consolidate data.
To control for potential uneven sampling effort and ensure that the data are spatially independent from each other, I spatially filtered occurrence records by selecting one record within a radius of 10 km (Kramer-Schadt et al. 2013; Boria et al. 2014). I selected the most central point, or in the case of a few equidistant points, the most recent point.
2.3 Niche modelling 2.3.1 Maxent
The potential suitable habitat space of caracal and blue duiker in KZN was mapped using the environmental niche model (ENM) software Maxent (version 3.3.3e); (Phillips et al. 2006;
Phillips & Dudík 2008; Warren 2012). Maxent uses presence only data and has proven to be a reliable ENM tool compared to other models (Phillips et al. 2006; Elith et al. 2011), particularly for > 50 presence records because model accuracy improves with increased sample sizes (Hernandez et al. 2006; Wisz et al. 2008; Feeley & Silman 2011). Maxent calculates the potential habitat suitability value (between 0 and 1) of each grid cell in the study area using occurrence points of the focal species and the contribution of multiple environmental variables that are presumed important. A random set of training data from the set of occurrence points is used to calculate the model and the remaining points are used to test the model. Different threshold values are produced that can be used to delineate areas according to the degree of habitat suitability (for example unsuitable - suitable or low - medium - high suitability).
The background geographic area (extent) and the resolution of the variables are two important spatial aspects that can influence the outcome of ENMs (Guisan & Thuiller 2005; Lauzeral, Grenouillet & Brosse 2013). I defined the extent of this study as the area for which I collated occurrence data (Section 2.2), i.e. KZN. The KZN region is a subset of both the total South African distribution of caracal (most of the country) and of the blue duiker (extends southwards into the Eastern Cape province). However, using an extent that is too large, for
oversimplify the models and reduce model performance (VanDerWal et al. 2009). Moreover, being based on only a subset of the full range, this model is not suitable to transfer across space or time. However, in non-transferable models any potential biases from correlations with non-abiotic factors in the occurrence data are acceptable and in fact likely made the model more realistic in terms of the objectives of this study (Anderson 2013).
The most suitable resolution of the ENM is dependent on the resolution of the available environmental variables, the study species, the size of the study area and the resolution of the occurrence data (Franklin 2009; Elith & Leathwick 2009). The resolution used in carnivore ENMs is usually based on the average or smallest home range size of the species being studied, for example Iberian lynx (Lynx pardinus) - average of 4.1 km2 (Fernández, Delibes &
Palomares 2006); flat-headed cat (Prionailurus planiceps) - average of similar small cats 4 km2 (Wilting et al. 2010); puma (Puma concolor) - smallest 75 km2 (LaRue & Nielsen 2011) and leopard - smallest 10 km2 (Swanepoel et al. 2013). Caracal home range sizes vary from 5.5 km2 to 65 km2 (Sunquist & Sunquist 2002; Bothma 2012). However, blue duiker home ranges are less than 1 ha per pair (Bowland 1990). Preliminary analyses revealed that aggregating vegetation data into coarser than 1 km2 (closer to caracal home range sizes) cells absorbed the small forest patches (important blue duiker habitat type) in KZN into other non- forest types. The scale of 30 m2 (closer to blue duiker home range sizes) was too fine in relation to the large extent of the background region (94 361 km2) and the relatively coarse occurrence data (0 to 12.5 km). Thus I selected the resolution of 1 km2 (30 seconds) as the most suitable scale for ENMs and all the input variables were converted to this resolution.
Sampling bias is an important factor to consider in ENMs. Ideally, occurrence data should be a systematic, representative random sample (Phillips et al. 2009). When occurrence data is collected from a variety of sources, over-sampled areas can result in environmental bias and thus overfitting of models (Kramer-Schadt et al. 2013; Boria et al. 2014). The initial conservancy survey responses were closely associated with the main highway routes, which were also the regions with higher human density. However, when the other surveys and sources of occurrence data were added, this pattern dissolved. The final occurrence data set culminated in at least one response for all 35 half-degree cells across KZN in the case of blue duiker and for 32 cells in the case of caracal, thus I assumed that the risk of sampling bias in the final data set was minimal. The three half-degree cells, where there were no sources for caracal occurrence data, were excluded from the background area of the caracal models using the bias grid feature. A Nearest Neighbour Index was run in QGIS on the occurrence data which compares a Z score to measure randomness at 95% ± 1.96. The Z score was -2.83 for blue duiker and +2.21 for caracal, indicating that occurrence data were close to random, with blue duiker data more clustered (< 1) and caracal data more dispersed (> 1).
2.3.2 Predictor variables
I used two sets of predictor variables for the ENMs: i) an environmental set representing natural conditions and ii) a human impact set to assess the possible influence of anthropogenic factors. The environmental set comprised three climatic variables, one topographical and one vegetation variable and the human impact set included the environmental set as well as human density and land use.
The three climate variables were derived from 19 bioclimatic variables available from WorldClim – Global Climate Data database (Version 1.4 Release 3) at http://www.worldclim.org/bioclim (Hijmans et al. 2005). Four tiles for each variable at the 30 second (1 km2) resolution from the southern African region were downloaded, merged and cut in DIVA-GIS v7.5 (Hijmans, Guarino & Mathur 2011) to a 5 x 5 degree grid 26.5°S – 31.5°S and 28°E – 33°E covering the KZN province (Ascii parameters: x = 27.9916, y = -31.4979;
591 columns x 601 rows and cell size 0.00833). Climate variables in southern Africa are
highly correlated (Schoeman et al. 2013) therefore a Principle Component Analysis (PCA) was performed on the 19 climate variables using the raster package in R v3.02 (R Development Core Team 2011). The first three components explained 91.6% of the variation.
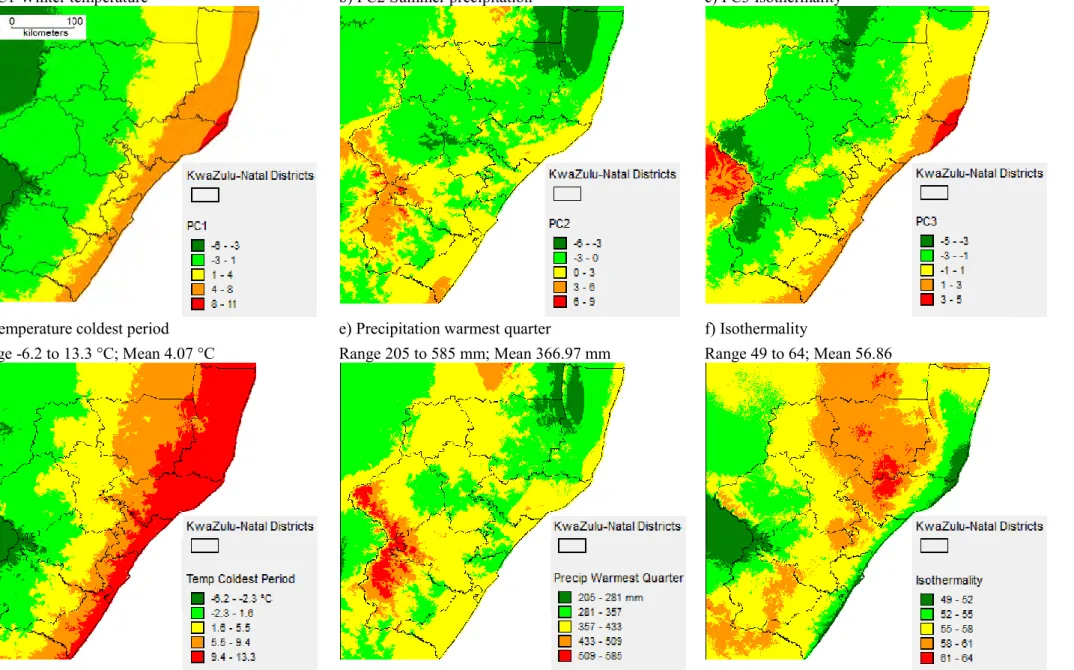
I interpreted the principal components as follows: PC1 (named winter temperature; 53.5%) – depicted cold and dry winter months (temperature of the coldest and and driest periods loaded high); PC2 (named summer precipitation; 24%) represented wet and warm summer months (precipitation of the warmest and wettest periods loaded high) and PC3 (named isothermality;
14%) – depicted climate stability (isothermality and precipitation seasonality loaded high) (Appendix D; Fig. 2.1a,b,c). It could be argued that principal components are statistical values and therefore difficult to interpret. Therefore I also ran ENMs with a set of climate variables that contributed the most to each component (Lobo & Tognelli 2011; Feilhauer, He
& Rocchini 2012): PC1 – minimum temperature coldest period (Bio6); PC2 – precipitation warmest quarter (Bio18) and PC3 – isothermality (Bio3) (Fig. 2.1d,e,f) and used the response curves of these variables for interpretation.
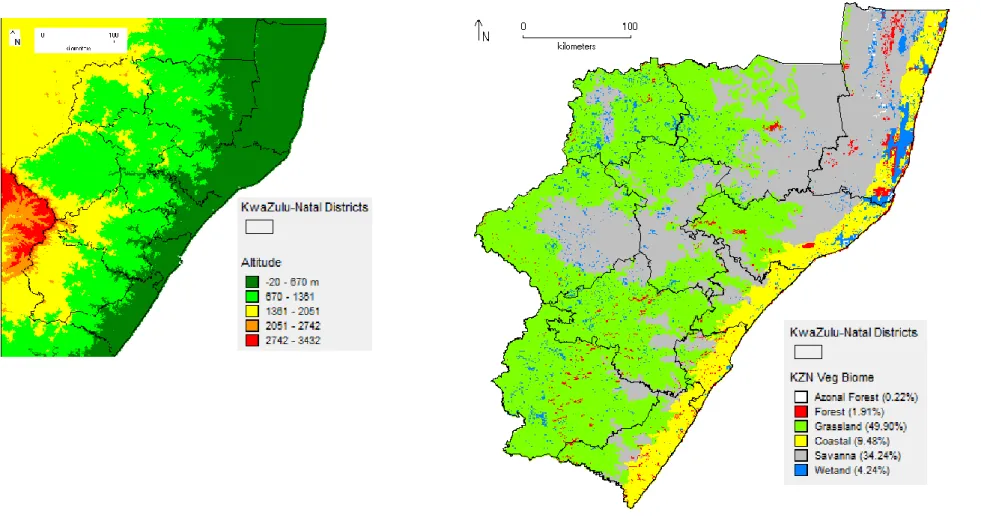
Although altitude is correlated with temperature (Anderson 2013), I included this variable (http://www.worldclim.org/bioclim; Fig. 2.2a) in ENMs because the topography of KZN is very varied and the gradient rises steeply in a short distance as described in Section 2.1.
Preliminary tests showed that altitude was the third most important variable for the caracal models and more important than temperature.
The vegetation variable (Fig. 2.2b) was sourced from Ezemvelo’s vegetation mapping database (Scott-Shaw & Escott 2011) which covers only the KZN province. The database included three different classifications: South Africa vegetation group (14 categories), KZN vegetation type (68 categories) and KZN vegetation biome (6 categories). To select the most suitable vegetation classification layer I performed preliminary tests on each classification, as well as on classifications from the vegetation map layer for South Africa (SANBI 2006). I selected the KZN vegetation biome (KZN veg biome) classification because the data were the most recent and complete (especially regarding forest patches). The six biome categories covered KZN in the following proportions: grassland (49.9%), savanna (34.24%) coastal (9.48%), wetland (4.24%), forest (1.91%) and azonal forest (mangroves, swamp & riverine) (0.22%).
The source of the human density layer (Fig. 2.3a) was the South African census (Statistics South Africa 2011) which ranged from 0 to 13 070 people per km2 with an average of 111 per km2 across the province. There were fewer than 100 people per km2 in 82% of KZN and between 100 to 1000 people per km2 in 16% of KZN mainly along the coastal strip. Higher densities were in and around the three main cities; Durban at the mid-coast, Pietermaritzburg located about 100 km inland west from Durban and Newcastle in the north-west.
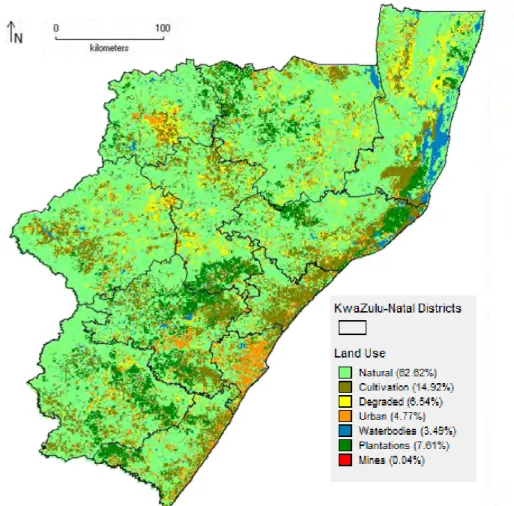
The land use layer (Fig. 2.3b) was derived from the National Land Cover map (SANBI 2009) comprising seven classes that covered KZN as follows: natural (62.62%), cultivation (14.92%), plantations (7.61%), degraded (6.54%), urban (4.77%), waterbodies (3.49%) and mines (0.04%).
a) PC1 Winter temperature b) PC2 Summer precipitation c) PC3 Isothermality
d) Temperature coldest period Range -6.2 to 13.3 °C; Mean 4.07 °C
e) Precipitation warmest quarter
Range 205 to 585 mm; Mean 366.97 mm
f) Isothermality
Range 49 to 64; Mean 56.86
Figure 2.1. Spatial distribution of climate variables: a) to c) Principal Component Analysis scores derived from 19 Bioclim variables. d) to f) Variable associated with PC1-3.
a) Altitude
Range -20 to 3432 m; Mean 1088 m b) KZN vegetation biome
Figure 2.2. Spatial distribution of a) altitude and b) KZN vegetation biome variables.
a) Human density
Range 0 to 13 070 people per sq. km; Mean 111 people per sq. km b) Land use
Figure 2.3. Spatial distribution of human impact variables a) human density and b) land use.
2.3.3 Maxent settings and threshold values
Most of the default Maxent settings were used: Auto-features = On, Remove duplicate presence records = y, Regularization multiplier = 1, Maximum background points = 10000, Convergence threshold = 0.00001, Default prevalence = 0.5 and Output format = logistic.
Maximum iterations was changed from the default 500 to 2000 as tests often reached 1000 iterations. Other settings were: Random test percentage = 25%, Replicated run type
= Bootstrap and Replicates = 100. Three logistic threshold values were used to classify the degree of habitat suitability into very low, low, moderate and high: minimum training presence, 10 percentile training presence and maximum training sensitivity plus specificity (Liu, White & Newell 2013).
Two environmental ENMs were run for each species – one with PC variables and one with the actual climate variables that was solely used to help interpret the response curve plots. A second set of human impact ENMs (comprising environmental and human impact variables) were run. To quantify the differences in human impact versus environmental ENMs, I overlaid the environmental and human impact maps and deducted the environmental map probability values from the human impact map values (Swanepoel et al. 2013). The resulting regions with 0 to ± 1% values were treated as no or negligible human impact, and the remaining regions classed as positive or negative impact in the classes 1-10%, 10-50% and over 50%.
2.3.4 Model evaluation
I used four methods to evaluate Maxent models. First, I generated a plot of the area under the ROC (receiver operating curve) curve (AUC) which is a measure between 0 and 1 that indicates the accuracy of the model: 0.5 indicates no better than random, and values over 0.75 indicate a good model fitting (Elith et al. 2006). A number of model variations were tested and the parameter values that produced the best results and AUC values over 0.75 were selected for the final models. Second, I used model gain which measures how well the model fits the sample points compared to a uniform distribution gain of zero (Elith et al. 2011).
Third, I used the True Skill Statistic (TSS), which is similar to the widely used Kappa index but is not affected by prevalence, a shortcoming of Kappa (Allouche, Tsoar & Kadmon 2006).
TSS is traditionally used for assessing the accuracy of weather forecasts, and is defined as sensitivity + specificity – 1 (Allouche et al. 2006). Lastly, I calculated sample size-corrected Akaike information criterion (AICc;Akaike 1974) values to compare the environmental to the human impact models (Burnham & Anderson 2002; Diniz-Filho, Rangel & Bini 2008).
2.3.5 Niche Overlap
The environmental maps per species were merged and an overlap map produced for the common ‘moderate’ and ‘high’ suitability regions. Using the software ENMTools (version 1.4.3; Warren, Glor & Turelli 2008, 2010) I quantified niche overlap between caracal and blue duiker with Schoener’s D and Hellinger’s based I. For both indices, 0 represents discordant niches and 1 represents identical niches. Values for D are usually lower than those for I. A niche identity test was run to determine whether the habitat suitability scores generated by ENMs from caracal and blue duiker exhibit statistically significant ecological differences. The observed D and I values were compared to 1000 pseudoreplicate sets. If observed values were significantly lower than 95% of simulated values, I assumed that the overlap in ENMs of the two species were significantly more different than expected by chance (Warren et al. 2008, 2010).
ENMTools also includes a background test to determine if the niches of two populations are more similar than expected by chance, as even in closely related species, niches are not always found to be strictly identical, as determined in the identity test (Warren et al. 2008,
allopatric populations of sister species under different environmental conditions. The test was not suitable because results of this test can vary based on the definition of the background areas, which was particularly difficult in this case because the blue duiker had a very restricted occurrence range that fell within the much larger range of the caracal.
CHAPTER 3: RESULTS
3.1 Occurrence database
I grouped the initial occurrence data into historical, conservancies, protected areas, other surveys and sightings data which totalled 231 records for caracal and 242 records for blue duiker (Table 3.1; Fig. 3.1). I received 74 responses from the conservancy survey, 92 from the protected area survey, eight from other surveys and 69 sightings. Fourteen conservancies and 18 protected areas reported both caracal and blue duiker presence. There were two reports of caracal preying on blue duiker: (i) unverified observation of caracal scat containing a blue duiker hoof – in the midlands region eight months prior to the survey; and (ii) sighting of an adult caracal with two juveniles feeding on a blue duiker - north coast region approximately five years prior to the survey. Some survey respondents reported that both species had been introduced to areas that previously did not have naturally occurring populations.
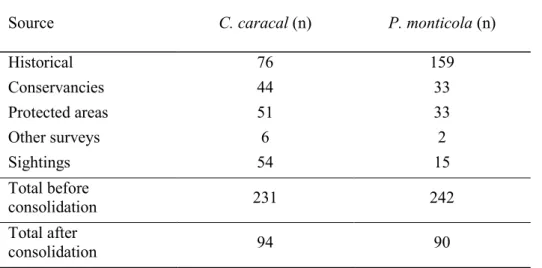
Table 3.1. Sources of occurrence data with number of records before and after data consolidation
Source C. caracal (n) P. monticola (n)
Historical 76 159
Conservancies 44 33
Protected areas 51 33
Other surveys 6 2
Sightings 54 15
Total before
consolidation 231 242
Total after
consolidation 94 90
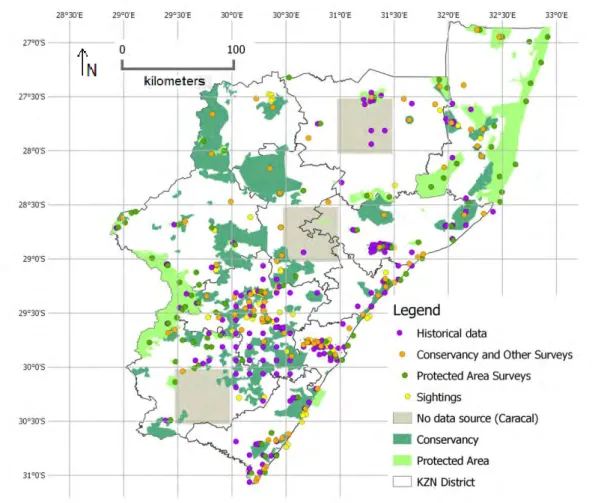
Figure 3.1. Map of surveys (including absence responses), historical data and sightings data collected against the half-degree grid of KwaZulu-Natal.
After data consolidation there were only four records older than 1994 so these were excluded, thus the data set spanned 20 years (1994 – 2013). The final number of records after spatial filtering was 94 for caracal and 90 for blue duiker (Table 3.1; Fig. 3.2), a reduction of nearly half (42%) of the initial occurrence records. This indicated there was a fair amount of replicated data within and across the various sources, thus confirming the validity of the final data set. For the caracal occurrence data, 93.6% of the records were since 2007 and 69.1%
had a spatial accuracy of 5 km or less. For the blue duiker occurrence data, 52.2% of the records were since 2007 (past five years) and 52.2% had a spatial accuracy of 5 km or less.
Nearly half (44.4%) of the blue duiker records came from the historical Natal Parks Board ungulate mapping data base that covered the KZN province at one eighth degree resolution (Rowe-Rowe 1994), hence a grid pattern can be seen in some parts of the blue duiker occurrence data (Fig. 3.2).
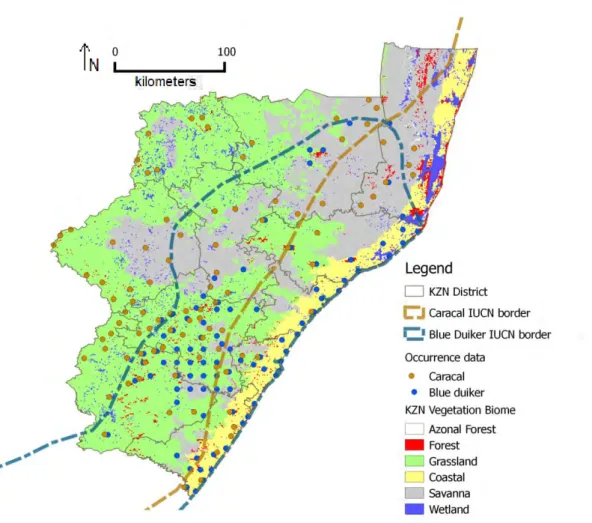
Figure 3.2. Occurrence data after data consolidation and spatial filtering. IUCN borders according to the IUCN Red List assessment 2008.
3.2 Environmental ENMs 3.2.1 Model evaluation
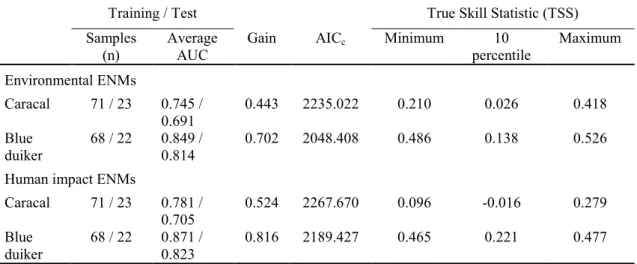
The average AUC training values for the ENMs in the environmental set were 0.745 for caracal and 0.849 for blue duiker (Table 3.2), indicating good model fits (Elith et al. 2006).
The regularised training gain was lower for caracal (0.443) than for blue duiker (0.702) which showed that the model fit to the caracal presence data was 1.56 times more likely than a random background pixel, yet the model fit to the blue duiker data was 2.02 times more likely. The TSS values suggest that the blue duiker ENM was fair (0.4 to 0.5) to good (0.5 to 0.7) based on the minimum training presence and maximum training sensitivity plus specificity thresholds, yet poor (TSS < 0.4) based on the 10 percentile training presence (Table 3.2). The TSS values for the caracal ENM were fair based on the maximum sensitivity plus specificity threshold but poor for the other two thresholds (Table 3.2). The maximum sensitivity plus specificity threshold was the most appropriate threshold for both species. The lower AICc value for the blue duiker ENM indicated that this ENM was more robust than the caracal ENM (Table 3.2).
Table 3.2. ENM evaluation results
Training / Test True Skill Statistic (TSS)
Samples
(n) Average
AUC Gain AICc Minimum 10
percentile Maximum Environmental ENMs
Caracal 71 / 23 0.745 /
0.691 0.443 2235.022 0.210 0.026 0.418
Blue
duiker 68 / 22 0.849 /
0.814 0.702 2048.408 0.486 0.138 0.526
Human impact ENMs
Caracal 71 / 23 0.781 /
0.705 0.524 2267.670 0.096 -0.016 0.279
Blue
duiker 68 / 22 0.871 /
0.823 0.816 2189.427 0.465 0.221 0.477
AUC: Area under the curve; Gain: Regularised training gain; AICc: Akaike information criterion;
Minimum: Minimum training presence logistic threshold (LT); 10 Percentile: 10 percentile training presence LT; Maximum: Maximum training sensitivity plus specificity LT.
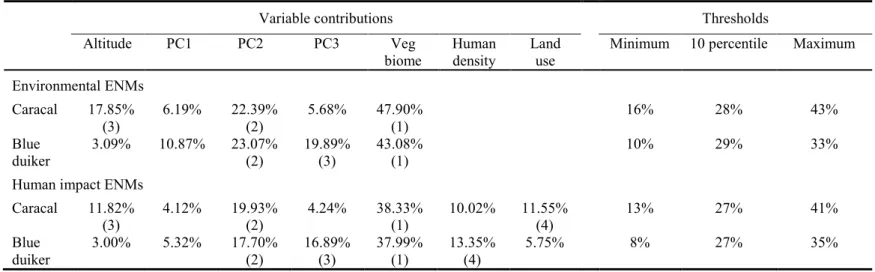
3.2.2 Environmental variables
The variable that contributed the most to the caracal model was vegetation biome, followed by summer precipitation (PC2) and altitude; combined these three variables explained 88.14%
of the ENM (Table 3.3). Jackknife analysis for the caracal ENM revealed that vegetation biome was the variable with the highest gain in isolation (i.e. had the most useful information by itself), and that decreased the gain the most when omitted (i.e. had the most information not present in other variables). The three highest contributing variables to the blue duiker ENM (combined 86.04%) were vegetation biome, summer precipitation (PC2) and isothermality (PC3) (Table 3.3). Jackknife analysis for the blue duiker ENM showed that vegetation biome had the highest gain in isolation, whereas summer precipitation (PC2) decreased the gain the most when omitted.
To interpret the response curves the models were run using the actual climate variables, and the average AUC values were similar to the PC models at 0.749 and 0.810 for caracal and blue duiker, respectively.