The following story sheds light on the nature of the racial attitudes adopted during the apartheid era in South Africa. It is the focus of this study to explore and describe this phenomenon as observed in the cafeteria of the University of KwaZulu-Natal, Pietermaritzburg. Naturally occurring intergroup contact in South Africa has proven inadequate and this section will attempt to elucidate some of the factors contributing to this phenomenon.
These were the University of Cape Town and the University of the Witwatersrand (De la Rey, 2001). This is evident in the country's new constitution, which focuses on non-racial and non-sexist commitment. The description of the apartheid era in South Africa is important in the contextualization of this study.
The leaders of the time were inclined to ensure segregation under the guise of separate self-development. The aim of the present study is based on the tandem with the mentioned studies. On both sides of the racial divide, there were fears and apprehensions of a violent revolution in the country.
This Afrikaner resistance was unsuccessful because the majority of the population wanted a change in the system.
THE FORM AND PATTERN OF SOCIAL CONTACT IN POST- APARTHEID SOUTH AFRICA
Seidman (1999) is of the opinion that racial patterns or attitudes can be resistance to change in post-apartheid South Africa. According to the study by Krysan & Farley (2002), some of the pertinent issues regarding intergroup contact are spatial competition, contagion and spatial density dependence. Spatial competition is relevant to the South African situation as it is at the heart of previous segregation laws.
The knowledge transmitted by the white population to the masses was that there should be 'different areas for different racial groups'. These societies are an extension of the white population's need to regulate racial numbers in their so-called 'white society'. Massey and Denton (1993) are also of the opinion that segregated residential areas with separate amenities contribute to blacks sharing few political interests with whites.
This is the phenomenon in South Africa and it seems to be the case despite the changes in the country's laws. In their research on beaches in South Africa, Dixon and Durrheim (2003) observed that whites and blacks appeared to use the 'space' at different times of the day. According to the same authors, "it was also evident in broader patterns of racial distribution, in the 'inequality' of racial distribution across different parts of the beach" (p. 12).
Christopher (2001) found that census results for 1996 revealed a marked difference in the differences in levels of segregation among the nine (9) provinces in South Africa. 34; Indeed, the white population was able to maintain virtually unchanged levels of physical separation from the rest of the population throughout most of the country" (Christopher, 2001, p.453). Thus, according to the same author, the changes are due not only to the race factor but also to a specific urban environment.
Some of the stereotyping inherent within the group is evidenced by one of the white residents stating that it would be like having to listen to 'their drums'. The 'old segregation', according to Goldberg (1998), is an activist segregation produced by an interaction in politics, economics and culture. According to Pettigrew (1998), prejudiced people usually tend to avoid contact with groups against which they are prejudiced.
RESEARCH DESIGN AND PROCEDURES
PILOT STUDY
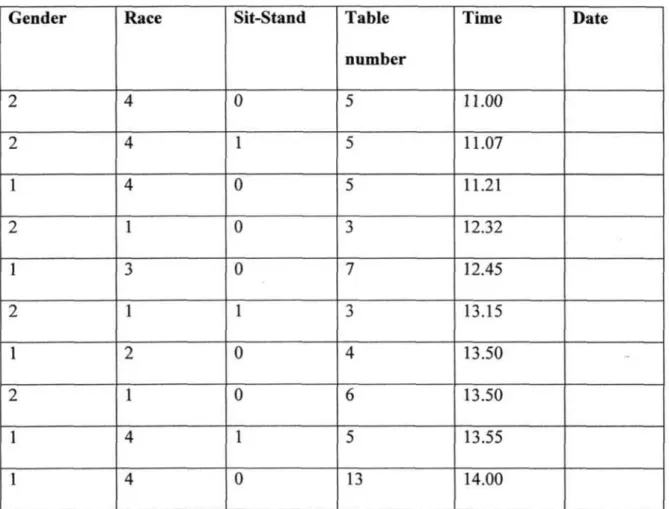
At the beginning of the observation procedure, the researcher and assistant attempted to orient themselves to the overall setting and mapped out the floor plan of the Hexagon (see Appendix A). Race was coded according to the four prevalent racial groups at the university: “White,” “Black,” “Colored,” and “Indian.” Coding and controlling the inflow and outflow of students proved to be quite difficult, because you had to work systematically and be alert to details.
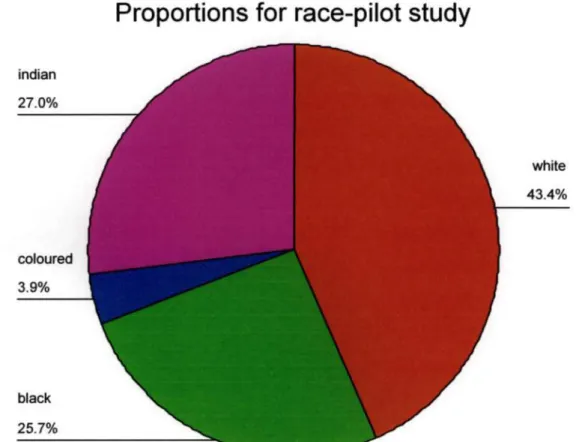
The overall proportion of black, white, brown and Indian students eating at the Hexagon Cafe is 27.0% students respectively (refer to Appendix D). The Statistical Package for Social Sciences (SPSS) was used to calculate the inequality of the racial distribution across different tables in the cafeteria. This was achieved by calculating one of the previously mentioned indices, in this case 'D' for disparity.
The results of the pilot study indicate that Indian and White students mostly patronize the Hexagon Cafe. However, these results may also be a mere indication that Indian and White students use the Hexagon Cafe as a common social space. This 'D' value means that there are no black and Indian students at the beginning of observations.
However, it is interesting to note that the graph fluctuates radically over time, indicating movement in the cafeteria as students begin to pour in. It is noted that black and Indian students show points of integration as time goes on. It was further observed that students tended to gather in homogeneous groups, indicating a tendency to define territories around the Hexagon Cafe.
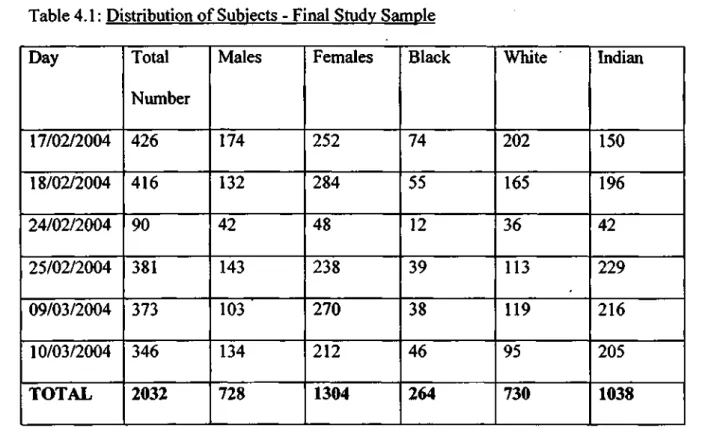
The table above excludes students of color because they were not part of the final analysis for the study. However, data for two observation days, dated March 2–3, 2004, will not be included in the final analysis because they are incorrectly coded. This period fell just before the lunch break and therefore ensured that sufficient students used the observation room.
CHAPTER FOUR
PRESENTATIONS AND ANALYSIS OF DATA
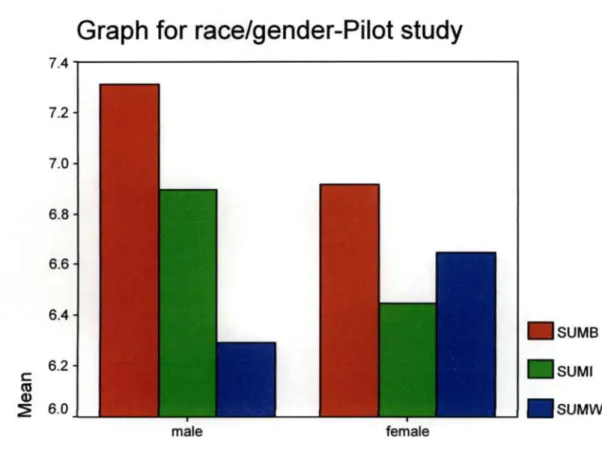
D' for gender left/right: shows gender inequality on the two sides of the Hex cafe. The graph showing the racial composition of the left and right sides of the cafeteria indicates "D" fluctuations. The results of the summen-sumwom graph show that more female students use the Hexagon Cafeteria than men.
Furthermore, there is an indication from the graphs that both sexes are equally distributed in the cafeteria's overall social space. An analysis of the graph indicates that the three racial groups per table was initially segregated as shown with 'D' value of 1. The gender across tables graph shows high levels of segregation (0.9) which appeared unchanged for most of the day.
It is interesting to note that on this day, white students seemed to form the isolated racial group, while black and Indian students were evenly distributed on both sides of the cafeteria. By the end of the observation time, total integration among the three racial groups was emphasized. It is noted that the three races maintain this total separation throughout the first part of the day.
However, toward the end of the observation period, integration between the three racial groups was emphasized. Graphs showing both genders on the left and right sides of the Hexagon Cafe show that they are unevenly distributed. A graph showing the racial composition of the 'left and right' sides of the cafe shows 'D' oscillations.
The chart also shows an uneven distribution of the three racial groups within the total social space of the Cafeteria. As shown in the graph for the 19 tables, the 'D' value for the three racial groups suggests high levels of segregation at the start of the survey. The graph depicting the racial composition of the left and right sides of the cafe shows the 'D' changes.
VVKJ
SUMMARY. RECOMMENDATIONS AND LIMITATIONS 1 Summary
In this study, it was found that black students were mostly segregated compared to the other racial groups. It could be speculated that the Hexagon Cafeteria is not a social meeting place for the majority of black students, which is why a low proportion of black students presented in this study. This was an optimistic finding indicating that students from the University of KwaZulu-Natal, Pietermaritzburg integrate to some extent with students from different racial groups at the Hexagon Cafeteria.
The results of this study are consistent with some of the findings in the study by Smith, Stones, and Naidoo (2003), who found that there was only a small change in tolerance between different racial groups in college. These tendencies are at the heart of the consequences of unequal status between the different racial groups. Gordon Allport (1954) indicates that unequal status between the different racial groups may be responsible for the continued prejudice and discrimination.
This phenomenon has been observed today in the south, a decrease in prejudice has been observed; at the same time, southern blacks have risen in the stratification system and, with the elimination of "separate but equal" public facilities, blacks and whites of the same social class are brought closer together (Perry & Perry, 1991). The classroom environment may be another reason for the failure to reduce prejudice and discrimination by mixing black with white. However, interpreting the practical significance of the differences found is clearly a matter of individual judgment and perspective. e).
The sample selected for this study was somewhat biased as the study consisted only of the subjects who were presented at the Hexagon Cafeteria on the six days of observation. f) The researcher was unable to obtain a sample from other cafeterias in the university due to time and financial constraints. The scope of the study thus only took place in one cafeteria at the university. There were very few black students featured in this study compared to other racial groups.
Intergroup contact at school and its influence on the social image of the physically challenged. COMPUTE 'LEAVE' AS +1 FOR FIRST HALF, -1 FOR SECOND HALF OF DOUBLE LENGTH DATA. THEREFORE, THERE IS A CURRENT COUNTING OF HOW MANY TOTAL OF THE THREE RACES ARE SEATED AT EACH OF THE 19 TABLES.
THIS INCLUDES THE RUNNING TALLY, WITH THE LAG COMMAND, HERE ONLY FOR THE LEFT/RIGHT VERSION. Calculate the three amounts: this is how many of each breed there are in total in the hexagon, and in all added tables.
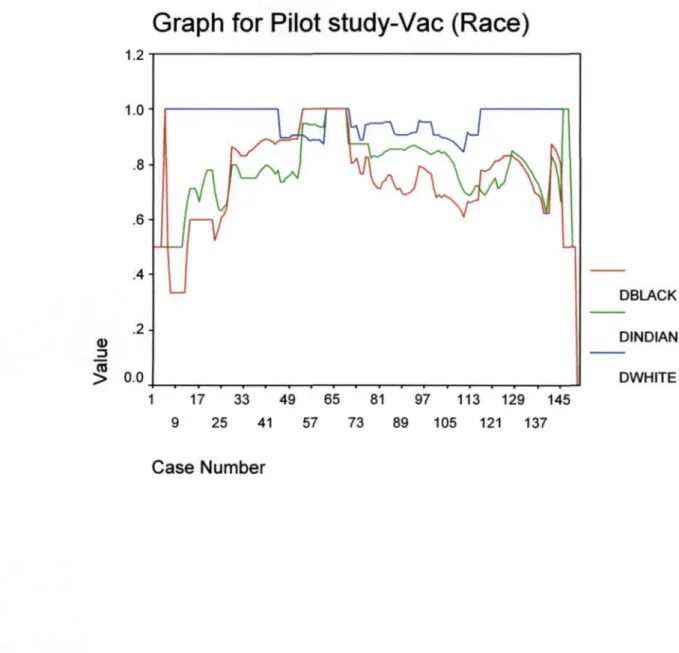
Proportions for race-pilot study