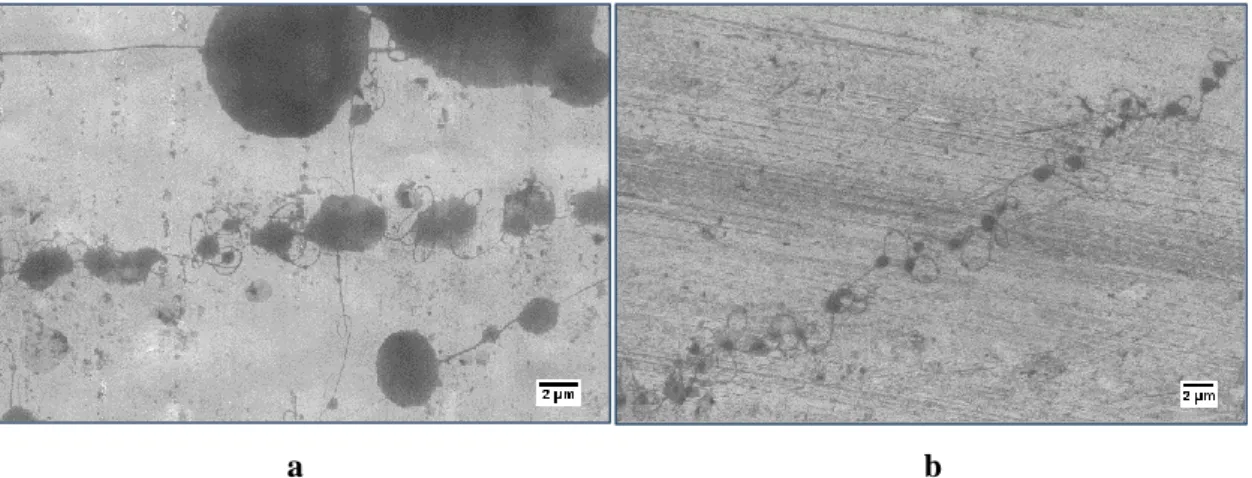
99 Figure 6-20 SEM images of the fibers produced from experiment I at low magnification (a) and higher magnification of the same area (b). 104 Figure 6-21 SEM images of the fibers produced from experiment II at low magnification (a) and higher magnification of the same area (b).
Introduction
Each of the methods used to synthesize graphene are detailed along with the various methods of reducing the graphene oxide that is produced. The microscopic production of graphene nanofibers involved electrospinning graphene together with a polymer material.
Aims and objectives
Graphene and its applications
Discovery and brief history
To study the electronic properties of the produced graphene, the films were processed into multi-terminal Hall-bar devices placed on an oxidized silicon substrate to which a gate voltage was applied [1]. Although these graphene films were only one atom thick, they remained stable at room temperature and exhibited very high mobility, µ, of the charge carriers [18].
Properties
- Physical structure
- Electronic structure and properties
- Conductivity
- Mechanical properties
- Other properties
The Klein paradox is defined as "the unimpeded penetration of relativistic particles through high and wide potential barriers" [25]. The lack of a zero-conductance stop is caused by the pinning of the Fermi level inside the band gap, and. the electron transport is purely 2D.
![Figure 3-1 The crystalline structure of graphene (top), fullerenes (bottom left), carbon nanotubes (bottom middle) and graphite (bottom right) [10]](https://thumb-ap.123doks.com/thumbv2/pubpdfnet/10640743.0/25.892.235.741.105.534/figure-crystalline-structure-graphene-fullerenes-carbon-nanotubes-graphite.webp)
Synthesis of graphene
- Synthesis of graphene via chemical exfoliation
- Synthesis of graphene via ultrasonic exfoliation
However, this process negatively affects the carrier mobility of the produced graphene, and the etched substrate cannot be reused. The difference is due to the presence of the aforementioned functional groups as well as structural defects [45, 61].
Methods of characterising graphene
The 2D peak of the Raman spectrum of graphene produced via the reduction of GO is also analyzed to determine the number of layers in the sample [45]. Evidence for this is the recovery of the (002) diffraction peak and the disappearance of the characteristic GO peak [113].
![Figure 3-7 HRTEM image of single-layer graphene. The bright spots indicate carbon atoms whereas the darker spots indicate gaps in the lattice [88]](https://thumb-ap.123doks.com/thumbv2/pubpdfnet/10640743.0/39.892.281.698.107.334/figure-hrtem-single-graphene-bright-indicate-indicate-lattice.webp)
Degradation of graphene and graphene oxide
The findings of their study revealed that the concentration of H2O2 found in natural sources causes the degradation of graphene [114]. An investigation of the degradation of monolayer graphene on SiO2 in particular was carried out by Roy et al.
Applications
141] which involved the production of graphene fibers through chemical reduction-induced self-assembly of GO dispersions. The electrical and optical properties of graphene can be exploited to produce highly efficient solar cells [145].
Summary
Various functional groups that can be found on the surface of GO interact with ionic particles and can help to remove nuclear debris in solution [167]. 167] showed that when nuclear waste is added to a GO solution in water, the waste causes coagulation of the GO.
Electrospinning
- The electrospinning process
- The electrospinning apparatus
- Polymers used for electrospinning
- Polyvinyl alcohol (PVA)
- Polystyrene
- Electrospinning solution parameters
- Electrospinning processing parameters
- Delivery system
- Flow rate
- Collection system
- Tip-to-collector distance
- Applied voltage
- Ambient parameters
- Characterization of electrospun fibres
- Applications of electrospun graphene/PVA composite fibres
- Summary
An increase in the concentration of the polymer solution results in fibers with larger diameters [187, 192]. The optimal applied voltage or potential difference depends on the properties of the polymer solution itself [172]. They discovered that higher humidity (above 30%) results in the formation of pores on the surface of the fibers.
![Figure 4-1 Taylor cone formation at the end of the spinneret [170].](https://thumb-ap.123doks.com/thumbv2/pubpdfnet/10640743.0/60.892.297.681.105.268/figure-4-taylor-cone-formation-end-spinneret-170.webp)
Synthesis of graphene
Experimental methods
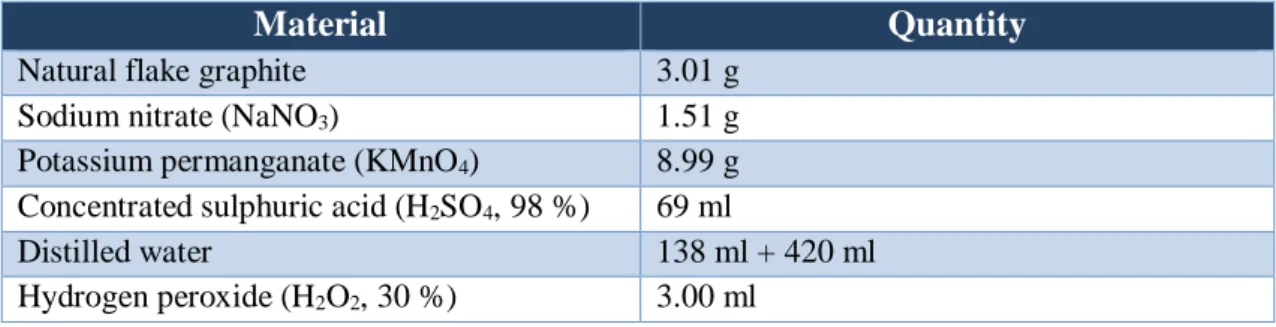
- Hummers’ method
- Modified Hummers’ method with extended oxidation time
- Modified Hummers’ method with additional potassium permanganate
- Tour method
- Huang method
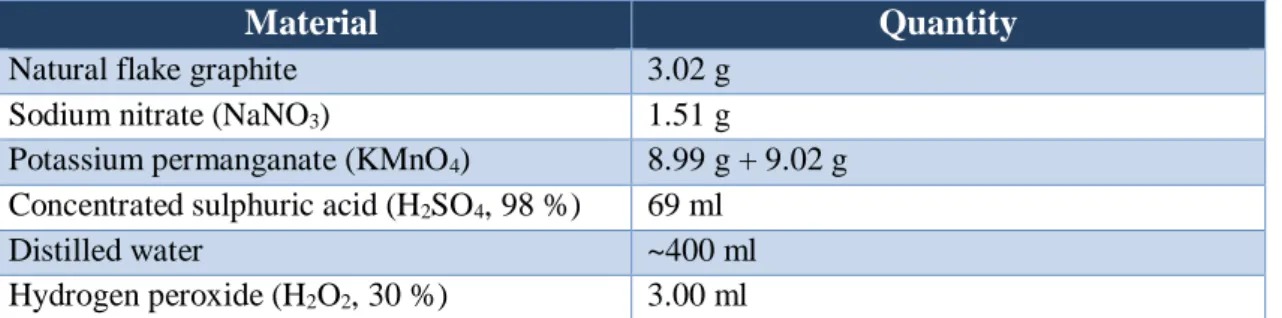
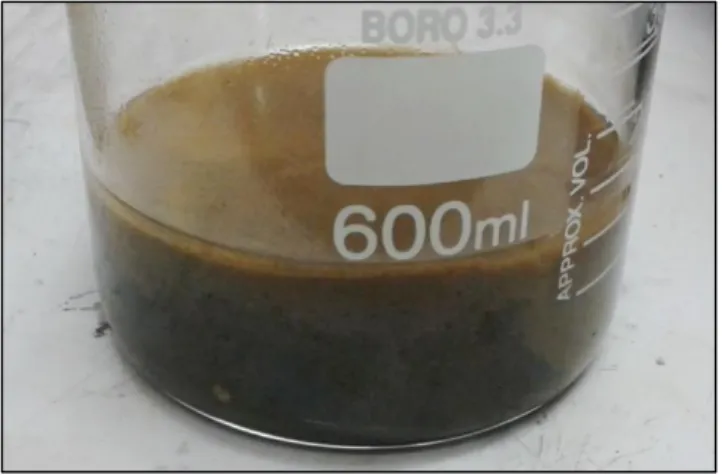
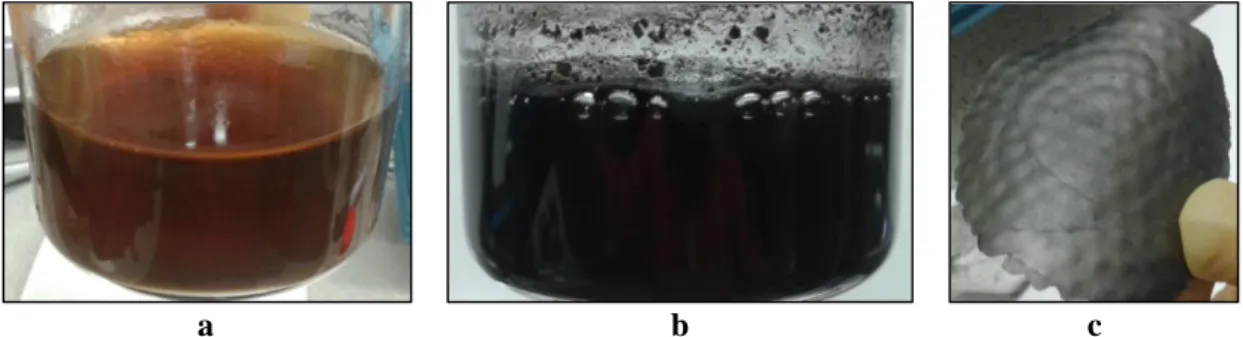
The oxidation reaction in each of the experiments was terminated by the addition of hydrogen peroxide (H2O2) to the mixture. It was observed that the mixture gradually changed to a deep green color due to the presence of KMnO4 in the acid [230]. After this period, the mixture was much browner in color than that of the mixtures from the previous two experiments.
Method of washing of graphene oxide
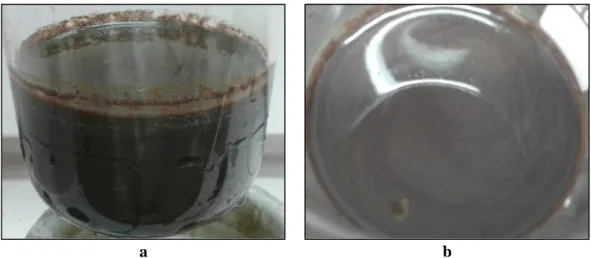
H2O2 was then added along with ∼350 mL of distilled water to stop the oxidation reaction. Therefore, an additional 3.0 mL of H2O2 was added to reduce the acidity of the solution and to achieve the expected color change. The mixture remained very dark brown upon this second addition of H2O2, but when ∼5 mL of the solution was diluted in ∼100 mL of distilled water, a yellow-brown color was observed, indicating that oxidation had occurred [230].
Observations
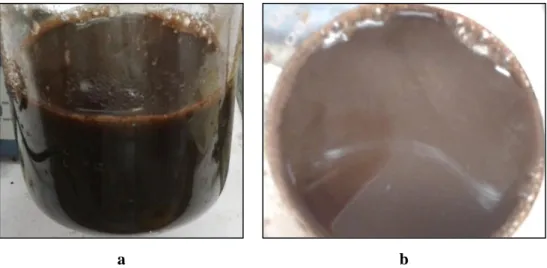
The light brown color (compared to that of the other experiments) of the solution can be seen in Figure 5.7. Note that the sodium carbonate residue was also removed via washing the GO solution. It was observed that the color of the solid gradually changed and became browner during the washing process.
Methods of reducing graphene oxide
- Reduction by sodium borohydride
- Reduction via ascorbic acid
- Reduction via thermal treatment
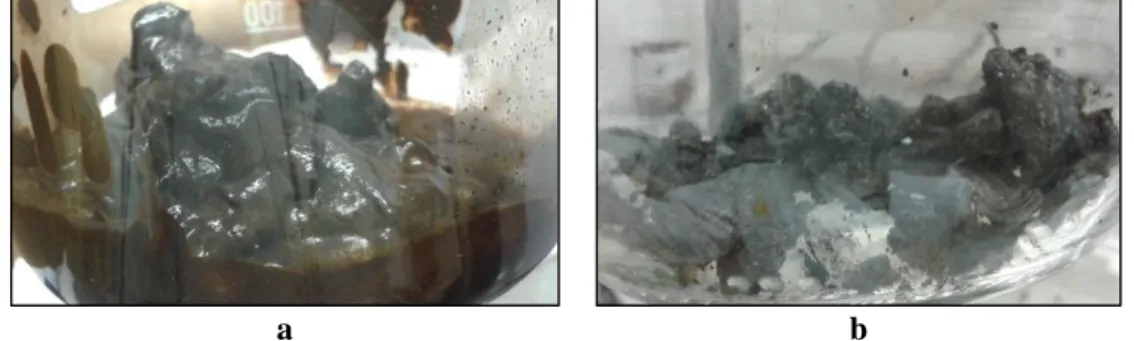
This indicated that unreacted graphite was present in the mixture due to the appearance of the floating particles. It was observed that the solution immediately became much darker in color and bubbled aggressively upon addition of NaBH 4 . The solution was then filtered and the vacuum filter remained on for one hour to facilitate drying of the solid.
Qualitative analysis of synthesised graphene oxide
This is the result of the relatively short time that the GO was exposed to a 1000 °C environment, which resulted in insufficient deoxygenation of the sample. If the quality of the GO produced is solely based on the color of the solutions, then it is. Therefore, the two methods that result in GO of the highest quality qualitatively are the modified Hummer's method with extra KMnO4 and the Tour method.
Summary
GO-4 had no visible solids present, but some solids were visible when the vial was rotated, although this material remained in solution and did not settle to the bottom of the vial when standing. The oxidation reactions are exothermic reactions, so in the absence of an ice bath the temperature of the reaction would have risen excessively and caused the explosive reaction during the addition of the acid to the KMnO4 and graphite. The qualitative analysis of the GO produced from each of the five investigated methods suggested that the two methods that produced the highest quality GO were those of the third and fourth experiments which were respectively the modified Hummers' method with additional KMnO4 and the Tour method was.
Fabrication of graphene fibres
The electrospinning apparatus
The circuit diagram of the designed DC high voltage power supply is shown in Figure 6-1. The needle was connected to the ground of the high-voltage power supply by means of a crocodile clip. A cable was attached to this board to allow connection to the positive terminal of the high voltage power supply.
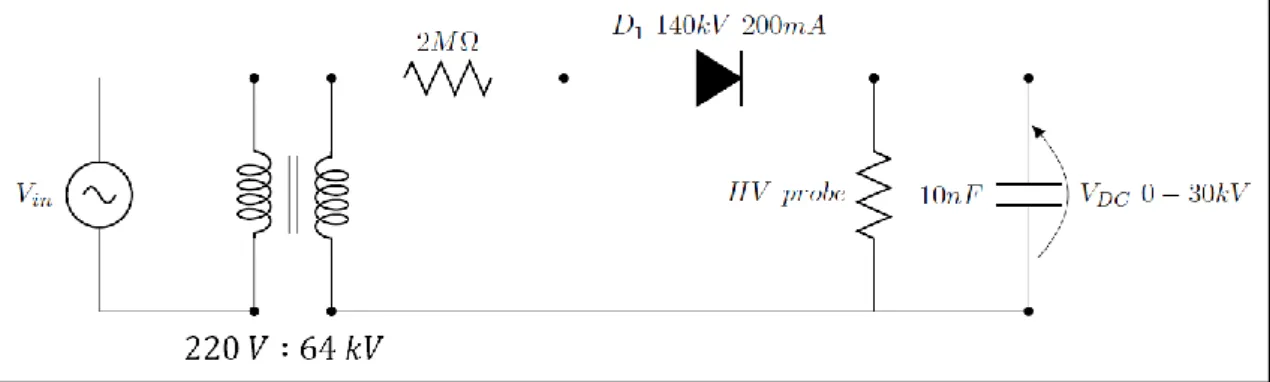
The high voltage DC power supply
Initial testing for electrospinning
Therefore, this preliminary experiment showed promising findings that the conductivity of the material appears to have increased with the addition of graphene. This indicated that the droplets were drawn into the fine atomizer by the electrospinning process. Another experiment at this stage of testing showed that graphene appears to increase the conductivity of the electrospun material.
Electrospinning trial
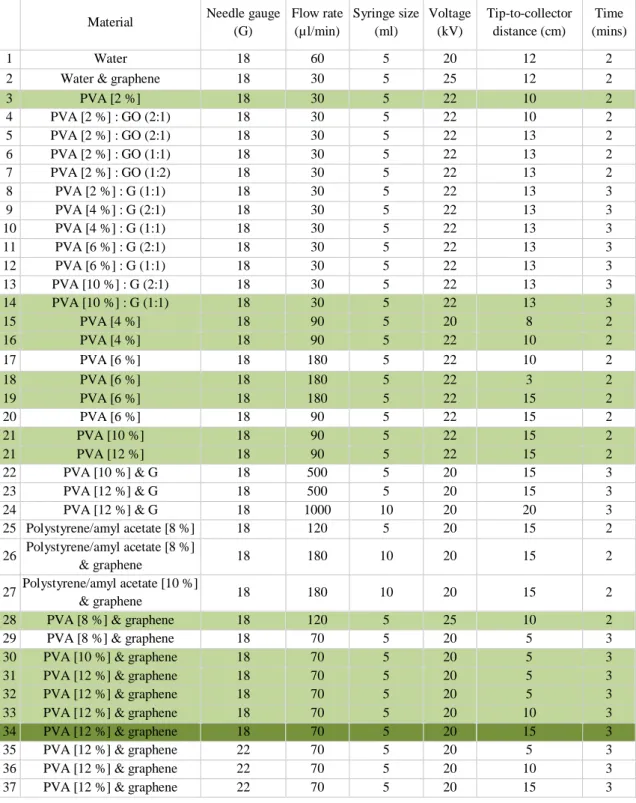
During SEM analysis of the samples, it was found that the electron beam damaged the samples because they were not coated with gold. It was decided that in the future the samples would be coated with gold to prevent damage to the samples. After analyzing the SEM images obtained from these experiments, it was found that fibers produced using a 1:2 ratio (PVA:GO) did not produce fibers.
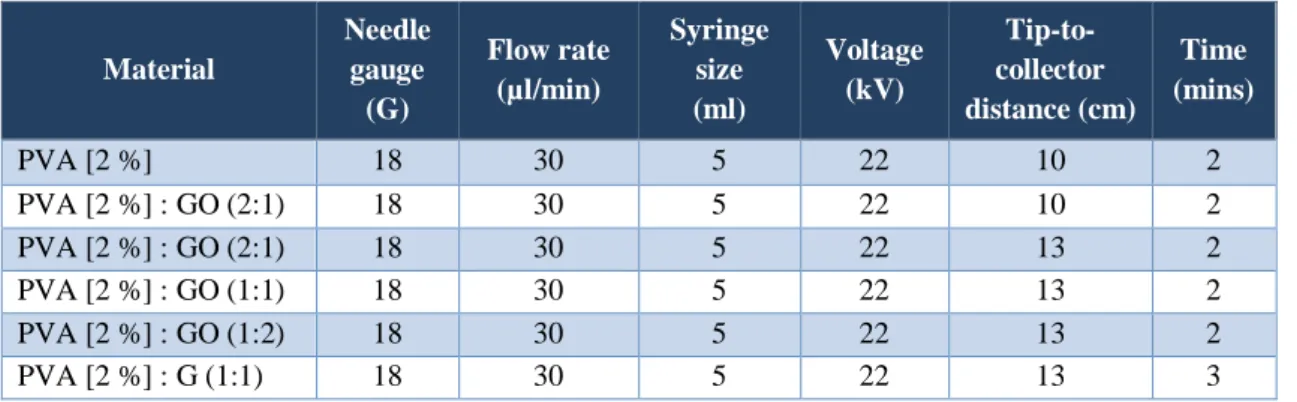
Preliminary electrospinning trial of PVA and graphene
The electrospinning apparatus for the electrospinning of the PVA and graphene solutions was assembled in the horizontal configuration. An improvement of this method was to determine the concentration of graphene present in the solutions by mass instead. The graphene in the subsequent experiments was dried before adding to the PVA solution, thereby avoiding dilution of the PVA solution.
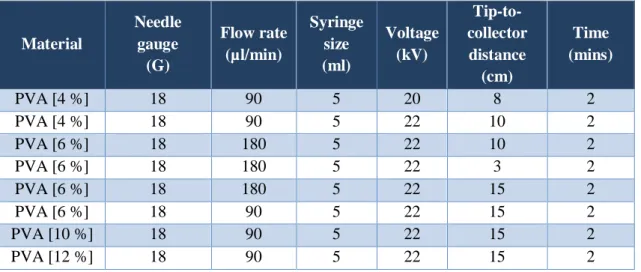
Electrospinning of PVA
Increasing the distance between the tip and the collector reduced the size of the deposits and resulted in the production of higher quality fibers. The average diameter of fibers produced with a 6% (w/v) PVA solution was, in comparison, 92 nm. The results of the 12% (w/v) PVA solution were similar to those of the 10% solution, as the fiber network was observed even at low magnifications.
Electrospinning trial of PVA and graphene
After adding graphene to the PVA solution, it was found that some graphene aggregated. After the addition of graphene to the PVA solutions, each solution was sonicated for 4 h. After the addition of graphene to the polymer solutions, the solutions were sonicated for 5 hours.

Introduction of graphene to PVA for electrospinning
When the synthesized graphene was added to the PVA solution, this once again caused the solution to solidify. This indicated that residual NaBH4 may have been present in the graphene due to insufficient washing of the solution. However, when adding a small amount of the graphene to the PVA solution, solidification of the solution occurred.
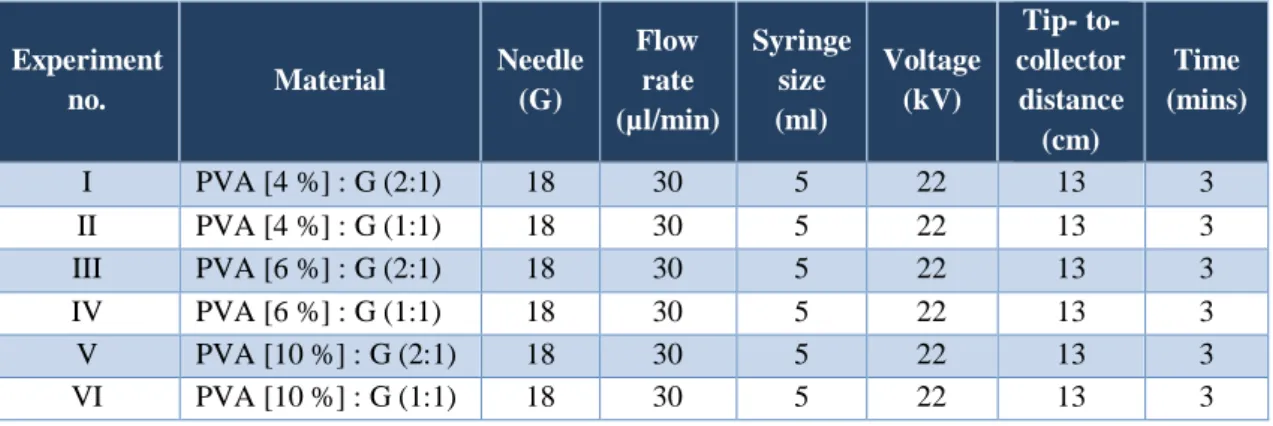
Optimisation of the electrospinning of PVA and graphene
The graphene powder suspended in water was then heated to evaporate most of the water before this powder was added to the PVA solutions. This solution was heated to evaporate most of the water before introducing the graphene into the PVA solution. Since the addition of graphene to PVA was successful, more graphene was synthesized using this method in order to add a sufficient amount to the PVA solution.
Discussion of electrospinning experiments
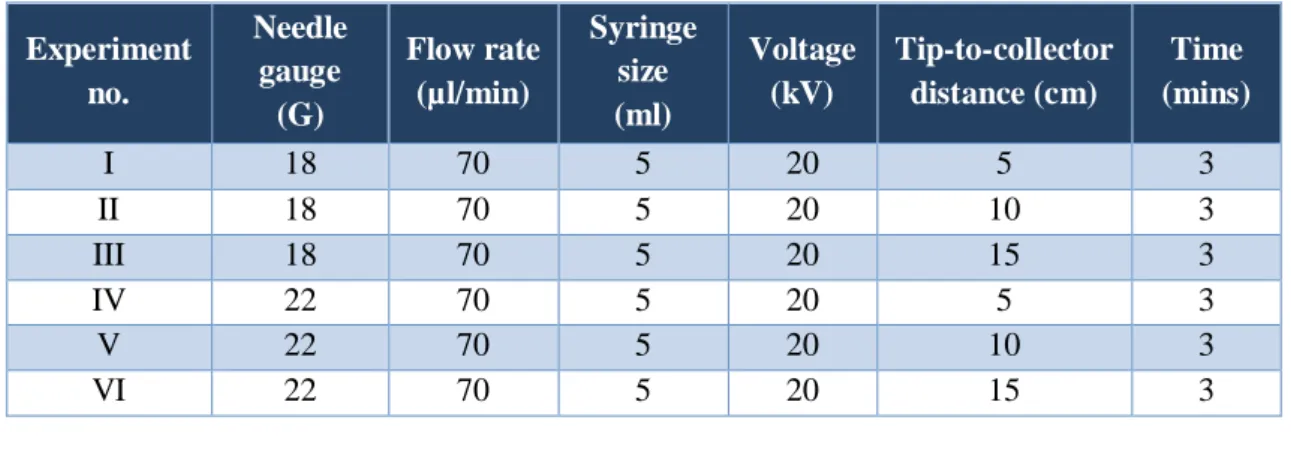
After SEM analysis of the samples from experiments IV – VI, it was clear that even 22 G is too narrow for the given fixed parameters. The effect of needle size is related to the delivery and flow rate of the solution, as needles that are too thin would cause problems in dispensing the solution. The effect of tip-to-collector distance was also investigated during this set of experiments and it was found that a larger tip-to-collector distance resulted in finer fibers (average diameter 107.40 nm) with less spread and smaller beads on the fiber. strands.
Summary
Results and discussion
Instrumentation
The samples were then placed under a heated lamp to evaporate the ethanol before analysis. In some cases the samples were coated with gold, but most of the samples were not coated with gold because the coating obscured the sample. The sample carrier grid consisted of a copper or holey carbon carrier film on which the samples are placed.
Results of the synthesis of graphene and graphene oxide
- Graphene oxide results
- Reduction of graphene oxide to form graphene
- Discussion of methods
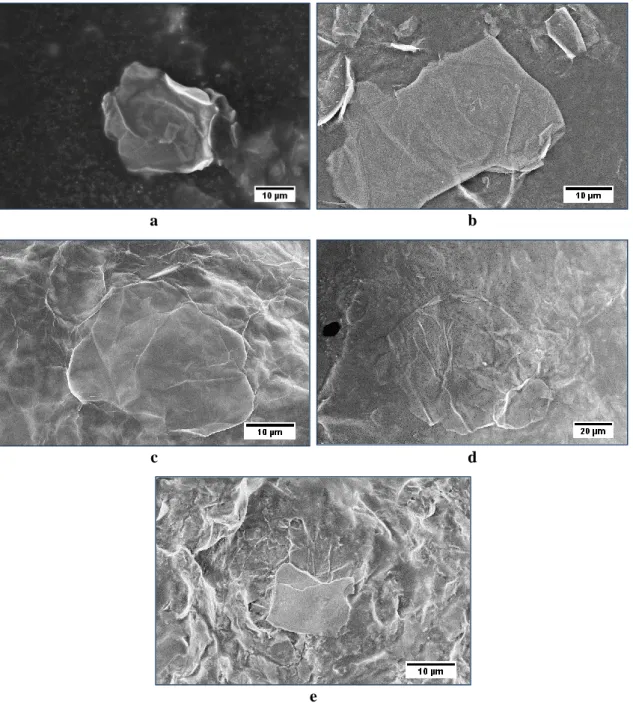
This implied that the oxidation level of the GO produced from these two samples was similar. The TEM images below of the graphene produced from the GO of Experiment 4 via the ascorbic acid (AA) reduction method revealed quite small graphene flakes. G AA indicates the XRD pattern of the graphene produced from the GO from Experiment 4 that was reduced via ascorbic acid.
Results of the electrospinning of graphene fibres
This would help determine the number of layers within the graphene samples in particular. An increase in applied voltage appears to result in a sparser distribution of fibers, as seen in the figure below. The prevalence and size of beads in the fibers appeared to decrease with an increase in solution concentration.
Summary
Conclusions
That being said, this research was the first of its kind in the laboratory; the scope of which was quite unknown to the student, but the results of the experiments carried out during one year of research provided an insight into the various ways of chemical synthesis of graphene and its products. This research also proposed a method by which graphene nanofibers and macroscopic fibers can be produced. These results can be improved by using this research as a basis for further related studies.
Future work
Liu, et al., “Facile synthesis and characterization of graphene nanosheets,” Journal of Physical Chemistry C, vol. Yeomans, et al., "Protective textile materials based on electrospun nanofibers," Journal of Advanced Materials, vol. Mhaisalkar, et al., "Electrospun Composite Nanofibers and Their Multifaceted Applications," Journal of Materials Chemistry, vol.
![Figure 3-3 Energy band structure of single-layer graphene. The inset is an enlarged image of the area around the K point [20]](https://thumb-ap.123doks.com/thumbv2/pubpdfnet/10640743.0/27.892.262.713.464.762/figure-energy-structure-single-layer-graphene-inset-enlarged.webp)
![Figure 3-4 Energy band structure of bi-layer graphene. The inset is an enlarged image of the area around the K point [20]](https://thumb-ap.123doks.com/thumbv2/pubpdfnet/10640743.0/28.892.268.709.172.470/figure-energy-structure-layer-graphene-inset-enlarged-image.webp)
![Figure 3-8 TEM images of single-layer graphene (a) and multi-layer graphene (b) [79].](https://thumb-ap.123doks.com/thumbv2/pubpdfnet/10640743.0/39.892.178.756.484.770/figure-images-single-layer-graphene-multi-layer-graphene.webp)
![Figure 3-13 Raman spectrum of GO using 514 nm laser excitation. The D and G peaks are located at 1590 cm -1 and 1350 cm -1 , respectively [12]](https://thumb-ap.123doks.com/thumbv2/pubpdfnet/10640743.0/43.892.281.699.184.402/figure-raman-spectrum-using-laser-excitation-located-respectively.webp)
![Figure 3-15 Raman spectra for graphite (red) and single-layer graphene (blue) using a 532 nm laser excitation [96]](https://thumb-ap.123doks.com/thumbv2/pubpdfnet/10640743.0/44.892.347.639.314.674/figure-raman-spectra-graphite-single-layer-graphene-excitation.webp)
![Figure 4-2 Diagram of the two basic configurations of the electrospinning apparatus, a) vertical and b) horizontal [169]](https://thumb-ap.123doks.com/thumbv2/pubpdfnet/10640743.0/60.892.352.626.740.1129/figure-diagram-basic-configurations-electrospinning-apparatus-vertical-horizontal.webp)