DESCRIPTION OF THE INDUSTRY
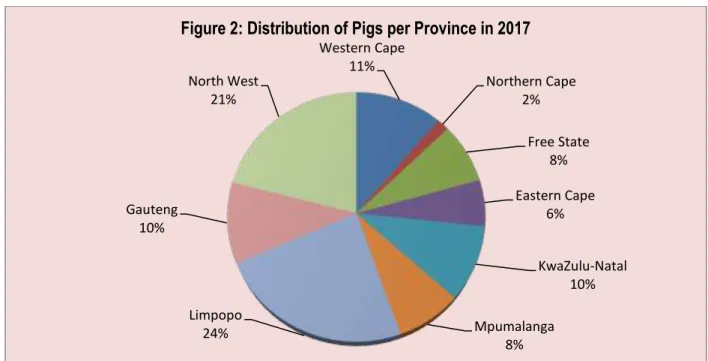
- Production areas
- Production trends
- Local consumption
- Employment
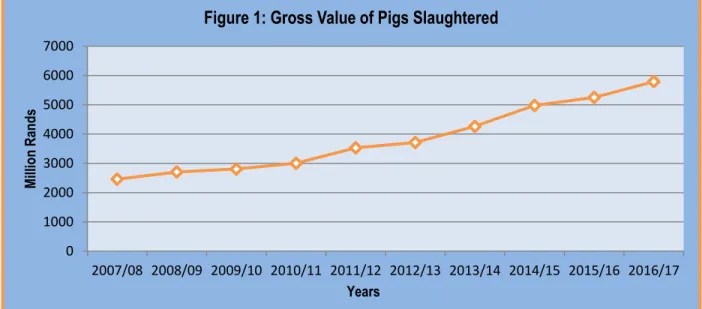
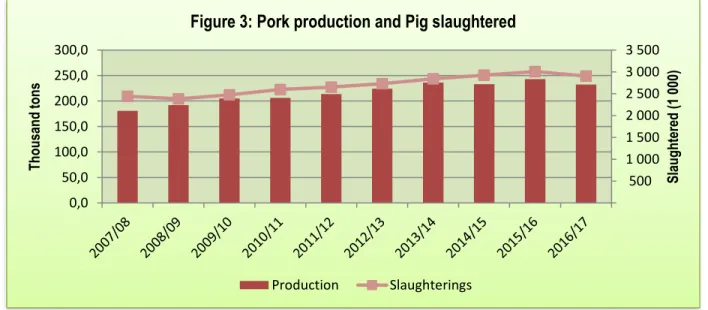
It is worth noting that the number of pigs in South Africa has been decreasing over the previous years, this may be due to the fact that the consumption of pork is increasing. During the last decade, about 27 million pigs were slaughtered, producing more than 2 million tons of pork. On average, 2.2 million pigs were slaughtered and produced an average of 216,600 tons per year for the period under analysis.
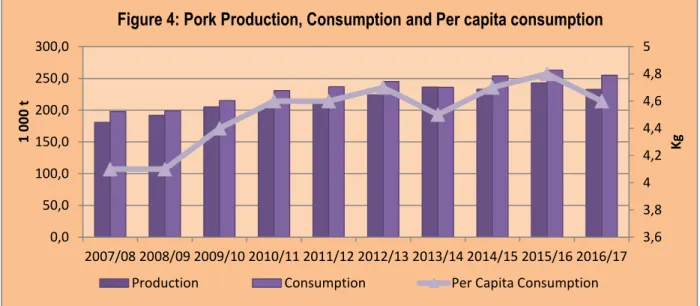
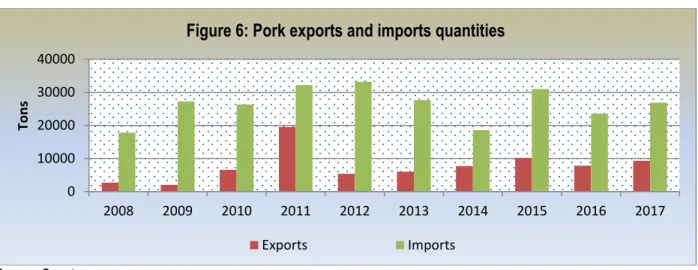
In response to increasing consumption and/or demand for pork products, pork production has increased over the past decade, as has the number of pigs slaughtered. Figure 4 shows that South Africa consumes more than it produces, making the country a net importer of pork. In 2013/14, South Africa became self-sufficient with production of 236 300 tonnes, exceeding consumption of 236 000 tonnes, with consumption falling slightly in 2013/14.
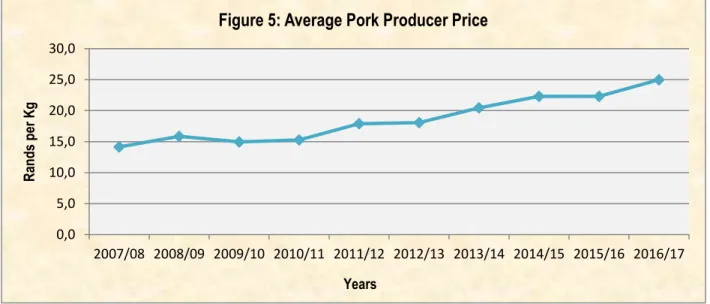
This may be due to the high price of pork, which has made it relatively expensive to its substitutes such as poultry and beef. The increased per capita consumption may be due to the increasingly urbanized consumers with the increased per capita income.
MARKET STRUCTURE
Domestic market
Import-export analysis
It also confirms that South Africa relies on imports to meet local demand for pork.
South African export and import analysis
- Exports for pork
- Imports
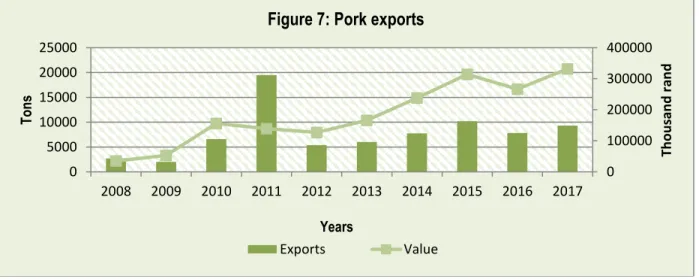
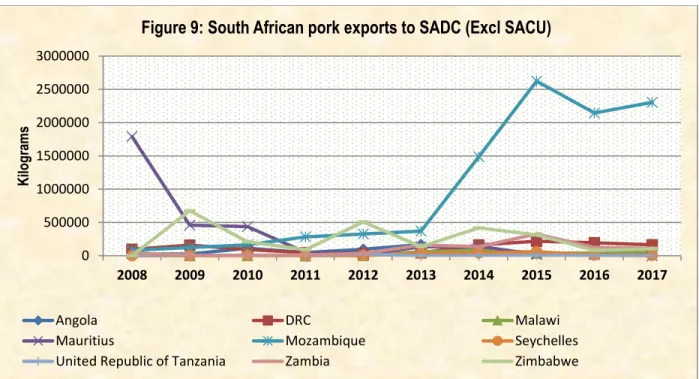
According to Figure 7, it is clear that the amount of pork exports has remained lower over the past decade, excluding the year 2011, which showed an outlier at approximately 20,000 tons. In total, Mozambique claimed the largest share of pork exported by South Africa during the period under analysis, followed by Mauritius and Zimbabwe. United Republic of Tanzania and Seychelles recorded the lowest shares of South African pork exports during the period under review.
Of the country's total pork exports, Gauteng has a 60% export share, followed by the Western Cape with a 16% share. There were no records of pork exports from the Eastern Cape province between 2008 and 2012. From the Free State province, all district municipalities recorded occasional pork exports during the analyzed period.
Thabo Mofutsanyane District Municipality recorded pork exports during the period 2008 to 2009 and again from 2014 to 2017. Lejweleputswa saw pork exports soar in 2017 and accounted for 49% share of pork exports flowing through Mangaung with 38%. On average, the City of Johannesburg dominated pork exports for the entire period under review.
Stenbukken district municipality has recorded exports from 2014 to 2017, while Waterberg district municipality has recorded exports of pork in and 2017. In the total share of pork exports in 2017, Stenbukken accounted for 79.5%, followed by Vhembe with a share of 20.1% and Waterberg with shares of less than 1 per cent. Siyanda District Municipality accounted for 97% of pig exports from the province in 2015, followed by Namakwa and Frances Baard District Municipalities with 2.7% and 0.1% respectively.
In total, Germany was the largest pork exporter to South Africa within the European Union countries with a total share of 50%, followed at a distance by Spain (20%) and France (12%). It is clear that most pork imports come from the European Union, which together accounted for 92%.
MARKETING CHANNELS / VALUE CHAIN
OPPORUNITIES AND CHALLENGES
STRENGTHS AND WEAKNESSES
MARKET INTELLIGENCE
Export tariffs
Import tariffs
25 . member of WTO) and duty free for SADC members with an exception of rib product. The rib product coded as the highest imported product was duty free for all countries.
PERFORMANCE ANALYSIS OF SOUTH AFRICAN PORK INDUSTRY IN 2017
Exports
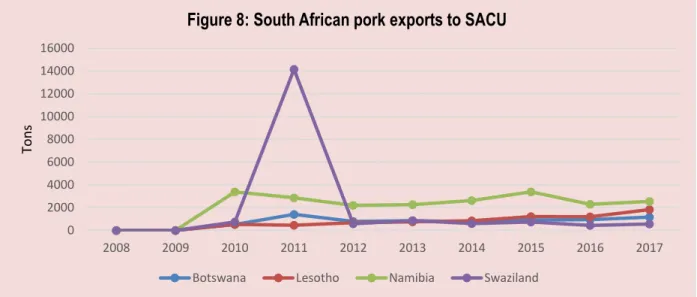
During this year, South Africa exported a total of 9 305 tonnes of pork (fresh, chilled or frozen) with an average value of USD 2 677/unit. The main export destinations for pork (fresh, chilled or frozen) originating in South Africa during 2017 were Namibia, Mozambique, Botswana, Lesotho and Swaziland. Most of South Africa's pork exports (fresh, chilled or frozen) were exported to Namibia which commanded 26.2% followed by Mozambique which commanded 22.4% and Botswana with 16.6%.
South Africa's exports of pork (fresh, chilled or frozen) increased by 5% in value and 9% in quantity between 2013 and 2017. During the same period, exports of pork (fresh, chilled or frozen) to Namibia decreased by 1% in value and increased by 1% in quantity. Between 2016 and 2017, South African pork exports (fresh, chilled or frozen) to the world increased by 36%.
In the same periods, exports to Namibia increased by 30%, Mozambique and Botswana by 30% and 45%. The figure illustrates that between 2013 and 2017; Pork exports (fresh, chilled or frozen) from South Africa to Angola, the Seychelles, Zambia, Congo and Swaziland grew at a rate lower than the growth in imports from the rest of the world. During the same period, exports of South African pork (fresh, chilled or frozen) to Lesotho, Mozambique, Democratic Republic of the Congo (DRC), Congo, Botswana, Namibia and Hong Kong, China grew at a rate greater than their imports of the rest of the world.
Lesotho and Mozambique represent gain in the dynamic market and Angola, Zimbabwe and Swaziland represent loss in the declining market for South African pork exports (fresh, chilled or frozen). Hong Kong, China is the largest market with a world share of 3.33% and South Africa's export growth of 99%. The analysis in the figure above shows that Namibia commanded the largest share of South African pork exports (fresh, chilled or frozen) at 26.2% during 2017, followed by Mozambique at 22.4%.
If South Africa wants to diversify its pork exports (fresh, chilled or frozen), the largest market exists in China due to the share of world pork imports (fresh, chilled or frozen ) of 7.49%.
Imports
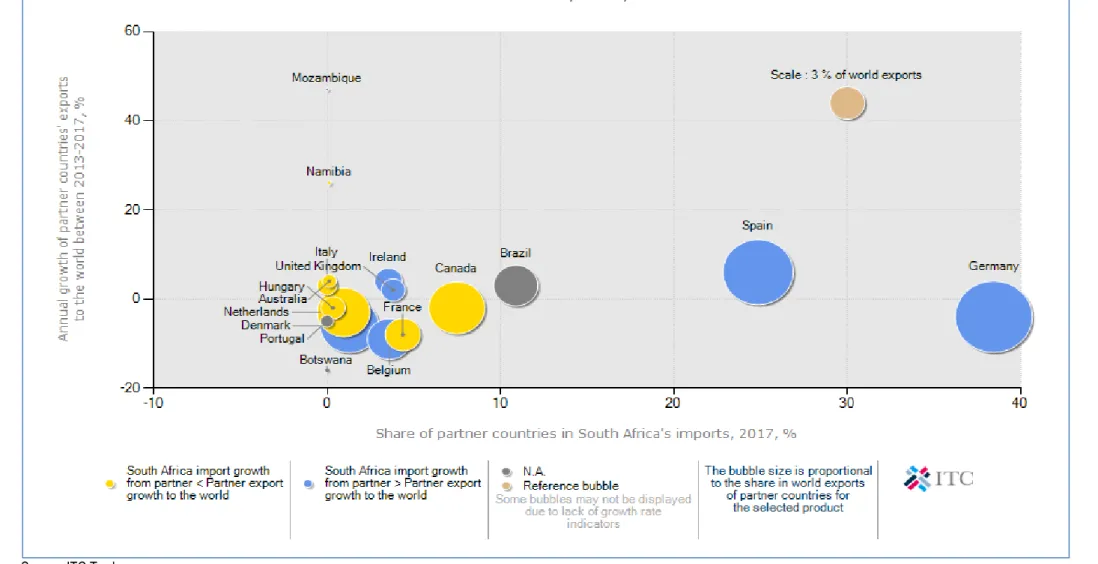
South Africa's imports represent 0.2% of world imports for pork (fresh, chilled or frozen) and its world import rank is 40. South Africa's pork imports (fresh, chilled or frozen) frozen) increased by 4% in value and 2% in quantity between the periods 2013 and 2017. In the same period, imports of pork (fresh, chilled or frozen) from Germany decreased by 3% in value and 5 % in quantity and imports from Spain increased by 44% in value and 46% in quantity.
During the same period, pork imports (fresh, chilled or frozen) from Germany increased by 45% while Spain decreased by 18%. The figure illustrates that South African pork imports (fresh, chilled or frozen) from Canada, France, the Netherlands, Italy, Australia and Hungary were growing at a rate that is less than their export growth in the rest of the world. It can also be noted that the annual growth of imports into South Africa from the countries mentioned has decreased.
At the same time, South Africa's pork (fresh, chilled or frozen) imports from Spain, Ireland, Denmark, Belgium, United Kingdom and Germany grew at a rate greater than their exports to the rest of the world. The analysis shows that Spain and Germany had the largest shares of South Africa's pork (fresh, chilled or frozen) imports during the year 2017. Germany is the largest supplier of pork (fresh, chilled or frozen) with a share of 38.45% in South. African import market followed by Spain with 24.96%.
Germany remains the largest pork import market with a world market share of 15.81%, followed by Spain with a world import of 13.5%. Therefore, if South Africa wants to diversify, South Africa can increase its imports from Canada because South Africa's growth is less than Canada's export growth to the world.
ACKNOWLEDGEMENTS