The climate change datasets from downscaled Global Circulation Models used in this article are provided by the CSIR and by CSAG. Similarly, the climate change datasets from downscaled Global Circulation Models used in this article were provided by the CSIR and by CSAG.
INTRODUCTION AND BACKGROUND
Aims and Objectives
Overview of Dissertation Structure
The relative impacts of climate change on the selected WQ constituents were assessed by observing changes between two time periods, i.e. This paper links the biophysical aspects of water quality management and the expected impacts of climate change on nutrient and sediment transfer processes described in the first and second papers (Chapters 3 and 4) with the more applied aspects of adaptive water quality management, policy development and governance, both of which are presented in Chapter 2.
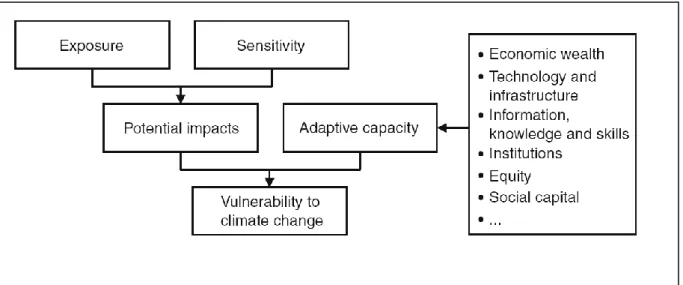
Vulnerability and Adaptation in the Context of Climate Change and Water
- Introduction
- Vulnerability and Adaptive Capacity as Determinants of Adaptation
- Vulnerability and Adaptation in Policy Development and
- Vulnerability and Adaptation in Water Quality Management
The following section highlights the differences between adaptation in the context of policy development and governance and adaptation in the context of water quality management. However, in the context of water quality management, vulnerability and adaptation are more about "end-pipe" factors.
Contemporary Issues in Water Quality Management
- Introduction
- Water Quality Management in Context
- Challenges in Water Quality Management
- Adaptive Water Quality Management
- Non-Point Source Pollution
- Critical parameters and processes
The next part is an introduction to the most critical challenges in water quality management. Successful water quality management must take into account the role that humans play in water quality fluctuations in the catchment (Bennet et al., 2005; Lynam et al., 2009).
Assessing the Impacts of Climate Change on Water Quality
- Introduction
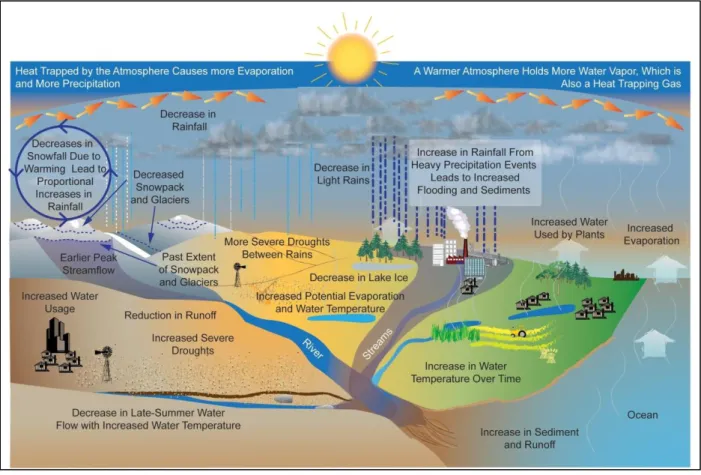
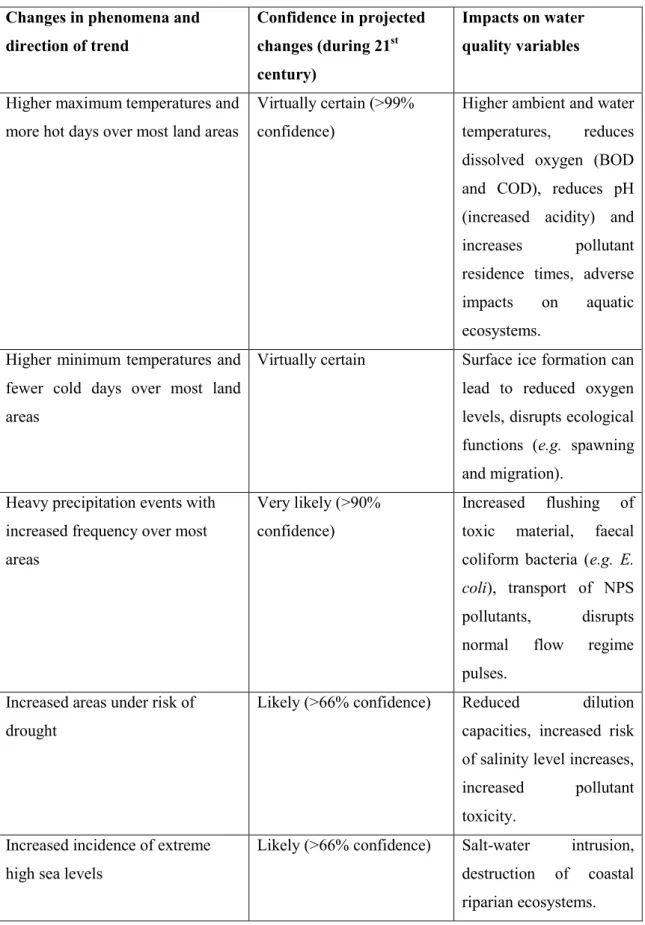
- Climate Change and Water Quality: Impacts and Responses
- Managing the Impacts of Climate Change on Water Quality
The shares of the different agricultural production systems in the catchment area are shown in table 4.1. The potential impacts of climate change on water quality in the Mkabela catchment were evaluated with and without wetland impact on the response of WQ variables. Consequently, the most adverse climate change-related impacts are expected to occur in the developing regions of the world, of which South Africa is a part (Bates et al., 2008).
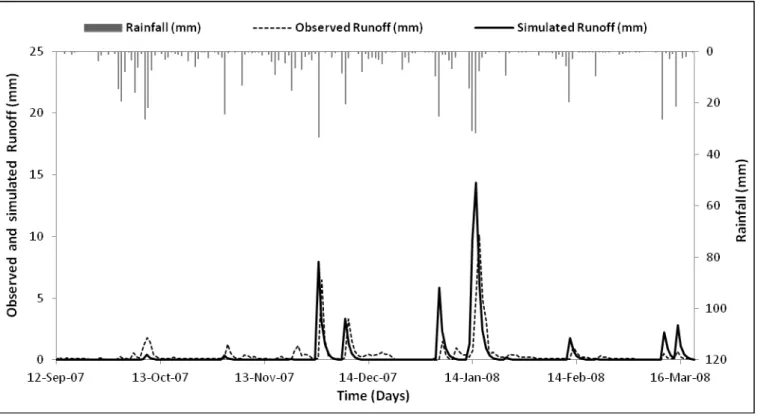
The simulation of runoff processes (from rainfall measured within the catchment) was carried out for 3 individual hydrological response units (HRUs) located in the headwaters of the Mkabela catchment (Figure 6.4).
Introduction
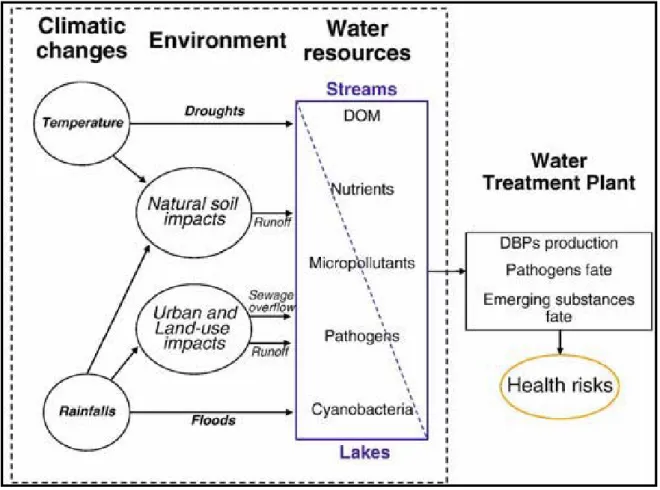
Like Rosberg and Arheimer (2007), Jennings et al., (2009) and Donohue et al., (2005) also note that sediment and nutrient transfer from non-point or diffuse sources is highly sensitive to climatic factors (see Section 2.3.2). Given the views of Jennings et al., (2009) and Donohue et al., (2005), and the high variability of the South African hydroclimatic environment (Schulze et al., 2005), significant changes in the dynamics of NPS sediment and nutrient transport can be expected with projected climate change.
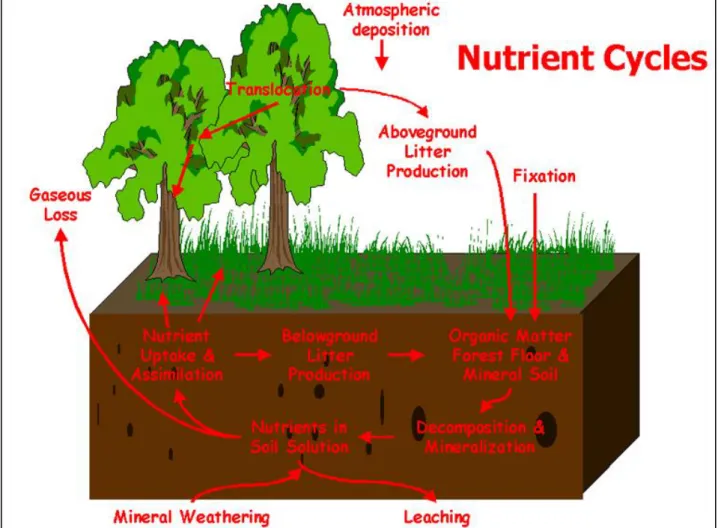
Nutrient and Sediment Transfer Processes in the Environment
- Nutrients
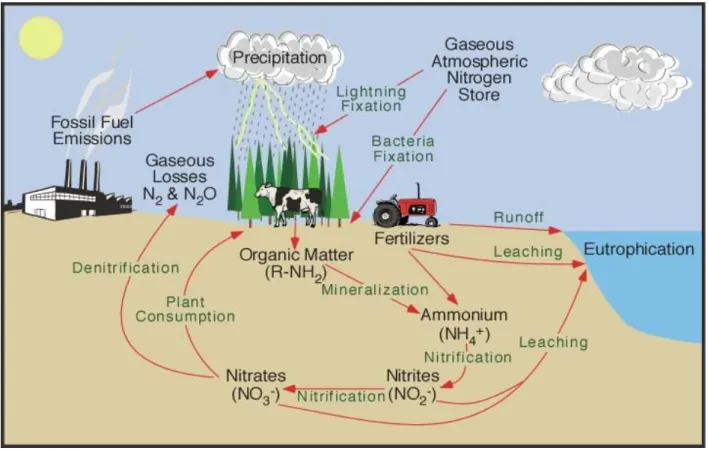
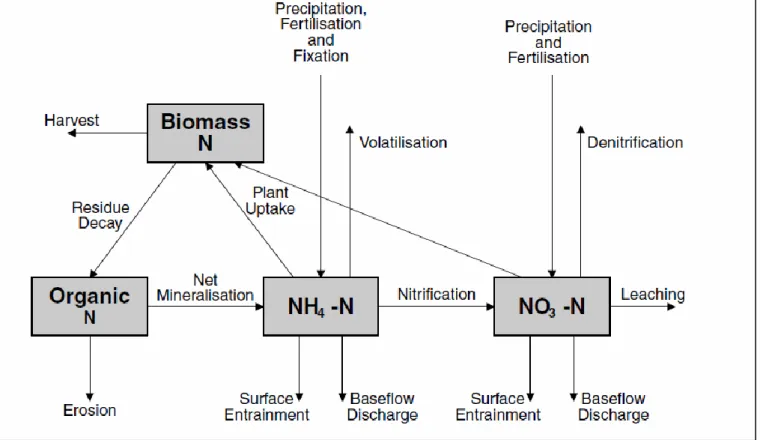
- Nitrogen
- The Nitrogen Cycle
- Nitrogen Migration
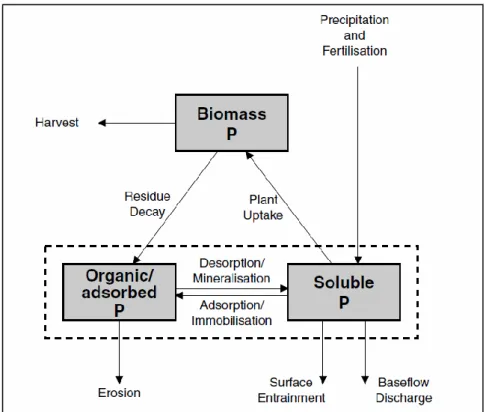
- Phosphorus
- The Phosphorus Cycle
- Phosphorus Migration
- Catchment Scale Sediment Transfer
The connectivity of landscape compartments influences sediment transport processes in response to external disturbances of different frequency and magnitude (Fryirs et al., 2007). Furthermore, the connectivity of landscape compartments influences sediment transfer processes in response to external disturbances of different frequency and magnitude (Fryirs et al., 2007).
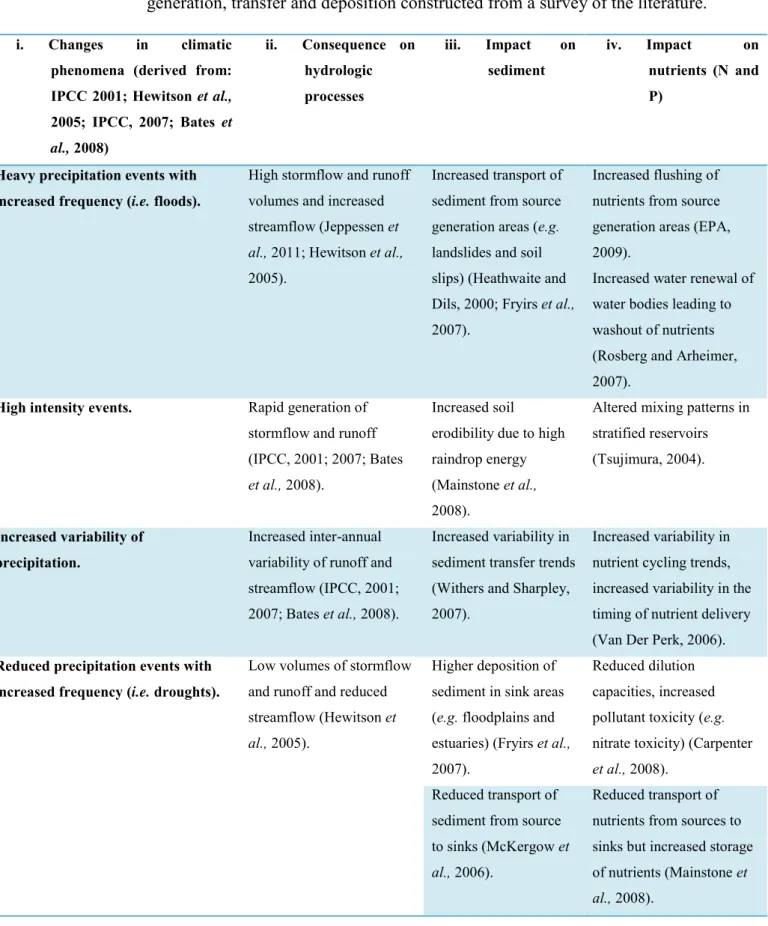
Impacts of Projected Hydro-Climatic Changes on Sediment and Nutrient
- Impacts of Altered Precipitation Variability
- Impacts of Temperature Changes
Increased sediment transport from source areas (e.g. landslides and landslides) (Heathwaite and Dils, 2000; Fryirs et al., 2007). Reduced nutrient transport from sources to sinks, but increased nutrient storage (Mainstone et al., 2008).
Discussion and Conclusions
In most cases, the expected increases in temperature and rainfall intensity are expected to lead to an increase or worsening of the rate at which these processes will occur. For example, the western regions of the country are expected to experience reduced rainfall and increased temperatures.
Acknowledgements
Therefore, regardless of whether climate change results in "positive" impacts (e.g., increased runoff from high-precipitation events) or "negative" impacts (e.g., increased risk of floods and droughts), the development of the necessary adaptation strategies requires an approach that recognizes both ends of the spectrum (ie "positive" and "negative" consequences of climate change) to ensure that flexibility is incorporated into these strategies.
Climate Change and Water Resources in Southern Africa: Studies on Scenarios, Impacts, Vulnerabilities and Adaptation. Projected impacts of climate change and mitigation effects of a perennial wetland on selected water quality constituents in the Mkabela catchment.
Introduction and Background
Therefore, assessing the links between biophysical processes, climate change and adaptation is of great importance in the pursuit of reducing vulnerabilities and building adaptive capacity (see Chapter 6). Additionally, the effects of a single wetland system located in the Mkabela catchment in mitigating the aforementioned climate change impacts on selected WQ components are described in this paper.
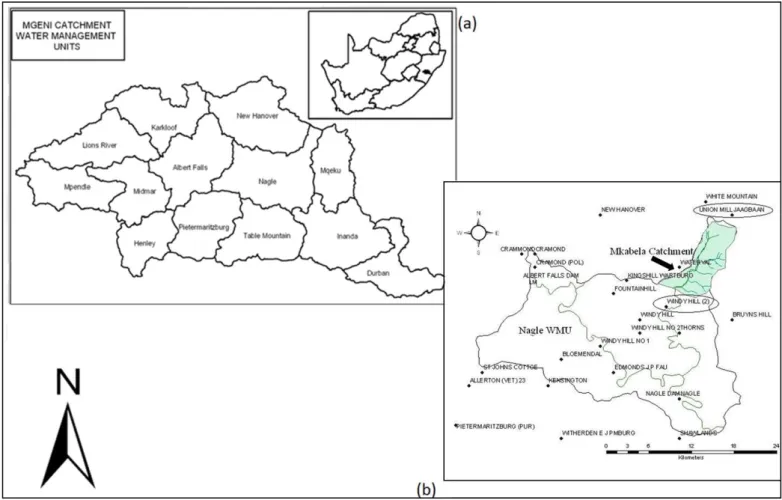
Site Description
Delineating the catchment in this way enabled the isolation and observation of the pathways and processes that control the generation, transport and deposition of agricultural pollutants across the Mkabela catchment (see Lorentz et al., 2010 for further details on the delineation of this catchment area). Also indicated in Figure 4.3 is the land use distribution of the Mkabela catchment and model relevant sub-catchment numbers.
Description of the ACRU-NPS Model
The most important of these parameters are alphaQ and betaQ which control daily discharges and loads entering and leaving the wetland. AlphaQ and betaQ are adjusted according to the rate at which the wetland is losing water.
Input Data Acquisition and Processing
- Observed Climate Data
- Climate Change Projections Considered
- Additional Input Data
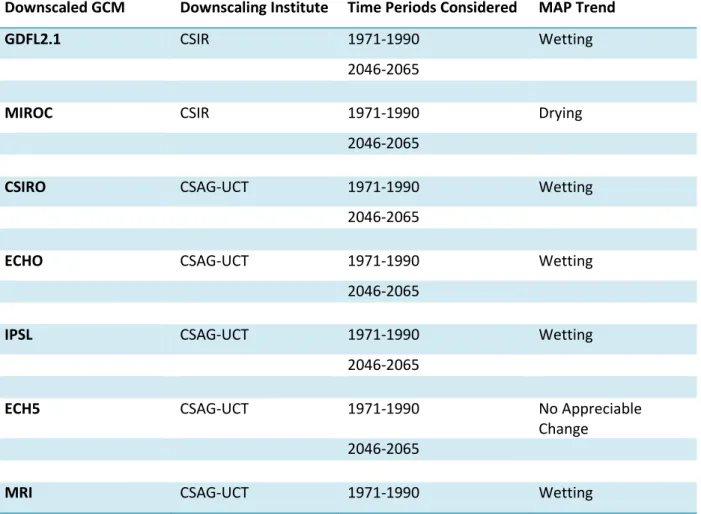
Therefore, only the “strongest” downscaled GCM (i.e., GFDL2.1 GCM) and the “driest” downscaled GCM (i.e., MIROC GCM) were selected from the CSIR GCM ensemble based on projected changes in MAP (see Engelbrecht et. al., 2009 ). The climate data and in particular the rainfall data obtained from the downscaled GCMs for the Nagle WMU were not adjusted or post-processed in any way for the Mkabela catchment as the catchment was considered to be located relatively close to the points of interest of the downscaled GCMs (i.e. the Nagle WMU). .
Simulations Performed
Also indicated in this diagram is the flow direction from each HRU in the headwaters of the Mkabela catchment to the wetland and ultimately the catchment outlet.
Results
- Verification of the ACRU-NPS Model
- Impact of the Wetland on the Transfer of NPS Pollutants
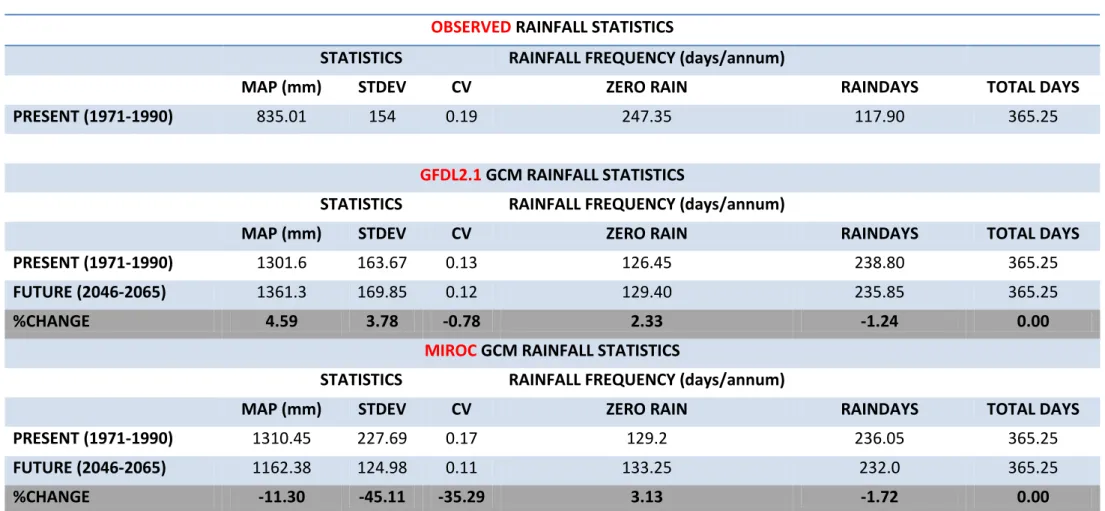
- Comparison of Present GCM Climate with Observed Climate
- Projected Impacts of Climate Change
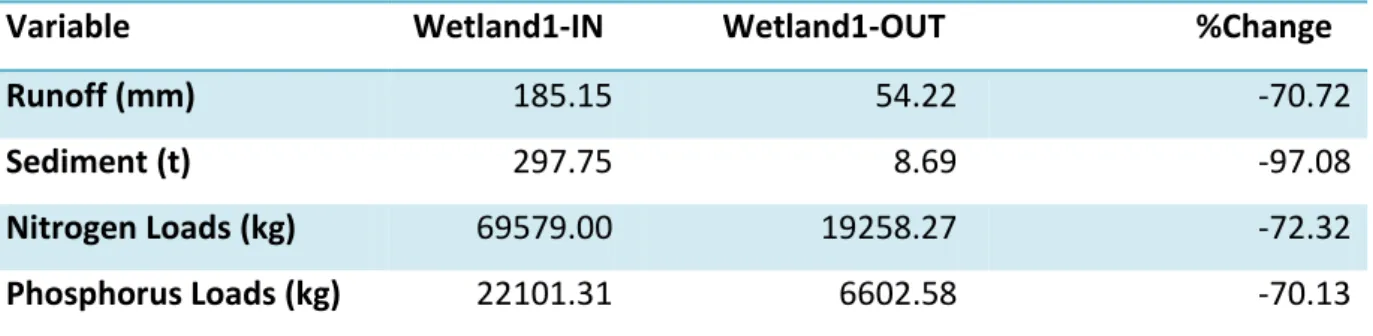
Mean annual estimates of N and P appear to follow the trend of runoff relative to retention in the wetland (Table 4.5 and Figures 4.8 and 4.9). Figures 4.9 and 4.10 show the potential impacts of climate change and the potential impacts of wetlands under climate change (ie under future conditions) on the formation and transfer of the WQ variables considered.
Discussion and Conclusions
In the same vein, more than half of the downscaled GCMs predicted increases in nutrients and sediments, but there was no consensus on the magnitude of these changes. In terms of the actual impacts of climate change, this study found that climate change will potentially lead to an increase in precipitation and runoff in the study catchment, regardless of the variability inherent in the different downscaled GCMs (Table 4.7).
Acknowledgements
Ed) Climate change and water resources in southern Africa: studies on scenarios, impacts, vulnerabilities and adaptation. Ed) Climate change and water resources in southern Africa: studies on scenarios, impacts, vulnerabilities and adaptation.
Introduction
Daily precipitation data obtained from historical observations and from the downscaled GCMs were assessed at a daily time step resolution. As this study will demonstrate, downscaled GCMs do not necessarily reflect the exact nature of precipitation characteristic of a specific point within a given watershed.
Methodology
- Observed Rainfall Data Acquisition and Treatment
- Climate Change Projections Considered
As already mentioned in the introduction, the climate change projections used in this study were derived from 7 downscaled GCMs. The GCMs downscaled by CSAG all represented wet climate change projections with variations in rates of change in MAP.

Results and Discussion
Also shown in this table are the relative changes in annual precipitation distribution between current and future time periods for the downscaled CSIR GCMs used in the study. Also shown in this table are the relative changes in the annual distribution of precipitation between the current and future time periods for the downscaled CSAG GCMs used in the study.
Conclusions
As the results of this study have shown, the development of adaptive strategies should focus more on the strong relative changes presented by climate change. This will also make it possible to adapt to the projected increased climate variability and the resulting increased uncertainty posed by climate change.
Acknowledgements
This will not only ensure that relevant strategies and policies are formulated, but it will also lend credibility to predictive climate change models.
Uncertainty in the availability of water resources in the Okavango River Basin due to climate change. This paper also presents a framework that can be applied in the adaptive management of water quality under climate change.
Introduction
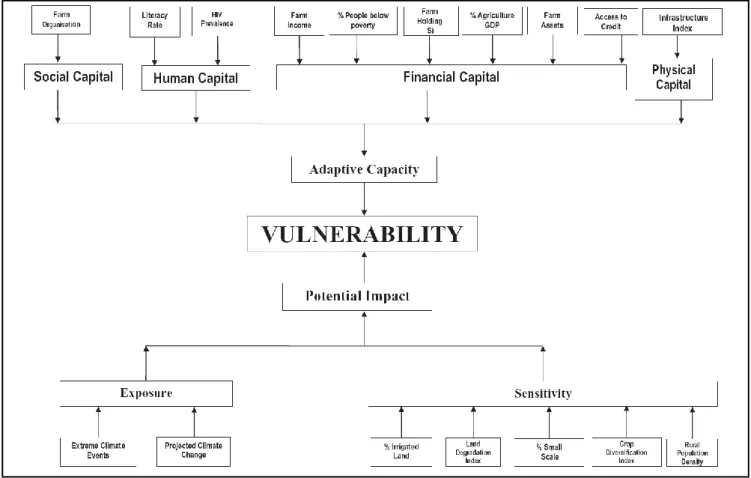
Also included in the next section is an assessment of the vulnerability and potential for adaptation characteristic of the Mkabela catchment as informed by the ACRU-NPS simulations. Regional factors (eg the prevalence of urban areas) that would influence the development of the adaptive water quality management framework could not be addressed.
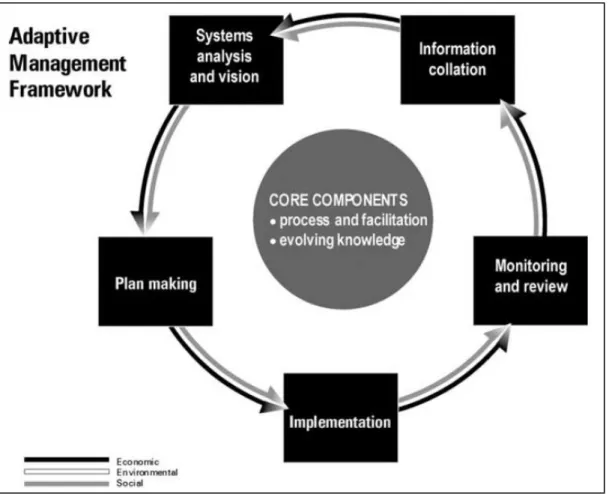
An Adaptive Water Quality Management Framework
Methodology
- Study Area
- Input Data Acquisition and Processing
- Simulations Performed
As described in Chapter 4, the water quality modeling work in this study was carried out in the Mkabela catchment, approximately 1 km east of the town of Wartburg, near Pietermaritzburg, South Africa (Figure 6.3). In this study, source-pathway response modeling of the Mkabela catchment was conducted with the intention of understanding the impact of agricultural NPS pollutants on the water quality of hydraulic controls in the catchment.
Results and Lessons Learnt
- Verification of the ACRU-NPS Model
- Impact of the Wetland on the Transfer of NPS Pollutants
- Projected Impacts of Climate Change
- Summary of Results
Mean annual estimates of N and P appear to follow the trend of runoff relative to retention in the wetland (Table 6.3). In contrast, the M IROC GCM predicts reduced runoff and less nutrients and sediment going into the wetland.
Adaptive Water Quality Management
- Vulnerability and Potential for Adaptation as Informed by the
- Adaptive Management of Nutrients and Sediment Transport
- Assessment of the Adaptive Water Quality Management
Rather, it serves to emphasize the need to recognize the importance of the wetland in nutrient and sediment attenuation and the importance of having the appropriate management strategies in place to protect the water quality of downstream fluvial systems. As previously mentioned, South African agricultural catchment areas are a kaleidoscope of relatively simple (eg the Maize Triangle in the Free State Province) to highly complex (eg mixed crops in the KwaZulu-Natal Midlands) systems.
Discussion and Conclusions
Acknowledgements
SYNTHESIS AND RECOMMENDATIONS FOR FUTURE RESEARCH
Recommendations for Future Research