The second part of this study focused on investigating the relationship between vegetation types (increasing and decreasing species) and different levels of pasture degradation. Overall, the study demonstrated the potential of remote sensing techniques to classify different growth species representing levels of pasture degradation.
Plagiarism
Publications and manuscripts
Background
However, it has been determined that a total of 10 to 20% of the pasture area is seriously degraded (Reynolds et al., 2007). The continued degradation of communal rangelands poses a major threat to livestock production, biodiversity and human livelihoods (Hoffman et al., 1999).

Increaser and decreaser species
Declining species are species that predominate in pastures in good condition, but decline greatly when the pasture is degraded by over- or under-utilization (Hardy et al., 1999). Increasing species have been classified into the following four types: increasing I, increasing IIa, increasing IIb, increasing IIc and increasing III (Oluwole and Dube, 2008; Trollope et al., 1990).
Remote sensing of increaser species: Challenges and opportunities in degraded areas
Currently, hyperspectral remote sensing is considered one of the most advanced techniques for species-level discrimination due to its detailed features at many spectral wavelengths, very fine and close proximity (Vaiphasa et al., 2007). However, despite the detailed spectral information of hyperspectral data, processing tends to be more difficult due to the statistical properties associated with high-dimensional data, the high cost of imagery, and the need for an excessive number of field samples. (Bajcsy and Groves, 2004; Vaiphasa et al., 2007).
Study objectives
Scope of the study
General description of the study area
- Okhombe
- Cathedral Peak
Therefore, large parts of the study area have been severely degraded, resulting in loss of grass cover, increased runoff, poor water infiltration, and severe soil erosion (Everson et al., 2007). The study was also conducted in the Cathedral Peak KZN Wildlife Conservation Area (longitude 29° 00' E to 29° 30' L and latitude 28° 45' S to 29° 15' S), which located in the northern part of uKhahlamba-Drakensberg park.

Outline of the thesis
The gap and need for using decreasing and increasing species as indicators of rangeland degradation is also discussed. The abundance and distribution of different types of vegetation can be used to indicate the level of gradient of degradation of rangelands.
Introduction
The application of multispectral and hyperspectral remote sensing techniques provides accurate and timely information for vegetation cover mapping and monitoring. The shortcomings of the above-mentioned studies are that no specific review has focused on the application of multispectral and hyperspectral remote sensing techniques to map and classify increasing and decreasing species as indicators of different levels of land area condition.
Assessing and monitoring rangeland degradation using different traditional field-based
The remote sensing technique provides fast and repeatable data (including detailed information on vegetation status) and is accurate and potentially inexpensive, and thus can successfully assess the degradation of rangeland areas over a large region ( Tanser and Palmer, 1999; Wessels et al., 2008). Although previous studies provided reasonable results in mapping the degradation of rangeland areas based on vegetation communities using conventional field-based methods and remote sensing, more attention should be paid to the issue of how to improve the accuracy of species-level map adders and subtractors. in order to identify the different levels of degradation of the mountain ranges.
Spectral properties of vegetation species in degraded areas
In the NIR, a plant leaf will typically reflect between 40 and 50%, while the rest is transmitted, with only about 5% being absorbed (Govender et al., 2009). In green leaves, reflectance and transmittance in the short wave infrared (SWIR) are affected by water absorption (Ustin et al., 2009).
Application of multispectral remote sensing in mapping vegetation species in degraded areas
They concluded that hyperspectral remote sensing has significant potential for the discrimination and mapping of these species with an overall accuracy of 95%. In general, there are limitations to the use of hyperspectral remote sensing for vegetation discrimination at the species level.
Improving the classification accuracy of vegetation species using the advanced multispectral
More studies are needed for mapping and classifying vegetation types, especially the increasing ones, to build a spectral library for rangelands in degraded areas. Research into the classification of vegetation types using WorldView-2 data has yielded promising results.
Improvement of vegetation spec ies‟ classification using spectral vegetation indices
Increased species classification has inconsistencies due to the responses of different species under different ecosystems, and thus the understanding of their ecophysiological mechanisms is still unclear. The authors recorded an overall accuracy of 91% and 88% for SPOT 5 and ALI images, respectively. 2010) tested seven vegetation indices for mapping five classes of mangrove species—namely Avicennia, Avicennia-Sanneratia, Acanthus-Sanneratia, Mixed Sanneratia, and Mixed Acrostichum—in Kelantan, Malaysia, using Landsat TM data.
Overall challenges and opportunities in applying remote sensing in degraded environments 31
The results revealed a lack of availability of techniques for quantifying indicators of pasture degradation. The potential use of decreasing and increasing species as indicators of pasture degradation was highlighted.
Introduction
Declining species are species that dominate in veld in good condition, but decline greatly when the veld is degraded by over- or under-utilization (Hardy et al., 1999). Increasing species are species that increase their relative abundances through overgrazing or underutilization, and these species therefore indicate that a pasture is in poor condition (Dobarro et al., 2010; Van Oudtshoorn, 1992).
Material and Methods
- Data collection
- Veld condition assessment
- Basal cover
- Species diversity index
- Soil assessment
A secondary objective was to evaluate the success of the Landcare project in combating land degradation in Okhombe Local Government Area. Where BC is basal cover, D is the mean distance (cm) from a point to the nearest tuft, and d is the mean basal diameter (cm) of the tuft.
Results
- Botanical composition
- Changes in basal cover as an indicator of rangeland degradation
- Variations in species diversity in response to rangeland degradation
- Changes in soil properties as an indicator of rangeland degradation
26 species were recorded in the rehabilitated and degraded areas, and 28 species in the preserved area. Species richness was highest in the preserved area (29) and lowest in degraded areas (<23).

Discussion
- Changes in botanical composition and basal cover
- Variations in species diversity in response to rangeland degradation
- Changes in soil properties as an indicator of rangeland degradation
The results show that there was a decrease in soil pH in the degraded areas (2.71) compared to the conserved and rehabilitated areas (4.18 and 4.00). C and N were significantly lower (P < 0.05) in the rehabilitated and degraded areas compared to the conserved area (Table 3.5).
Conclusions
The results showed that Okhomba communal area is exposed to pasture degradation as indicated by low belt conditions. Differentiating between growing species (species that indicate over- and under-exploitation) is important for mapping rangeland degradation.
Introduction
The Random Forest (RF) algorithm developed by Breiman (2001) has recently been used to predict or classify features of interest (Adam et al., 2009; Ismail, 2009; Pal, 2005). The random forest algorithm is a bagging operation. where multiple classification trees are built based on a random subset of the training data set (ntree) (Breiman, 2001). Based on the random classification of forests, the FVS method was performed for the entire WorldView-2 bands (n = 8), spectral vegetation indices (n = 24), and combined bands and vegetation indices (n = 32) in the classification of four magnifiers. types (HH, EC, SA and AD). The top 6 bands ranked by OOB error gave the lowest OOB error (17.36%) (Figure 6.4-A) compared to using the entire bands (n = 8 ), which yielded 20.53%.
Material and methods
- Field data collection
- The identification of vegetation species
- Canopy spectral measurements
Data analysis
- One-way ANOVA
- Band selection using discriminant analysis
- Stepwise discriminant function analysis (SDA)
- Canonical function analysis (CFA)
Discriminant function analysis is a technique used to determine which variables distinguish between two or more groups (Fisher, 1936). Canonical function analysis (CFA) is a multivariate analysis technique to determine functions of the variables that can be used to distinguish between the groups (Manly, 2005).
Classification accuracy assessment
Results
- One-way ANOVA test
- Stepwise discriminant function analysis results
- Canonical function analysis
The greater the standardized coefficient, the greater the contribution of the variable (wavelength) to the distinction between the four species. Of the original clustered species, 83.02% were correctly classified by us, and 77.36% of the cross-validated clustered species were correctly classified.

Discussion
- One-way ANOVA
- Band selection using stepwise discriminant function analysis (SDA)
- Canonical function analysis
On the other hand, HH aged at the end of the season so that the leaves were completely dehydrated compared to those of EC and SA (Theron, 1966). This is mainly explained by the difference in pigments and other optical characteristics of the leaves of the different species (Kumar et al., 2001; Ustin et al., 2009; Van Aardt and Wynne, 2001).
Conclusions
The development of techniques to estimate and map larger grass species is critical to a better understanding of rangeland condition and levels of rangeland degradation. These wavelengths are located in the visible, red-edge and near-infrared regions of the electromagnetic spectrum.
Introduction
Increasing species are those that increase their relative abundance through grazing or underutilization, and therefore indicate the poor condition of the rangeland (Dobarro et al., 2010; Van Oudtshoorn, 1992). Hyperspectral remote sensing data are acquired using space-based, airborne sensors and a portable spectrometer (Adam et al., 2009).
Material and methods
- Field data collection
- The identification of increaser grass species
- Canopy spectral measurements
These spectral measurements from each plot (n= 20 to 25) were then averaged to represent the spectral reflectance of the vegetation plot (n = 308). The spectral measurements were then resampled to AISA Eagle spectral resolution using ENVI 4.3 image processing software (Mutanga, 2005) (Figure 5. 2).
Data analysis
- Measuring variable importance using the random forest algorithm (RF)
- Forward variable selection
- Classification accuracy assessment
Therefore, forward variable selection (FVS) was used to determine the optimal number of wavelengths based on the random forest measurement of variable importance (Adam et al., 2009; Ismail and Mutanga, 2010). The optimal number of wavelengths that yielded the smallest error rate as determined by the three methods (OOB, independent test dataset, and .632+ bootstrap) was then used to classify the augmentation type.
Results
- Optimization of ntree and mtry
- Variables importance using the random forest algorithm
- Forward variable selection
- Classification accuracy
The optimal number of wavelengths, which gave the lowest OOB and bootstrap error, is indicated by an arrow. An independent set of test data was used to test the reliability of the OOB error for classification accuracy.

Discussion
- Optimization of ntree and mtry
- Variables importance using the random forest algorithm
- Classification accuracy
The reliability of the OOB error for classification accuracy was tested using an independent test data set that yielded an overall accuracy of 87.50% and a KHAT value of 0.83. The difference in overall accuracy between the training data set and the independent test data was less than 3% (Table 5.2), confirming the stability and reliability of the OOB error (Lawrence et al., 2006).
Conclusions
There was no significant improvement in the classification of larger species using a combination of the raw WorldView-2 bands and the spectral vegetation indices. Overall, the study demonstrated the potential of the WorldView-2 data for improving increased separability at the species level.
Introduction
Images from these sensors, such as Hyperion, HyMAP and AISA Eagle, enable species-level vegetation mapping (Kumar et al., 2001; Mutanga and Skidmore, 2004). Furthermore, many hyperspectral wavelengths are redundant when it comes to plant species studies (Adam et al., 2009; Mutanga and Kumar, 2007; Mutanga and Skidmore, 2004).
Material and methods
- Image acquisition and pre-processing
- Field data collection
- Spectral vegetation indices
- Statistical analysis
- The random forest algorithm (RF)
- Forward variable selection
- Image classification
The random forest algorithm was used to measure the importance of each WorldView-2 band and index in classifying the increase species and also to select the optimal number of bands for better classification accuracy (Adam et al., 2009). A limitation of the random forest algorithm, when it comes to measuring importance of variables, is that it does not automatically select the optimal number of variables that produces the best classification accuracy (Adam et al., 2009).

Results
- Model optimisation
- Variables importance using the random forest algorithm
- Variable selection using the OOB method
- Classification accuracy
The combined bands and vegetation indices (n = 32) gave an OOB error rate of 14.89%. The most important variables (bands, vegetation indices, and combined bands and vegetation indices) were those with the largest average reduction in accuracy (Figure 6.3). Nine of these vegetation indices are similar to vegetation indices published in the literature and selected in the first step (VGI, VARI, MSR-1, MND, SIPI, TCARI, SR, PSRI, MCARI and GI). The results showed that most of the vegetation indices that could distinguish between growing species were calculated from bands located on the blue, green, red and red edges.

Discussion
- Variables importance using the random forest algorithm
- Classification assessment
The successful use of this algorithm for the classification of magnification species with only a few bands confirmed its usefulness as a variable selection method (Lawrence et al., 2006). The successful use of the random forest algorithm for classifying increasing species, with a subset of only a few wavelengths and vegetation indices, confirmed its usefulness as a feature selection method (Lawrence et al., 2006).
Conclusions
The results showed that the optimal bands (n = 6) for distinguishing increasing species are in the visible part and the red edge part of the electromagnetic spectrum. The results also demonstrated the reliability and robustness of the random forest algorithm as a variable selection and classification algorithm in distinguishing increasing species.
Introduction
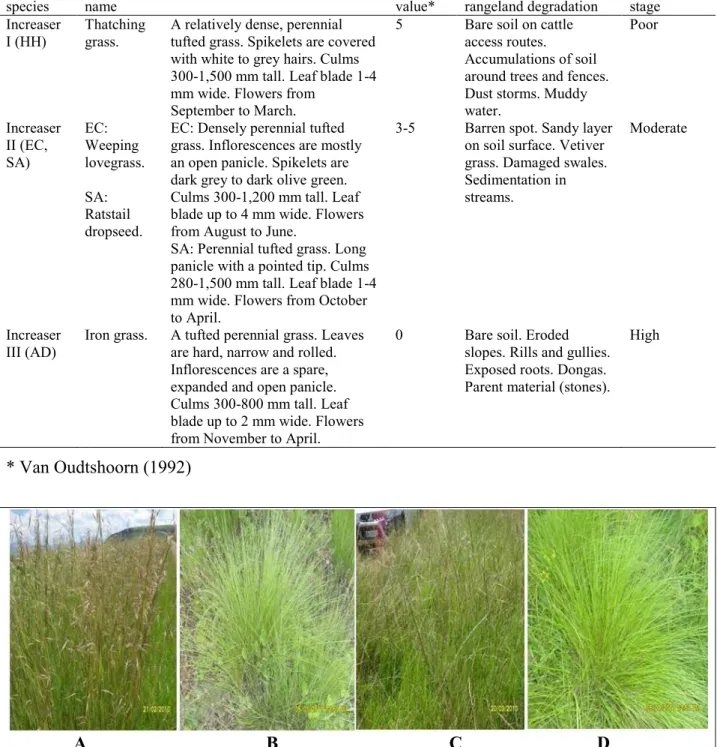
Increasing species have been classified into three types, namely increasing I, increasing II and increasing III (Oluwole et al., 2008; Trollope, 1990). The relative abundance and distribution of the different propagation species can be used to indicate the gradient of pasture degradation (Oluwole et al., 2008; Trollope, 1990; Van Oudtshoorn, 1992) (Table 7.1).
Rangeland condition assessment using vegetation abundance and composition
To investigate the potential use of the new 8-band WorldView-2 imagery in classifying four types of ascending. Significant wavelengths (n = 439) were used in subsequent analysis to select optimal wavelengths in enhanced species discrimination using stepwise discriminant function analysis.
The potential use of hyperspectral remote sensing for increaser species
The random forest algorithm and forward variable technique was able to identify the optimal wavelengths (coast blue, yellow, red edge, blue, green and red) for classification of the four augmented species with an overall accuracy of 82% and a KHAT value of 0 .76 (Table 7.6). Overall, the relatively high classification accuracy achieved by the raw bands and vegetation indices in the study demonstrated the potential of WorldView-2 data for increased species separation.

Conclusions
The use of remote sensing techniques has great potential to identify different levels of degradation based on Auger species. The use of selected spectral vegetation indices calculated from WorldView-2 multispectral satellite imagery improved the overall classification accuracy from 82% (raw belts) to 90% (vegetation indices) of rangeland vegetation at the ascending species level.
Recommendations
A national review of land degradation in South Africa: the influence of biophysical and socio-economic factors. Assessing the effects of human-induced land degradation in the former homelands of northern South Africa with a 1 km AVHRR NDVI time series.


