Finally, the study investigated the ability of narrow vegetation indices based on NDVI calculated from hyperspectral data in predicting papyrus green aboveground biomass. Overall, the study demonstrated the potential of remote sensing techniques in distinguishing papyrus swamps and coexisting species and in predicting biomass.
Publication and manuscripts
Papyrus swamps (Cyperus papyrus .L) in African wetlands
Despite its relative importance, the existence of papyrus vegetation is endangered due to agricultural intensification and human intervention in many parts of Africa (Maclean et al., 2006; Owino and Ryan, 2007). To understand the spatial distribution of papyrus marshes and to monitor their functions in the landscape, there is a critical need to develop real-time techniques for modeling the spatial distribution and prediction of its biomass for rapid assessment and proactive management of marshes. of papyrus. .
Hyperspectral remote sensing
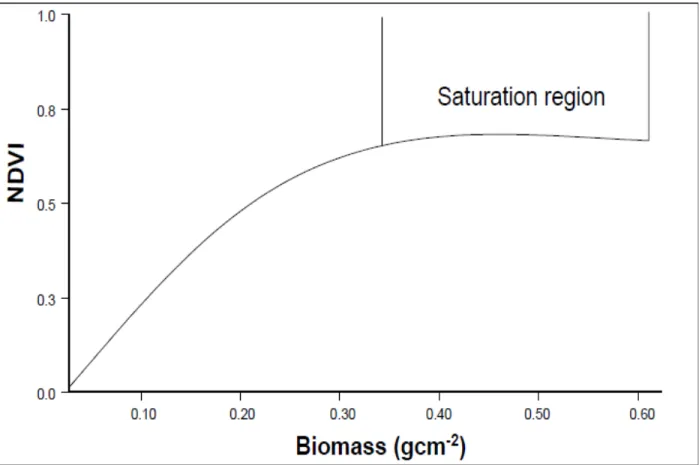
Therefore, it is hypothesized that hyperspectral sensors can help overcome limitations of spatial and spectral methods when using the wider bands of multispectral scanner systems, such as the mixed pixel problem in mapping vegetation species and the saturation problem in estimating biomass in denser and higher canopy vegetated areas. Measurements were made at the field level using the Analytical Spectral Devices (ASD) FieldSpec®3 spectrometer with 2151 spectral bands from 350 nm to 2500 nm and at the airborne platform level using the AISA Eagle sensor with 231 spectral bands from 393 nm to 900 nm.
Challenges and opportunities: remote sensing of papyrus vegetation
- Discriminating papyrus vegetation using hyperspectral data
- Assessment of papyrus quantity using hyperspectral data
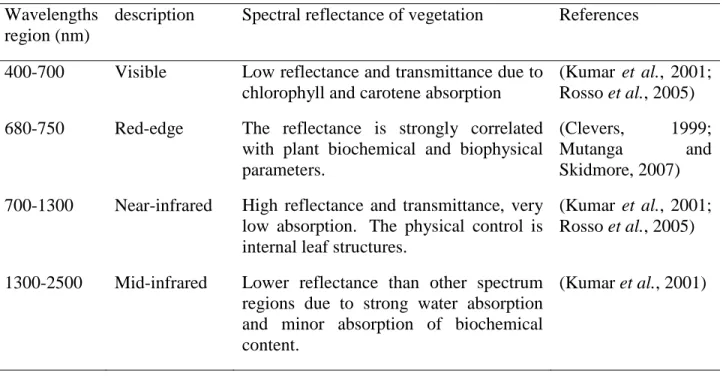
IRIS (Infrared Intelligent Spectroradiometer) narrowband spectrum for fresh green vegetation compared to discrete wavebands of multispectral LANDSAT TM (Kumar et al., 2001). Measurement of biophysical parameters of papyrus vegetation, such as biomass, is important for quantifying primary production or carbon cycling in a wetland ecosystem (Jones and Muthuri, 1997; Kansiime et al., 2005).
Research objectives
To test the reliability and robustness of RF internal accuracy estimation as a variable selection and classification algorithm in distinguishing between species, 6. To explore the potential of hyperspectral data in estimating papyrus biomass at high canopy densities or full canopy levels.
Scope of the study
The study area
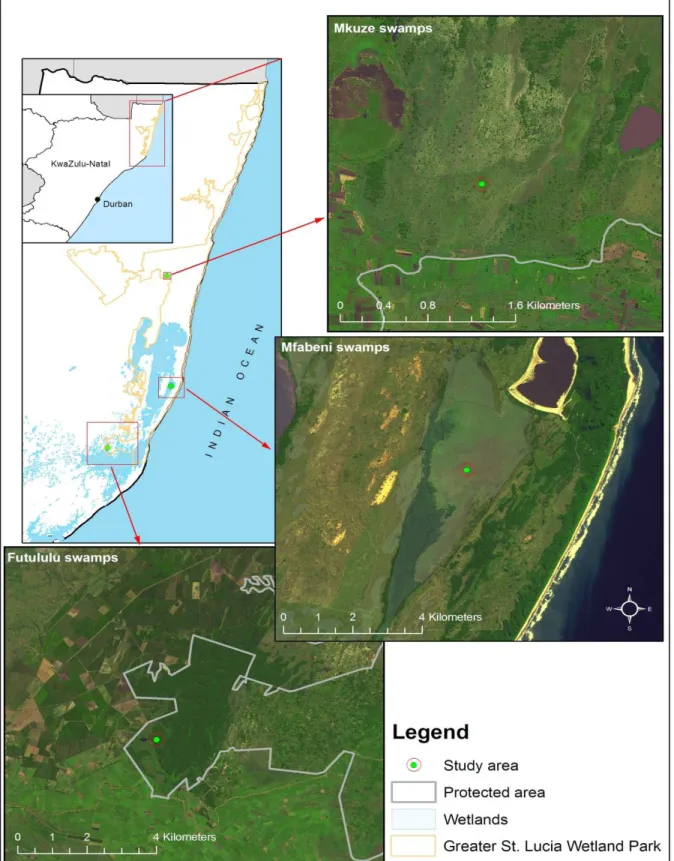
The climate is subtropical with average annual rainfall ranging from 1500 mm on the eastern shore to 700 mm on the western shore of the lake (Taylor, 1995). In this study, four study sites were focused to include Futululu Forest, the Dukuduku Native Forest, Mfabeni Swamps and Mkuzi Swamps (Figure 1.3).
Thesis outline
Some relevant recommendations for future research on remote sensing applications in wetland vegetation mapping are outlined. Research needs for successful applications of remote sensing in wetland vegetation mapping and key challenges are also discussed.
Introduction
There has been no specific review of the use of both hyperspectral and multispectral remote sensing for discriminating wetland vegetation as well as estimating its biophysical and biochemical properties, which is essential in wetland management. Therefore, this review focuses specifically on the application of remote sensing to distinguish and estimate the biophysical and biochemical properties of wetland vegetation.
Challenges in mapping wetland vegetation
The rapid growth in the number of studies on the use of remote sensing in the study of wetland species makes it necessary to provide an overview of the techniques used and to identify the aspects that still require further research. The limitation of the above studies is that no specific aspect of the application of remote sensing has been addressed individually and most studies have focused on the use of remote sensing in mapping and identifying wetland types at a broad level.
Factors affecting spectral characteristics of wetland vegetation
Spectral behavior of wetland vegetation is also influenced by leaf water content which determines the absorption of the mid-infrared region (Datt, 1999). Leaf area index is also a key variable in the leaf reflectance of the wetland vegetation.
Mapping wetland vegetation using multispectral data
1997) compared Landsat TM and SPOT multispectral data in mapping shrubland and grassland vegetation in northern California. Images from Landsat TM and SPOT satellite instruments have proven insufficient to distinguish vegetation species in detailed wetlands (May et al., 1997; Harvey.
Improving the accuracy of wetland vegetation classification
One of the disadvantages of ANN is that ANN can be computationally demanding for network training when dealing with large data sets (Carpenter et al., 1999; Berberoglu et al., 2000; Filippi and Jensen, 2006; Xie et al. on Cukurova Delta in Turkey combined ANN and field-based texture analysis to classify land cover from Landsat TM.
Spectral discrimination of wetland species using hyperspectral data
He concluded that the spectral difference between the species is slight in the visible spectrum, but significant in the near-infrared spectrum. Schmidt and Skidmore (2003) used the spectral reflectance measured at canopy level with a GER 3700 spectrometer of 27 wetland species to explore the potential of mapping coastal salt marsh vegetation associations (mainly grass and herbaceous species) in the Dutch Wadden Sea wetland. evaluate.
Estimating biophysical and biochemical parameters of wetland species
- Mapping wetland biomass
- Estimation of leaf and canopy water content in wetland vegetation
- Estimating leaf area index of wetland vegetation
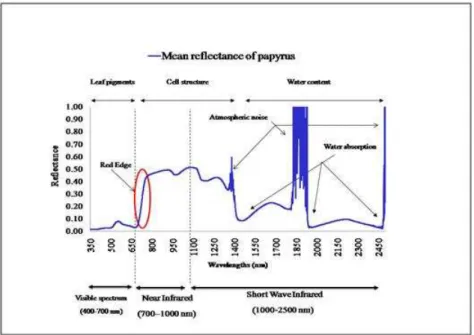
This is because the absorption band related to water content is also affected by atmospheric vapor (Figure 1.1) (Liu et al., 2004). In the same area, Kovacs et al. 2005) investigated the potential of IKONOS in mapping mangrove LAI at the species level.
Overall challenges and future research
Hyperspectral radiometers are considered to be the sensors of choice in the future for mapping and monitoring wetland species. For example, papyrus swamps (Cyperus papyrus L.) (characterizing most of the tropical African wetlands, with a high rate of biomass production, a tremendous amount of combined nitrogen, which plays an important role in hosting habitats for wildlife and birds) are omitted. in the application of remote sensing in distinguishing wetland vegetation.
Introduction
These coherent bands and narrow areas lead to the possibility of distinguishing and mapping vegetation species more accurately and precisely than the standard multispectral bands (Schmidt and Skidmore, 2003; Ustin et al., 2004; Borges et al., 2007). Although hyperspectral data is critical for distinguishing species, its high spectral resolution contains redundant band-level information (Kokaly et al., 2003; Bajwa et al., 2004).
Material and methods
- Field data collection
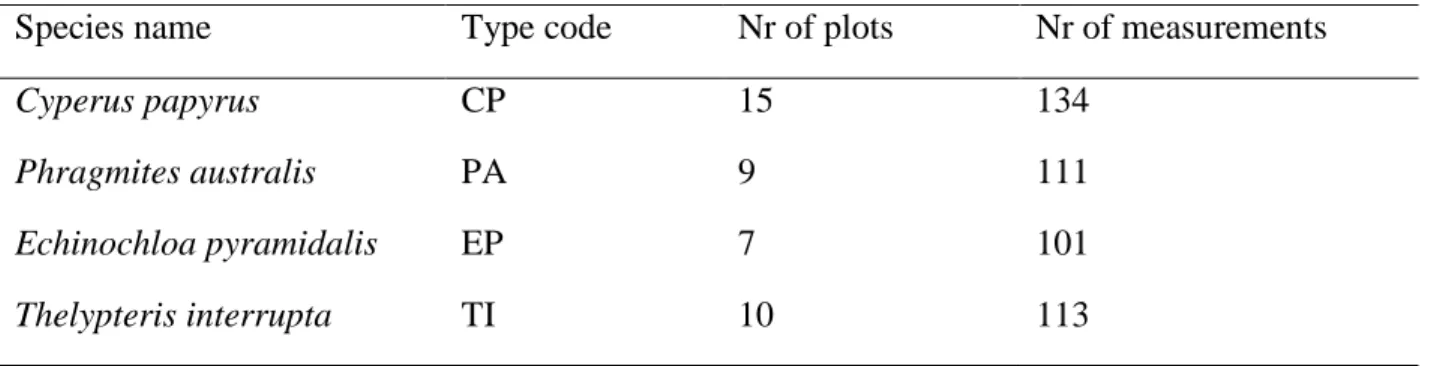
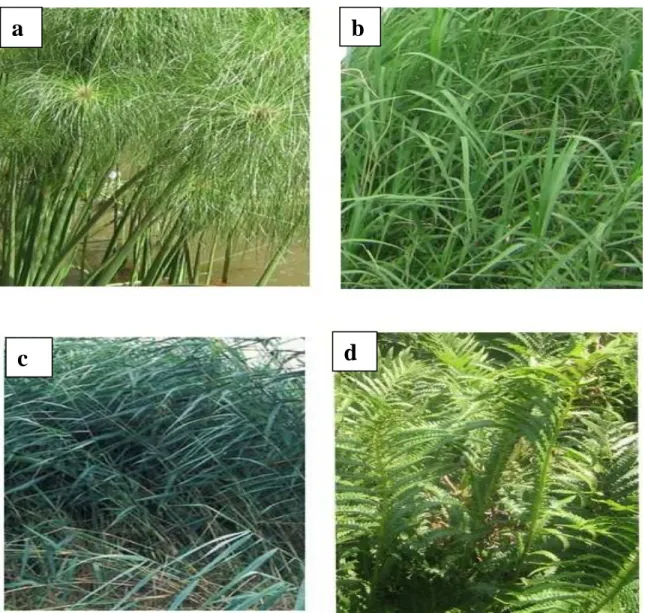
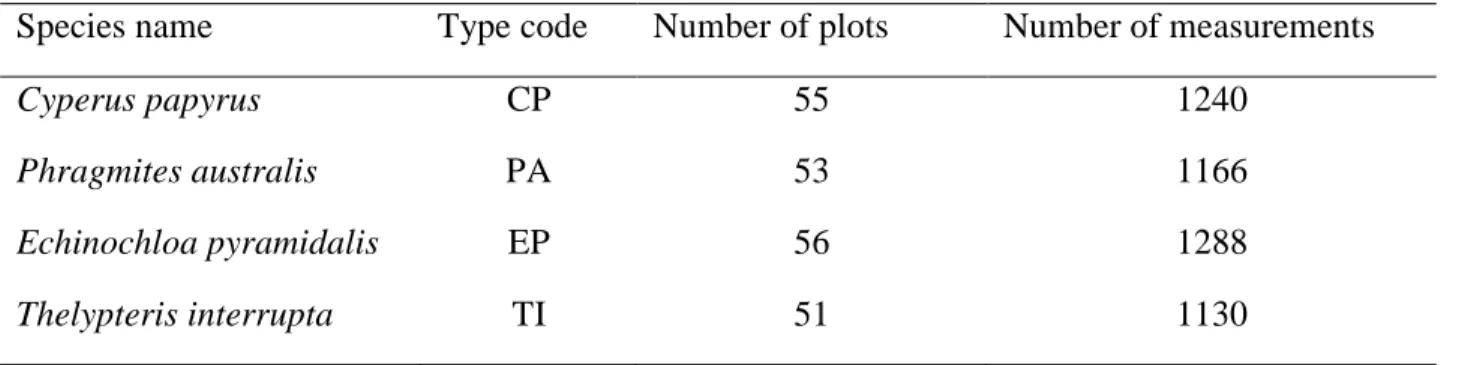
- The identification of papyrus and its associated species
- Spectral data acquisition
- Data processing
- Classification and Regression Trees (CART)
- Distance analysis
CART was preferred in this study because the values of the predictor variables (spectral reflectance) are continuous, as opposed to categorical target (plant species). In this study, we used CART as the second level of the hierarchical method to select the most sensitive wavelengths from the number of significant wavelengths selected in the first level (ANOVA).
Results
- First level: ANOVA test
- Second level: CART results
- Third level: Distance analysis results
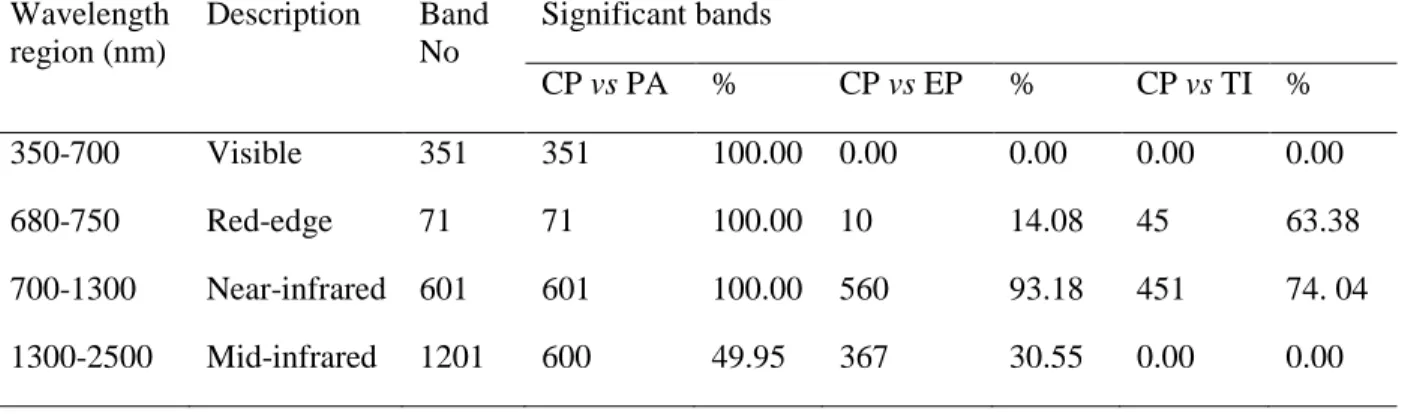
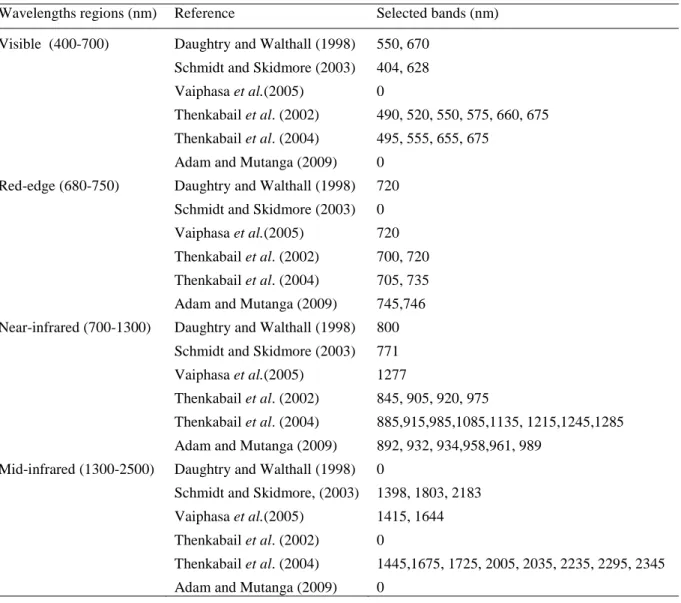
Table 3.2 also shows that the red edge and the near-infrared region are the most important regions where each pair of classes has the most statistically significant wavelengths. It is also interesting that in Table 3.3 there are eight spectral bands that appear frequently in each pair of classes.
Discussion
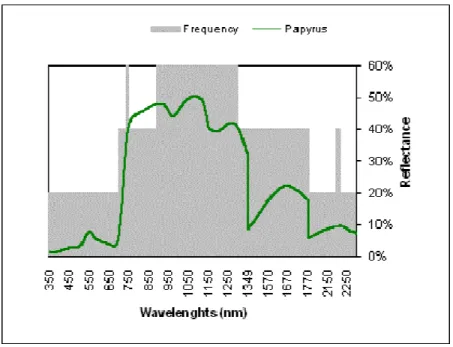
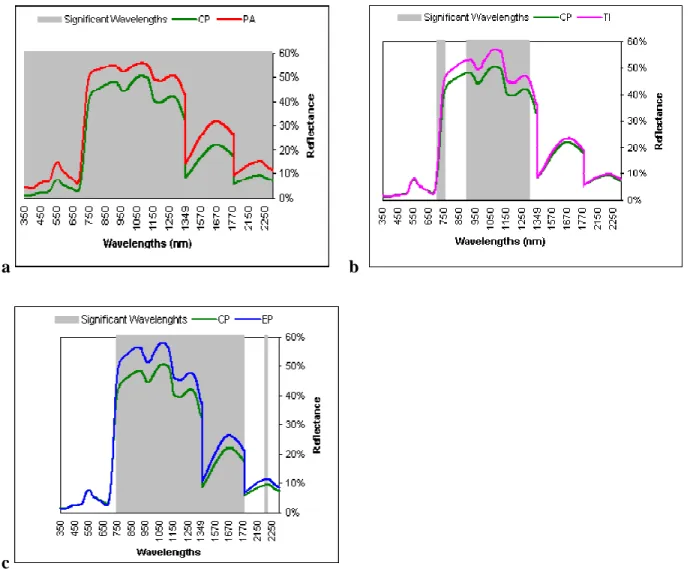
- Differences in mean reflectance between papyrus and its associated species
- Band selection using classification and regression trees (CART)
- The JM distance analysis
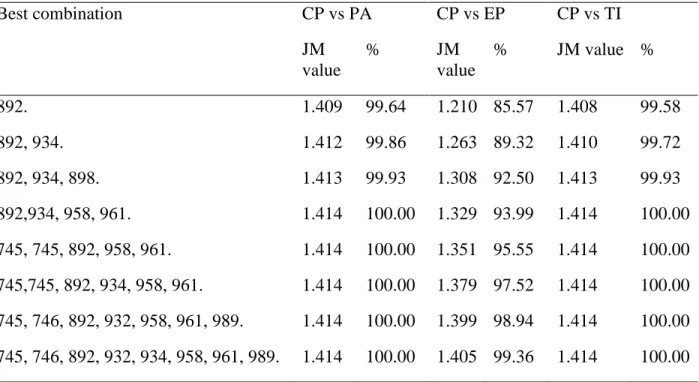
The significant wavelengths in the near-infrared range, on the other hand, may be due to variation between papyrus and other. The selected wavelengths were compared with wavelengths selected in the other previous studies as shown in Table 2.2.
Conclusions
These six bands can distinguish papyrus from all coexisting species. Distinguishing papyrus (Cyperus papyrus L.) vegetation and its coexisting species using RF and hyperspectral data resampled in HYMAP.
Introduction
When using high-dimensional data, such as hyperspectral data, it is recommended that the classification algorithm be part of the variable selection process (Granitto et al., 2006). The multiple classification trees then agree by plurality on the correct classification (Breiman, 2001; Lawrence et al., 2006).
Materials and methods
- Spectral data acquisition and processing
- Data analysis
- Variables importance using the random forest algorithm
- Forward variable selection using the random forest algorithm
- Classification and accuracy assessment
Investigate the usefulness of the RF envelope-based approach for selecting the optimal number of hyperspectral wavebands in a multiclass application, 2. Investigate the robustness of the RF algorithm in an application where the number of samples is less than the number of variables ( p) ( i.e. n < p).
Results
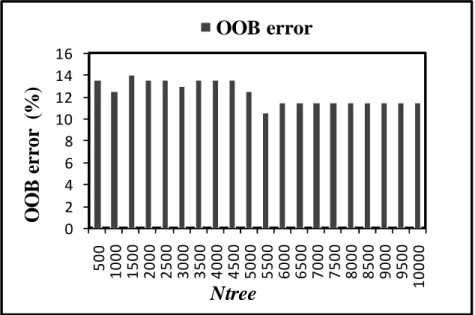
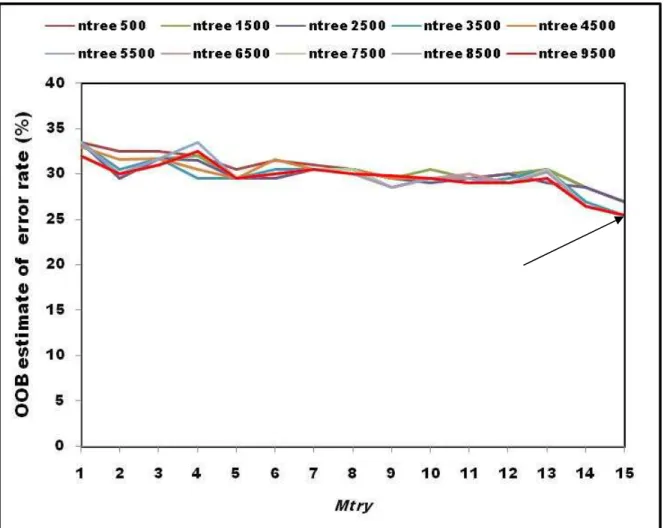
- Effects of random forest input parameters on misclassification error
- Variables selection using the OOB method
- Forward variables selection method (FVS)
- Classification and accuracy assessment
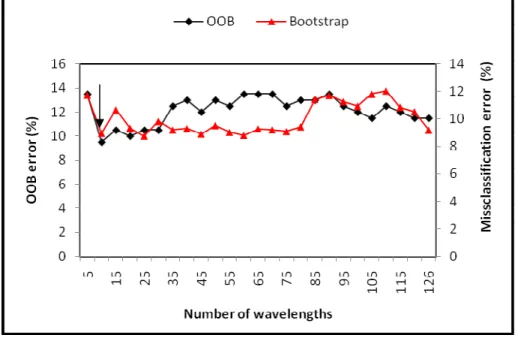
The best subset of wavelengths with the lowest error rate is shown by the black arrow. After calculating the total OOB error estimate, we then used the confusion matrix from Table 4.2 to examine the error rate between papyrus and its co-occurring species.
Discussions
In these experiments, we found that the RF algorithm achieved higher overall classification accuracy than the CT algorithm for all wavelengths and selected wavelengths. The results obtained in this study are consistent with those of Hamza and Larocque (2005) and Pal (2005) who showed that the RF algorithm achieves the best classification accuracy compared to other ensemble methods that use tree classifiers as a base model.
Conclusions
We compared the utility of the RF algorithm with the widely used tree-based ensemble classifier (classification tree algorithm) using the .632+ bootstrap estimate error. However, further studies are needed to test the stability and reliability of the internal assessment of accuracy (OOB) of the RF algorithm using an independent accuracy assessment data set.
Introduction
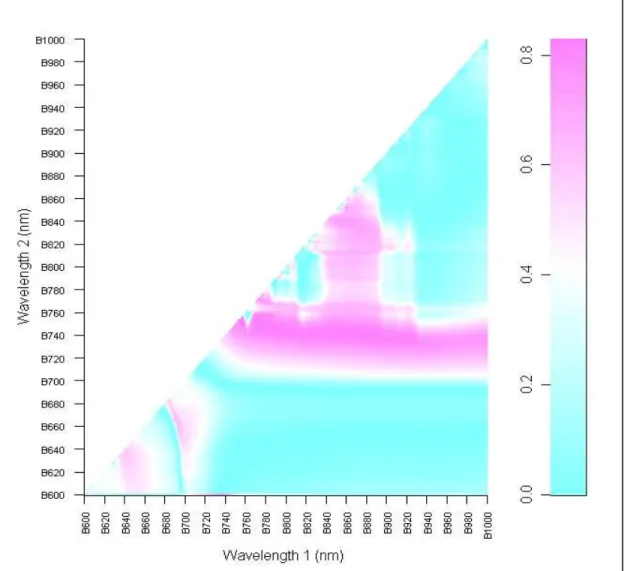
The NDVI calculation is based on the contrast of intense chlorophyll absorption in the red (670 to 680 nm) against the high signal in the near-infrared wavelength (750 nm to 850 nm) due to light scattering from leaves (Mutanga and Skidmore, 2004a; Cho et al., 2008). Canopy spectra indices have shown better discrimination of plant species compared to leaf spectra indices using visible and near-infrared wavelengths (400 nm to 900 nm) (Cho et al., 2008).
Materials and methods
- Canopy spectral measurements
- Vegetation indices calculation
- Statistical analysis
- The random forest algorithm
- Variables importance using the random forest algorithm
- Variables selection: Filter approach
- Optimal subset of vegetation indices
- Classification accuracy
Furthermore, we tested the reliability of the internal accuracy assessment of the RF algorithm using an independent accuracy assessment data set. Lawrence et al., (2006) recommended further testing for the reliability of OOB as an internal accuracy assessment of the RF classifier.
Results
- Measuring the variables importance using the random forest algorithm
- Variables selection using filter approach (ANOVA)
- Forward variables selection
- Classification assessment
The red color indicates the vegetation indices that can distinguish between all class pairs (n = 6) of the species. The forward variable selection method for identifying the optimal subset of vegetation indices using the OOB error rate estimation.
Discussion
- Variables importance using the random forest algorithm
- Significant difference in vegetation indices between the species
- Optimal vegetation indices
- Classification assessment
Our results in this study confirmed the power of the RF algorithm in providing the highest classification accuracy (more than 90%) of hyperspectral data (Lawrence et al., 2006; Pal, 2006). In this respect, our result is consistent with that obtained by Lawrence et al. 2006) who found that the accuracy estimate using OOB is almost identical to an independent accuracy estimate.
Conclusions
Mapping wetland plant species using multispectral remote sensing is challenging due to the small and mixed vegetation units in a wetland. The characteristics of the papyrus canopy and its coexisting species were identified using ground points and pixel-based mean spectral reflectance at each wavelength from the acquired image, which was then used to develop a classification model.
Introduction
Therefore, it was recommended that techniques implemented using a handheld spectroradiometer should receive significant additional testing with other airborne or spaceborne data (Adam et al., 2009). The RF algorithm (RF), first developed by Breiman (2001), has recently been used as a feature classification and selection method to reduce redundancy in hyperspectral data (Chan and Paelinckx, 2008; Adam et al. , 2009; Ismail, 2009).
Material and methods
- Image acquisition and pre-processing
- Field data collection
- Selection of the optimal AISA spectral bands
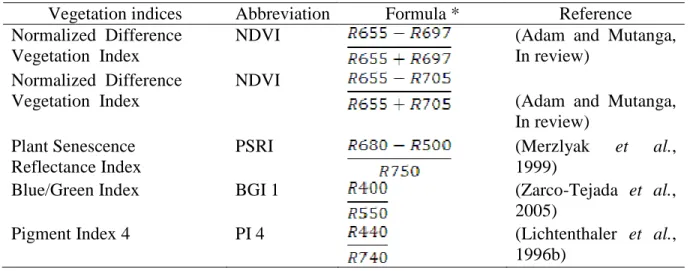
- Narrow band vegetation indices
- Image classification
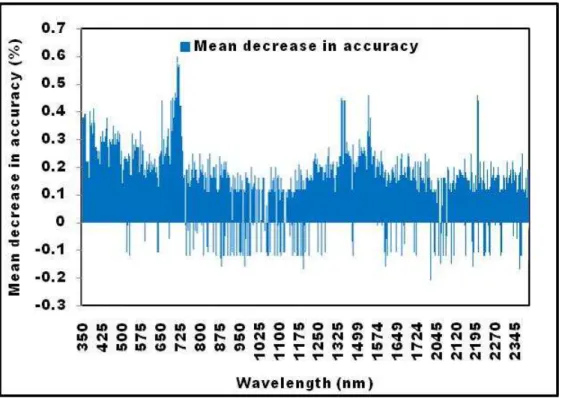
The significance of each AISA band (n = 272) used in this study was calculated based on how much worse the classification accuracy (average decrease in accuracy) would be if that variable (band) were randomly permuted using of the internal out-of-bag estimator (Breiman, 2001; Lawrence et al., 2006; Prasad et al., 2006; Strobl et al., 2007). The importance of each variable is estimated as follows: 1. Out-of-bag estimates of error were developed using a third of the reference data set that was randomly excluded from the development of each of the 6500 classification trees (Breiman, 2001; Lawrence et al., 2006).
Results
- Optimization of the random forest algorithm
- Variables selection
- Classification and accuracy assessment
- Using selected AISA raw bands
- Using narrow band vegetation indices
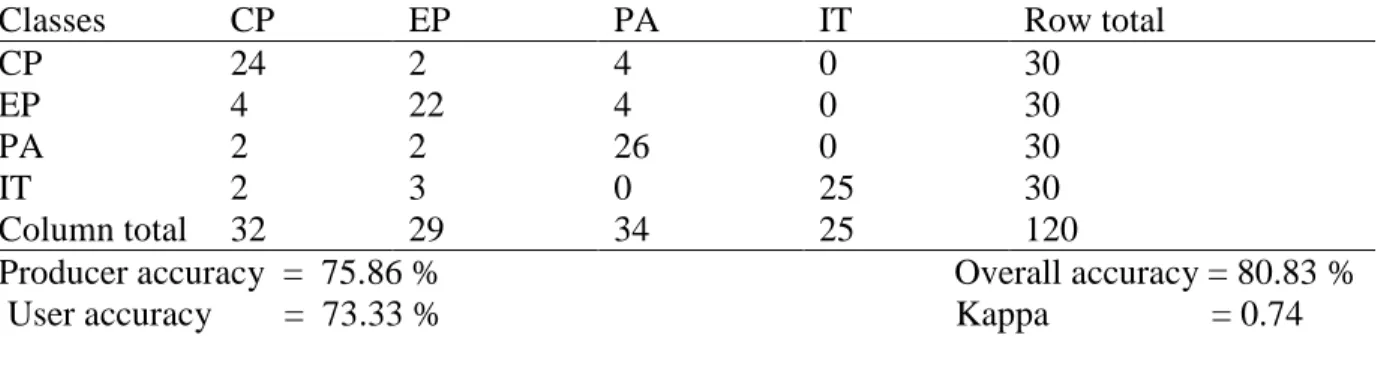
The producer accuracy and the user accuracy, which are more meaningful for the individual classes, are shown in Table 6.5. For comparison, producer and user accuracies, including for the raw bands and vegetation indices, are shown in Figure 6.4.
Discussion
Therefore, the RF classifier could be considered a very desirable method for classifying hyperspectral remote sensing data (Lawrence et al., 2006). The overall classification accuracy (80%) we obtained in this study using AISA bands is 9.5% lower than that reported by Adam et al.
Conclusions
Estimating papyrus (Cyperus papyrus L.) biomass using narrowband vegetation indices and the random forest regression algorithm. Estimating papyrus (Cyperus papyrus) biomass using narrowband vegetation indices and the random forest regression algorithm.
Introduction
The most commonly used vegetation indices, which are sensitive to biophysical and biochemical variation in vegetation, are calculated from the red and near-infrared (NIR) parts of the electromagnetic spectrum (Asrar, 1989; Cho et al., 2007). However, some authors note that the strengths of the rich hyperspectral bands have not been exploited because only two bands from the red and near-infrared regions are used to formulate the indices (Cho et al., 2007).
Material and methods
- Field spectral measurements and biomass harvesting
- Data analysis
- Narrow band indices
- Random forest regression ensemble
- Selection of the predictive variables
To validate the performance of the RF algorithm (Lawrence et al., 2006), the data were randomly split into 70% training or calibration and 30% test data samples (n = 32 and 14, respectively). The test dataset was used to validate the predictive performance of the RF algorithm (Lawrence et al., 2006; Ismail and Mutanga, 2009).
Results
- Hyperspectral indices (NDVI) and biomass
- Parameters optimization of the random forest regression model
- Determination of predictor variables
- Development of the prediction model
The RF procedure measured the significance of the top 20 band combinations from the training data set (70 %) based on the average decrease in accuracy. The RF procedure measured the importance of the top 20 combinations from the training data set (70 %) based on the average decrease in accuracy (Figure 7.3).
Discussion
- Relationship between the narrow band NDVIs and biomass
- Parameter optimization of the random forest model
- Variables selection
- The predictive performance of the random forest model
This supports the claims of the other studies that the highest accuracy and stability of the RF algorithm can be achieved by using a large number of trees (Díaz-Uriarte and de Andrés, 2006; Adam et al., 2009). The higher accuracy obtained in this study demonstrated the utility of the RF algorithm as a feature selection method (Lawrence et al., 2006; Adam et al., 2009) and its application as a regression model (Ismail and Mutanga, 2009).
Conclusions
This can be explained by the saturation problem with standard NDVI at the high biomass or leaf area index, which has been reported in several studies (Tucker, 1977; Mutanga and Skidmore, 2004a). We thank the University of KwaZulu-Natal for providing the optimal conditions for the success of the study and assistance with ASD.
Introduction
To explore the utility of in situ spectroscopic data in distinguishing papyrus vegetation from its coexisting species (binary class techniques). To investigate the utility of in situ spectroscopic data in discriminating papyrus vegetation and its coexisting species (multi-class technique).
Spectral discrimination of papyrus under full canopy cover
- Spectral discrimination of papyrus from its co-excising species (binary class)
- Spectral discrimination of papyrus and its co-existing species (multi-class
To investigate the potential of imaging spectroscopy in distinguishing papyrus and its closely related species through airborne hyperspectral data (AISA eagle), and. We assessed the potential of discrimination between papyrus and the different coexisting species (multi-class classification) using machine learning algorithms (random forest) and canopy reflectance measured under field conditions and resampled to HYMAP resolution (Chapter 4).

Improving the spectral discrimination of papyrus vegetation
Based on the relatively high overall accuracy (96%), the use of hyperspectral indices can be considered as a new approach for distinguishing plant species. The score includes the kappa statistic, overall accuracy (ACC), manufacturer's accuracy (PA), and user's accuracy (UA).
Airborne hyperspectral remote sensing of papyrus vegetation
The key finding presented in this chapter is that spectral separability between papyrus vegetation and its coexisting species can be improved from 90.5 % overall accuracy (Chapter 4) to 96 % overall accuracy by 5 optimal vegetation indices (Table 8.4). The optimal vegetation indices selected (Chapter 5) were also tested to improve the discriminative power of the hyperspectral data.
Predicting papyrus biomass using narrow band vegetation indices
In recent years, RF has proven to be a powerful classification method in the field of remote sensing (Gislason et al., 2006; Lawrence et al., 2006). Therefore, the RF algorithm is worth considering as a robust method for regression-type remote sensing applications in the future.
Evaluating the reliability and robustness of random forest algorithms for hyperspectral
The RF algorithm can rank the importance of bands that best contribute in the classification and regression model (Lawrence et al., 2006). The RF algorithm can also detect outliers, which can be very useful when some of the cases may be mislabeled (Gislason et al., 2006);
Therefore, this combination of reliable and robust accuracy estimation method, which avoids the need to collect a separate test data set and relatively high accuracy of the RF algorithm, can be considered to be desirable for sensor applications. in hyperspectral distance, especially in complex environments such as marshy wetland areas where adequate or sufficient field data are not usually available. We have shown that at high canopy densities, papyrus biomass can be accurately predicted using narrow-band vegetation indices calculated from a combination of shorter red or far-red wavelengths (700 nm -750 nm) and longer NIR wavelengths (750 nm - 1000 nm), compared to the NDVI standard which includes a strong chlorophyll absorption band at the red limit and a near infrared band.
The Future
Hyperspectral remote sensing of bog species and plant vigor gradient in the New Jersey Meadowlands. Remote sensing of Australian wetlands: an evaluation of Landsat TM data for inventory and classification.