In this pathway, the peroxiredoxin Tpx1 reduces hydrogen peroxide and oxidizes the redox transcription factor Pap1. After a hydrogen peroxide perturbation, the Pap1 signal profile revealed a biphasic profile with a rapid initial increase followed by a relatively prolonged decrease in Pap1 oxidation. To the Danish Research Foundation (NRF), thank you for the scholarship that enabled me to pursue my master's degree.
Thank you for your support and for always believing in me even when I didn't believe in myself. 49 Figure 2.21: Pap1 oxidation assay after exposure to 100 μM hydrogen peroxide and tert-butyl hydroperoxide.
Literature review
- Introduction
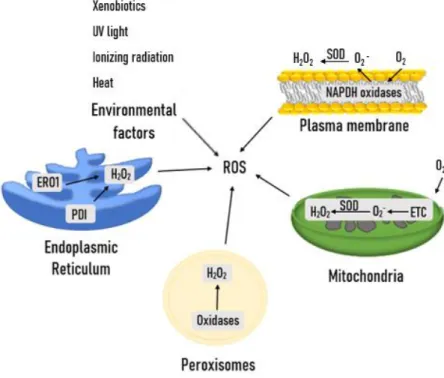
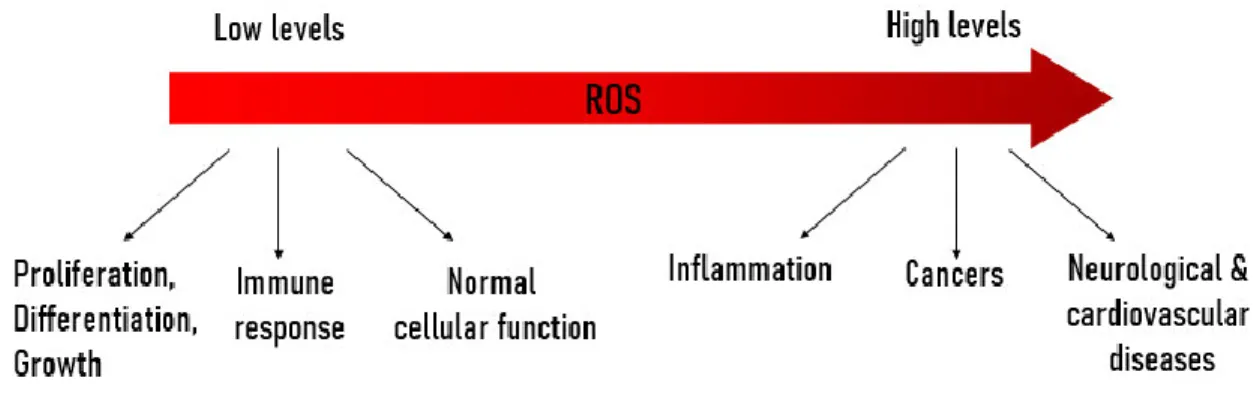
- The generation of ROS
- ROS detoxification by non-enzymatic and enzymatic antioxidants
- Peroxiredoxins
- ROS as signalling molecules
- Direct sensors
- Indirect sensors
- The logic of the Tpx1/Pap1 pathway
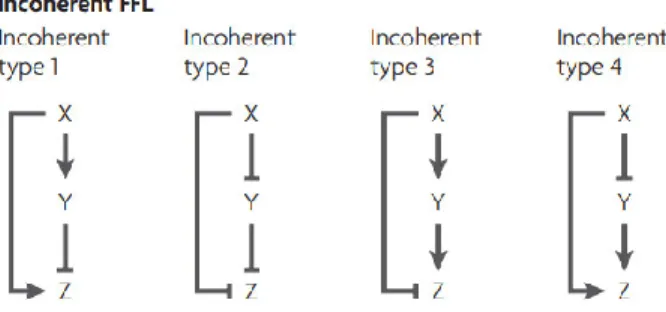
- Incoherent feedforward loop
- Dynamics of the Pap1 and OxyR transcription factors
- Can quantitative signal parameters provide a deeper understanding of the
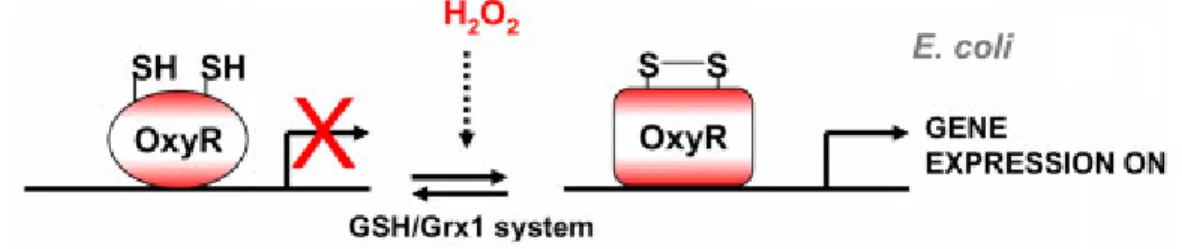
Consequently, several hydrogen peroxide sensing mechanisms have evolved in different cells (Garcia-Santamarina et al., 2014). OxyR exists as a homotetramer and is rapidly oxidized (activated) by hydrogen peroxide (Zheng et al., 1998). OxyR is then reduced by the glutathione/glutaredoxin (GSH/Grx1) system (Adapted from Garcia-Santamarina et al., 2014).
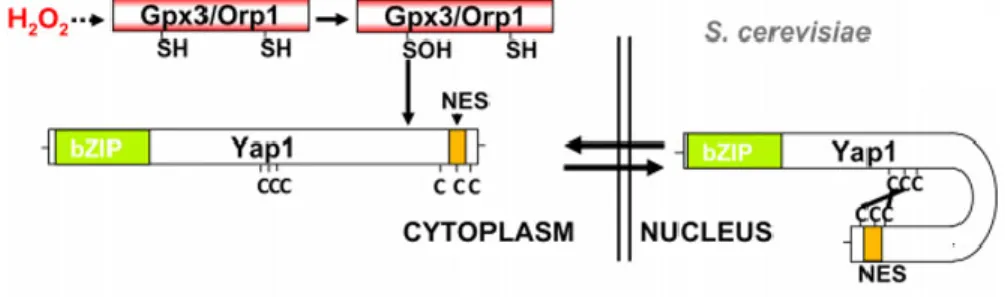
Currently, two models have been proposed for the activation of OxyR by hydrogen peroxide (Garcia-Santamarina et al., 2014). When hydrogen peroxide is at or below physiological levels (<70µM), Tpx1 reduces hydrogen peroxide to water resulting in a sulfenic acid (Tpx1-SOH) (Day et al., 2012; Veal et al., 2014).
Chemical perturbation of the Tpx1/Pap1 pathway in vivo
Introduction
The work reported in this chapter focused on chemically perturbing the Tpx1/Pap1 pathway to determine whether a disjointed feed loop was responsible for the Pap1 dynamic profile. The signal parameters will be determined using mathematical equations (Heinrich et al., 2002; Pillay et al., 2016) and oxidation data obtained from western blots.
Materials and Methods
- Materials
- Reagents and Buffers
- Culture media preparation
- Methods
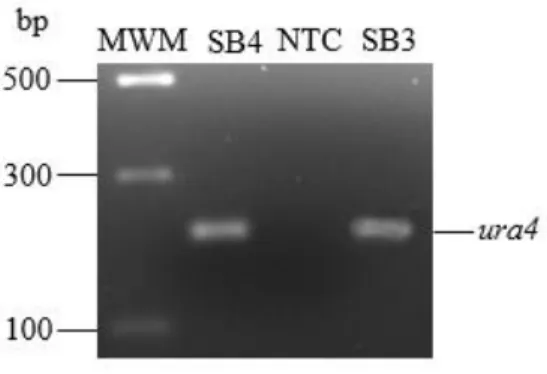
A final concentration of 40 mM Tris Acetate and 1 mM EDTA was used to make 1X TAE buffer. The Pk tag enabled the identification of the Pap1 protein using an antibody that recognizes the tag (Gadaleta et al., 2013), while the approximately 200 bp ura4 marker introduced using a disruption cassette was used to identify the cells that contained the Pk tag (Bozonet et al., 2005). The annealing temperature of the ura4 primers (Table 2.1) was determined at 50°C using Oligoanalyzer (https://eu.idtdna.com/calc/analyzer) and Primer3 (https://primer3.ut.ee/) .
The absorbance value of the protein sample was measured and used to dilute the sample to three different absorbance values and 0.15 a.u.), which was later related to the corresponding protein concentration using the standard curve from the BCA method (see Section 2.2.4.9). The bottom of the Ribolyzer tube was punctured with a hot needle before being placed in a sterile 1.5 ml tube. An 8% SDS-PAGE gel consists of resolving and stacking solutions made with lower and upper Tris buffers, respectively.
24 Table 2.2: Mixture used to prepare SDS-PAGE resolving and stacking gels. After completion of SDS-PAGE electrophoresis, a transfer sandwich was made while submerged in ice-cold transfer buffer. After the transfer was complete, the nitrocellulose membrane was stained with Ponceau S dye for five minutes to allow quantification of total proteins (see Section 2.2.4.13).
The intensity of the respective protein bands in the western blot was quantified using the gel analysis function on ImageJ (https://imagej.nih.gov) by selecting the relevant bands. The signal parameters were then calculated from the area under the curve of the graph (see section 2.3.4). ImageJ was also used to quantify the intensity of the reduced Pap1 bands from the DTT control blots.
Results
- Confirmation of the Pk-tag in S. pombe SB3 through identification of the ura4
- Determining the sensitivity of S. pombe SB3 cells to different concentrations of
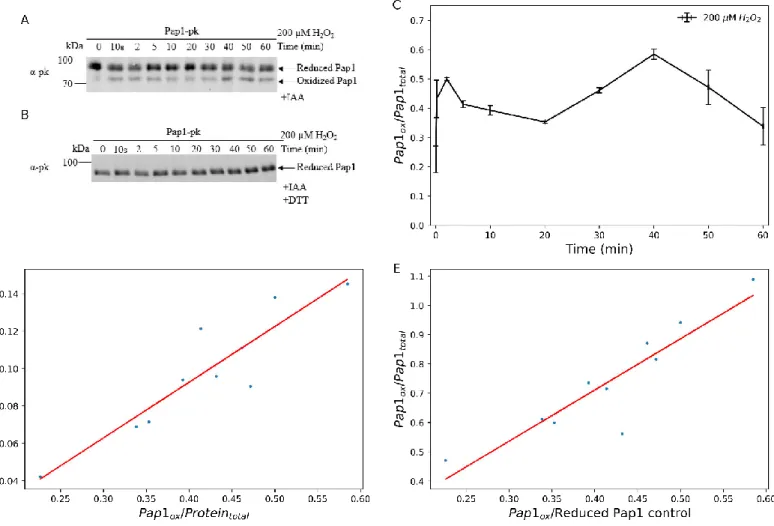
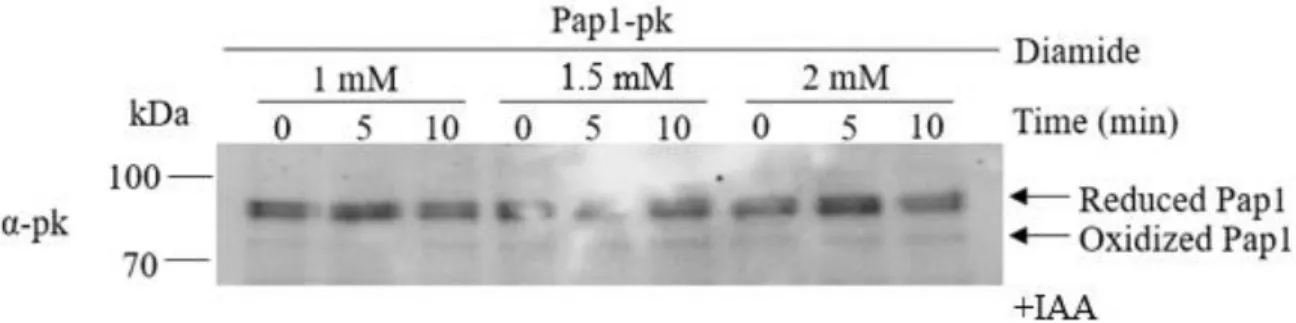
- Validation of the western blotting method of Pk-tagged Pap1 in vivo
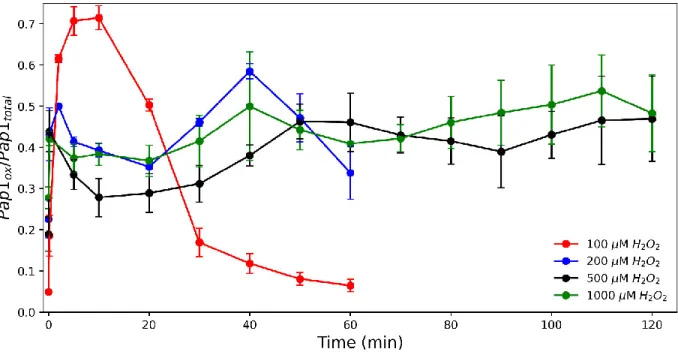
- Oxidation profiles of Pk-tagged Pap1 in response to exposure to 0.1-1 mM
- Oxidation profiles of Pk-tagged Pap1 in response to exposure to 100 µM and 200
- Oxidation profiles of Pk-tagged Pap1 in response to exposure to 70 µM and 100
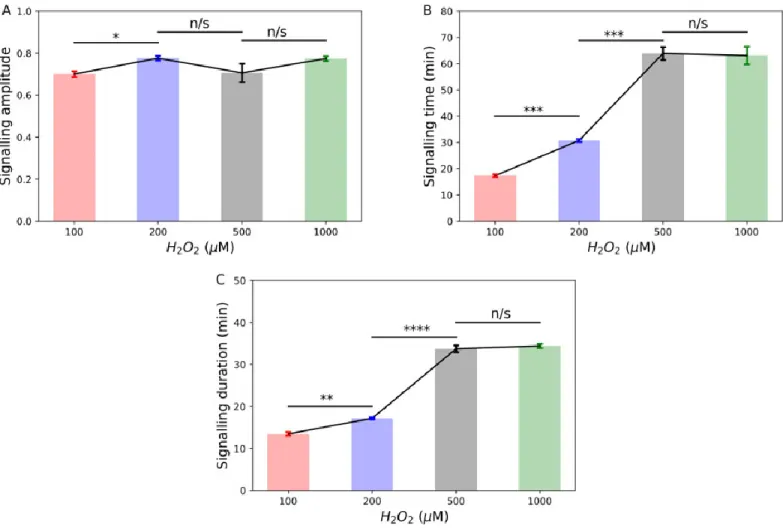
The oxidation profile of Pap1 in 100 µM hydrogen peroxide exhibited rapid oxidation, reaching peak oxidation at ten minutes followed by a slow and prolonged decline in oxidation from shortly after ten minutes to 60 minutes (Figure 2.8C). The oxidation profile of Pap1 at 200 µM showed a rapid increase in oxidation by ten seconds that peaked at two minutes (Figure 2.9C). The difference in signaling time between 200 µM and 500 µM hydrogen peroxide was no longer significant (Figure 2.14B).
The oxidation profile showed a single peak at five minutes, which was slightly faster than that seen in cells treated with 100 µM hydrogen peroxide (Figure 2.8C). The concentration of tert-butyl hydroperoxide was then increased to 200 μM and the time course was held at 60 minutes (Figure 2.16A, B). 46 Figure 2.17: Comparison of Pap1 oxidation profiles after treatment with 100 μM and 200 μM tert-butyl hydroperoxide (tBOOH).
Oxidation profiles of Pap1 treated with tert-butyl hydroperoxide (Figure 2.17) were used to calculate signaling parameters (Table 2.3). Interestingly, increasing from 100 μM to 200 μM tert-butyl hydroperoxide showed a non-significant change in the amplitude and duration of signaling (Figure 2.18A, C). Signaling time also showed a significant decrease between 100 μM and 200 μM tert-butyl hydroperoxide (Figure 2.18B), in contrast to the increase observed between the same concentrations for hydrogen peroxide.
The tert-butyl hydroperoxide profiles were surprisingly different from 200 µM hydrogen peroxide (Figure 2.9C) and did not contain a second peak. A rapid increase in Pap1 oxidation was observed after ten seconds, but surprisingly there was no prominent second peak in oxidation as seen with 70 µM hydrogen peroxide and tert-butyl hydroperoxide (Figure 2.21A, C). Both profiles showed a significant increase in oxidation after ten seconds, followed by a gradual reduction of Pap1 (Figure 2.22).
Surprisingly, the initial stages (0–20 minutes) of the stress oxidation combination profiles showed a high similarity to that of 1000 µM hydrogen peroxide (Figure 2.22). The above oxidation profiles of the combination voltages (Figure 2.22) were used to determine the signal parameters for this condition (Table 2.3).
Discussion
55 hydrogen peroxide and tert-butyl hydroperoxide resulted in a significant change in signaling time but did not appear to affect signaling amplitude and duration at the concentrations used. A previous transcriptomic study showed that the transcriptional response of fission yeast varied depending on the concentration and oxidant used (Chen et al., 2003; Chen et al., 2008). Our results could provide an explanation for these data, as our experiments show that different oxidant concentrations and combinations result in different Pap1 oxidation profiles and signaling dynamics (Table 2.3).
Unexpectedly, the oxidation profile and signal parameters obtained after treatment with 70 µM and 100 µM hydrogen peroxide and tert-butyl hydroperoxide were similar to those obtained after treatment with 1000 µM hydrogen peroxide. Combination strains may be useful in therapeutic studies, particularly in yeast cells resistant to high hydrogen peroxide concentrations. To conclude, although chemical perturbation provided some insight into the Tpx1/Pap1 pathway, we could not independently modulate the signaling parameters.
Therefore, we could not determine whether the Pap1 oxidation profile was due to a disjointed feed loop.
Perturbation of the S. pombe Tpx1/Pap1 pathway in silico
- Introduction
- Methods
- Results
- Developing the kinetic model of the Tpx1/Pap1 pathway
- Perturbing the thioredoxin activity to modulate incoherence within the
- The Pap1 oxidation profile during oxidative stress is directly linked to Trx1
- Discussion
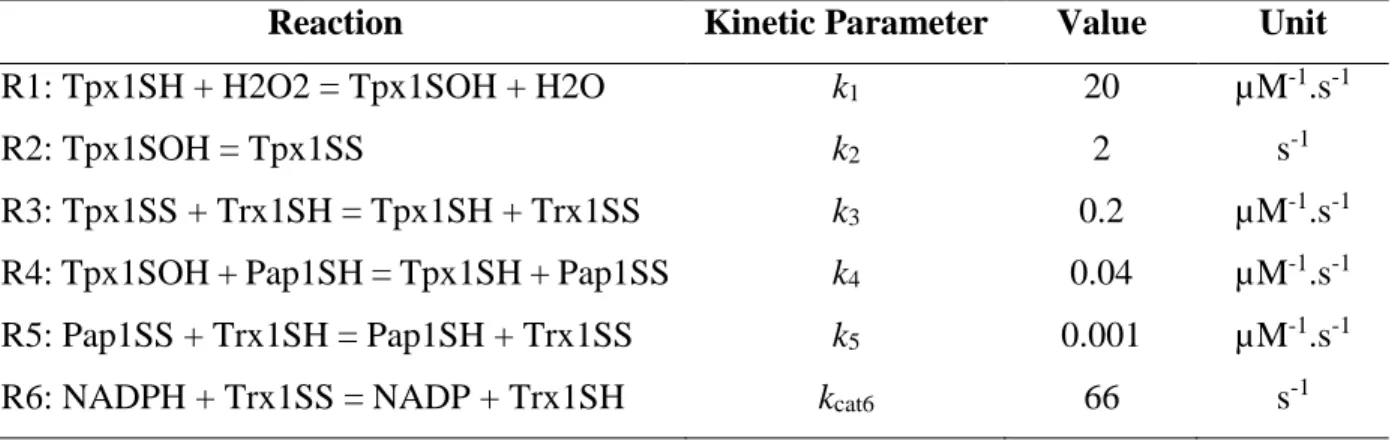
60 Figure 3.2: Tpx1/Pap1 model simulated Pap1 oxidation profiles with a fast increase and slow decrease for 100-1000 μM hydrogen peroxide. As we proposed that the Trx1 protein was responsible for the incoherent characteristic of the Tpx1/Pap1 pathway, the kinetic parameter values for Trx1 reduction of Tpx1SS (k3) and Pap1SS (k5) (Figure 3.3A) were varied to determine the effect on the oxidation profile. An increase and decrease of the k3 parameter had minimal impacts on the oxidation profile (Figure 3.3B) and signaling parameters (Table 3.3).
Varying Tpx1 and Trr1 concentrations and k1, k2, k4, and kcat6 parameters did not result in significant changes in the oxidation profile of Pap1 (Figures S1–S6, Appendix 2). Effect on Pap1 oxidation profiles during an increase (red) and decrease (blue) of the original k3 (B) and k5 model. C) kinetic parameters (black) as well as the concentration of reduced Trx1 (Trx1SH) (D). When comparing the oxidation profiles of Pap1 and Trx1 after exposure to hydrogen peroxide, they were found to have similar profiles at all concentrations tested (Figure 3.4A-D).
Interestingly, it was found that the signal amplitude showed no linear correlation between the oxidation of Trx1 and Pap1 from 100-1000 µM hydrogen peroxide (Figure 3.5A). However, the timing of signaling showed a strong linear correlation between Trx1 and Pap1 oxidation (Figure 3.5B), while the duration of signaling showed a linear correlation for all concentrations of hydrogen peroxide except 200 µM (Figure 3.5C). Signaling amplitude (A), signaling time (B) and signaling duration (C) values from Trx1 and Pap1 oxidation were compared for 100-1000 µM hydrogen peroxide.
However, although a fission yeast model of the Tpx1 pathway was already available (Tomalin et al., 2016), it did not contain all necessary reactions and therefore failed to simulate Pap1 oxidation. 65 Our results show that rather than a disjointed feedforward loop, Trx1 oxidation played a role in determining Pap1 signaling duration (Figure 3.3B-D). In conclusion, a simple core model of the Tpx1/Pap1 system was used to gain insight into Pap1 oxidation.
General Discussion
A simple core model of the Tpx1/Pap1 pathway was used to perturb the system in silico to determine whether a disjointed feed loop was responsible for the Pap1 oxidation profile. Unexpectedly, it was shown that Trx1 restriction, instead of a disjointed feedback loop, played a role in the oxidation profile of Pap1 obtained during oxidative stress. This work fills part of this knowledge gap and provides an understanding of the design principles of these systems.
Regulation of the OxyR transcription factor by hydrogen peroxide and the cellular thiol-disulfide status. Dissecting a redox relay: H2O2-dependent activation of the transcription factor Pap1 through the peroxidative Tpx1-thioredoxin cycle. Mechanisms underlying the exquisite sensitivity of Candida albicans to combinatorial cationic and oxidative stress that enhances the potent antifungal activity of phagocytes.
The role of mitochondria in the generation of reactive oxygen species and its implications for neurodegenerative diseases. The disjoint feedback loop accelerates the reaction time of the bile system of Escherichia coli. Regulation of the fission yeast transcription factor Pap1 by oxidative stress: requirement for the nuclear export factor Crm1 (Exportin) and the stress-activated MAP kinase Sty1/Spc1.
The fission yeast Schizosaccharomyces pombe as a model to understand how peroxiredoxins affect cell responses to hydrogen peroxide. Activation of the redox sensor Pap1 by hydrogen peroxide requires modulation of intracellular oxidant concentration. Biological and physiological role of reactive oxygen species - the good, the bad and the ugly.