Supported copper oxide catalysts for octanal hydrogenation:
The influence of water
By
Alisa Govender
Submitted in fulfillment of the academic requirements for the degree of Master of Science at the
School of Chemistry University of KwaZulu-Natal
Durban South Africa
June 2010
As the candidates supervisor I have approved this thesis for submission
______________________ ______________________ _____________________
Name Signature Date
Disclaimer: Small parts of the text relating to the aims and objectives of this project were deleted at the request of the sponsoring company to achieve "IP clearance"
Abstract
Copper oxide supported on alumina (CuO/Al2O3), silica (CuO/SiO2) and chromia (CuO/Cr2O3) have been synthesized and characterized. These catalysts were characterized using XRD, SEM, TEM, ICP, BET surface area and pore volume, TPR, TPD, TGA-DSC and IR. The hydrogenation of octanal using these catalysts was investigated;
however, the primary focus of the project was the influence of water on the reaction and the catalysts.
The initial study using CuO/Al2O3 showed that the optimum operating conditions for subsequent catalytic testing was 160 °C and a hydrogen to aldehyde ratio of two. Under these conditions, a conversion of 99 % and selectivity to octanol of 97 % was achieved.
Further catalytic testing, using CuO/Al2O3 and CuO/Cr2O3, was carried out by introducing water-spiked feed into the reaction system after steady state was reached using fresh feed.
Based on literature, it was initially expected that the presence of water would cause catalyst poisoning and subsequently catalyst deactivation. However, contrary to the expectation, the presence of water did not influence the activity of these two catalysts.
Furthermore, the selectivity to octanol increased to 98.5 % when CuO/Al2O3 was used for the reaction, whilst a minor change in the selectivity to octanol (0.5 %) was obtained when CuO/Cr2O3 was used. The interaction of the water with the surface hydroxyls on alumina is most likely the reason for the increase in the selectivity to octanol when using CuO/Al2O3.
In contrast to the other two catalysts, the reaction over CuO/SiO2 showed a steady decrease in both the conversion of octanal and the selectivity to octanol with time-on- stream when using fresh feed. After 55 hours on stream, the conversion reached 22 %, (from an initial 95 %) whilst the selectivity to octanol reached 89 % (from an initial 98 %).
This decline in the conversion and selectivity to octanol was possibly due in part, to the low isoelectric point of silica, with mechanical failure being the major contributing factor to the catalyst’s deactivation. The decrease in the BET surface area and the presence of smaller particles in the SEM image, confirmed that mechanical failure occurred.
Since steady state was not reached and deactivation occurred, the reaction over CuO/SiO2
was also carried out using water-spiked feed. The conversion of octanal was seen to gradually decrease to 73 % after 55 hours on stream, whilst the selectivity to octanol remained unchanged at 98 % for the duration of the reaction. This showed the beneficial effect of the presence of water by slowing down the decline in catalytic activity and maintaining the selectivity to octanol. The improved selectivity obtained in the presence of water was attributed to its interaction with the silica surface hydroxyls. Since octanal conversion continued to decrease, it indicated that mechanical failure was the primary cause in the loss of catalytic activity.
The used catalysts were characterized using XRD, SEM, EDS composition scanning, TEM, BET surface area and pore volume, TGA-DSC and IR. The catalysts used for the reaction with the fresh feed and the water-spiked feed were characterized and compared. Except for the deactivation of CuO/SiO2, the characterization of these catalysts showed that the presence of water did not negatively impact the make-up of the catalyst.
Preface
The experimental work described in this thesis was carried out in the School of Chemistry, University of KwaZulu-Natal, from January 2008 to March 2010, under the supervision of Professor Holger B. Friedrich.
These studies represent the original work by the author and have not otherwise been submitted in any form for any degree or diploma to any tertiary institution. Where use has been made of the work of others it is duly acknowledged in the text.
Declaration 1
Plagiarism
I, Alisa Govender, declare that
1. The research reported in this thesis, except where otherwise indicated, is my original work.
2. This thesis has not been submitted for any degree or examination at any other university.
3. This thesis does not contain other person’s data, pictures, graphs or other information, unless specifically acknowledged as being sourced from other persons.
4. This thesis does not contain other person’s writing unless specifically acknowledged as being sourced from other researchers. Where other written sources have been quoted, then:
a. Their words have been re-written but the general information attributed to them has been referenced
b. Where the exact words have been used, then their writing has been placed in italics and inside quotation marks, and referenced.
5. This thesis does not contain text, graphics or tables copied and pasted from the internet, unless specifically acknowledged, and the source being detailed in the thesis and in the References sections.
______________________________________
Signed
Declaration 2
Conference Contributions and Publications
Parts of this thesis have been presented at conferences or publications as listed below.
(A) Conference contributions:
1. Oral presentation
CATSA 2009, Worster and MSSA 2009, Durban
Deactivation of supported copper oxide catalysts for aldehyde hydrogenation reactions
(B) Publications:
1. The influence of water on the hydrogenation of octanal using supported CuO catalysts
Currently in preparation
2. Deactivation of CuO/SiO2 during the hydrogenation of octanal and the influence of water
Currently in preparation
______________________________________
Signed
Table of Contents
Chapter 1: Introduction... 1
1.1. Catalysis ... 2
1.1.1. Fundamental principles of catalysis ... 2
1.2. Heterogeneous Catalysis ... 3
1.2.1. The catalytic cycle ... 4
1.2.2. Surface adsorption ... 4
1.3. Catalysts ... 5
1.3.1. Types of catalytic material ... 5
1.3.2. Supported metal catalysts ... 6
1.4. Catalytic Reactors ... 11
1.5. Fundamental Terminology ... 12
1.6. Catalyst Characterization ... 14
1.6.1. X-Ray diffraction ... 15
1.6.2. X-Ray photoelectron spectroscopy ... 15
1.6.3. Electron microscopy ... 16
1.6.4. Temperature programmed reactions ... 18
1.6.5. Brunauer-Emmett-Teller Method ... 18
1.6.6. Inductively coupled plasma-optical emission spectroscopy ... 18
1.6.7. Thermogravimetric analysis and differential scanning calorimetry ... 19
1.6.8. Infra-red spectroscopy ... 19
1.7. References ... 20
Chapter 2: Aldehdyes, Alcohols and Hydrogenation: A Brief Introduction ... 22
2.1.Aldehydes ... 22
2.1.1. Octanal ... 23
2.2.Alcohols ... 24
2.2.1. Octanol ... 25
2.3.Hydrogenation ... 26
2.3.1. Hydrogenation catalysts ... 27
2.3.2. Hydrogenation of aldehydes ... 28
2.4.References ... 31
Chapter 3: Catalyst Deactivation: A Short Overview and Case Study ... 33
3.1.Poisoning ... 34
3.2.Fouling ... 39
3.3.Leaching ... 40
3.4.Mechanical Stress ... 41
3.5.Sintering ... 42
3.6.References ... 44
Chapter 4: Experimental ... 47
4.1.Synthesis of Catalysts ... 47
4.1.1. Synthesis of CuO/Cr2O3 ... 48
4.1.2. Synthesis of CuO/SiO2 and CuO/Al2O3 ... 48
4.2.Catalyst Characterization ... 48
4.2.1. X-Ray Diffraction (XRD) ... 48
4.2.2. Scanning Electron Microscopy (SEM) ... 49
4.2.3. Transmission Electron Microscopy (TEM) ... 49
4.2.4. Inductively Coupled Plasma-Optical Emission Spectroscopy (ICP-OES) ... 49
4.2.5. Brunauer-Emmet-Teller (BET) surface area and pore volume ... 50
4.2.6. Temperature Programmed Reduction (TPR) and Temperature Programmed Desorption (TPD) ... 50
4.2.7. Thermogravimetric Analysis-Differential Scanning Calorimetry (TGA-DSC) ... 50
4.2.8. Infra-red (IR) spectroscopy ... 51
4.2.9. Catalyst characterization techniques used for the determination of catalyst deactivation mechanisms ... 51
4.3.Catalytic Testing ... 52
4.3.1. Reactor configuration ... 52
4.3.2. Packing of reactor tube ... 54
4.3.3. Experimental procedure for the hydrogenation reactions ... 55
4.3.4. Product analysis and quantification ... 56
4.4.References ... 58
Chapter 5: Results and Discussion: Catalyst Characterization ... 59
5.1.X-Ray Diffraction (XRD) ... 59
5.2.Scanning Electron Microscopy (SEM) ... 61
5.3.Transmission Electron Microscopy (TEM) ... 68
5.4.Inductively Coupled Plasma-Optical Emission Spectroscopy (ICP-OES) ... 73
5.5.Brunauer-Emmet-Teller (BET) surface area and pore volume ... 73
5.6.Temperature Programmed Reduction (TPR) ... 75
5.7.Temperature Programmed Desorption (TPD) ... 78
5.8.Thermogravimetric Analysis-Differential Scanning Calorimetry (TGA-DSC) ... 80
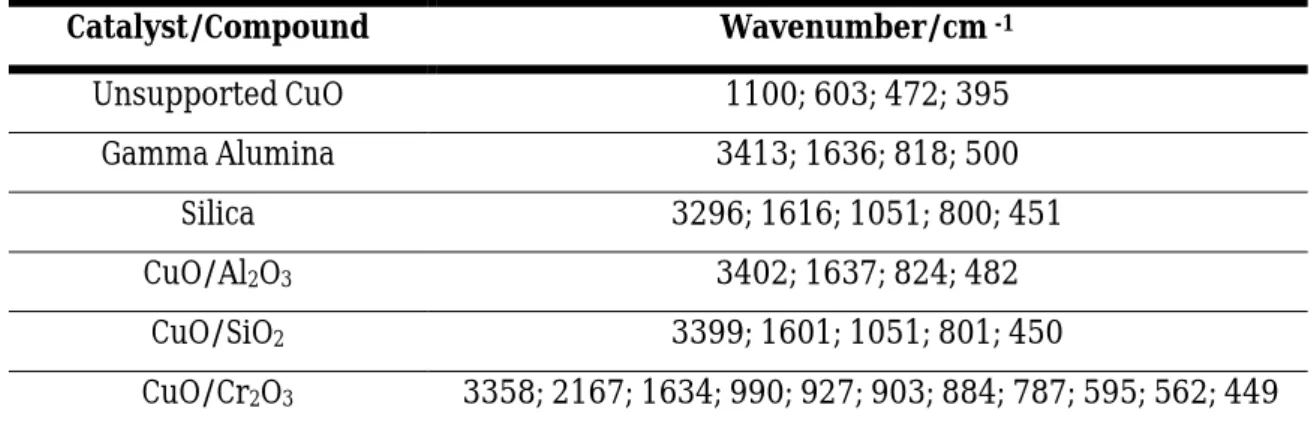
5.9.Infra-red (IR) spectroscopy ... 84
5.10References ... 87
Chapter 6: Results and Discussion: Catalytic Testing ... 89
6.1.Initial Study ... 90
6.1.1. Effect of temperature on octanal hydrogenation ... 90
6.1.2. Effect of hydrogen/aldehyde ratio on octanal hydrogenation ... 92
6.1.3. Other products ... 95
6.2.Water-impact Study ... 101
6.2.1. Effect of water on the hydrogenation of octanal using CuO/Al2O3 ... 103
6.2.2. Effect of water on the hydrogenation of octanal using CuO/Cr2O3 ... 105
6.2.3. Effect of water on the hydrogenation of octanal using CuO/SiO2 ... 108
6.3.Used Catalyst Characterization ... 112
6.3.1. X-Ray Diffraction (XRD) ... 113
6.3.2. Scanning Electron Microscopy (SEM) ... 114
6.3.3. Transmission Electron Microscopy (TEM) ... 115
6.3.4. Brunauer-Emmet-Teller (BET) surface area and pore volume ... 116
6.3.5. Thermogravimetric Analysis-Differential Scanning Calorimetry (TGA-DSC) ... 117
6.3.6. Infra-red (IR) spectroscopy ... 119
6.4.A Brief Summary of the results ... 121
6.5.References ... 122
Chapter 7: Summary and Conclusion ... 123
Appendix A: Additional Figures and Information ... 126
List of Abbreviations
ATR-IR Attenuated Total Reflectance-Infrared BET Brunauer Emmet Teller
CrOx Chromium oxides
EDS Energy Dispersive Spectroscopy
EXAFS Extended X-Ray Absorption Fine Structure FID Flame Ionization Detector
FT-IR Fourier Transform-Infrared FWHM Full Width at Half Maximum GC Gas Chromatography
GC-MS Gas Chromatography-Mass Spectrometry GHSV Gas Hourly Space Velocity
ICP-OES Inductively Coupled Plasma-Optical Emission Spectroscopy
IR Infrared
JCPDS Joint Committee on Powder Diffraction Standards LEED Low Energy Electron Diffraction
LHSV Liquid Hourly Space Velocity M0 Metal in the zero oxidation state mL Millilitre
MS Mass Spectrometry
NH3-TPD Ammonia Temperature Programmed Desorption PIXE Proton Induced X-Ray Emission
RRF Relative Response Factor
s Second
SADP Selected Area Electron Diffraction Pattern SAED Selected Area Electron Diffraction
SASOL South African Coal, Oil and Gas Corporation SEM Scanning Electron Microscopy
SEM-EDX Scanning Electron Microscopy-Energy Dispersive X-Ray SIMS Secondary Ion Mass Spectroscopy
TEM Transmission Electron Microscopy
TG/DTA Thermogravimetric Analysis-Differential Thermal Analysis TGA-DSC Thermogravimetric Analysis-Differential Scanning Calorimetry
TPH Temperature Programmed Hydrogenation TPO Temperature Programmed Oxidation XPS X-Ray Photoelectron Spectroscopy XRD X-Ray Diffraction
XRE X-Ray Emission
List of Figures
Figure 1.1: Potential Energy diagram (adapted from reference 7)10 ... 3
Figure 1.2: The heterogeneous catalytic cycle for the oxidation of carbon monoxide12 ... 4
Figure 1.3: An illustration showing the detectable signals that arise when the primary electron beam interacts with the sample19 ... 16
Figure 2.1: General structure of an aldehyde ... 22
Figure 2.2: Structure of octanal ... 24
Figure 2.3: General structure of an alcohol ... 24
Figure 2.4: Structure of octanol ... 25
Figure 4.1: Reactor design ... 52
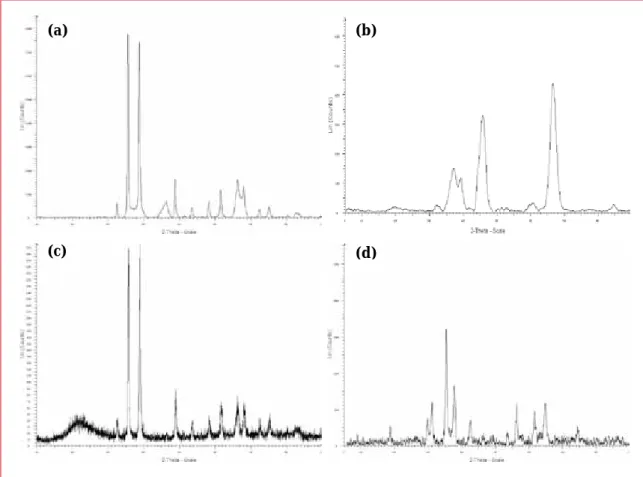
Figure 5.1: Diffractograms of (a) CuO/Al2O3; (b) Al2O3 support; (c) CuO/SiO2 and (d) CuO/Cr2O3 ... 60
Figure 5.2 (a) – (b): SEM images of CuO/Al2O3 ... 62
Figure 5.3 (a) – (b): Backscattered SEM images of CuO/Al2O3 ... 62
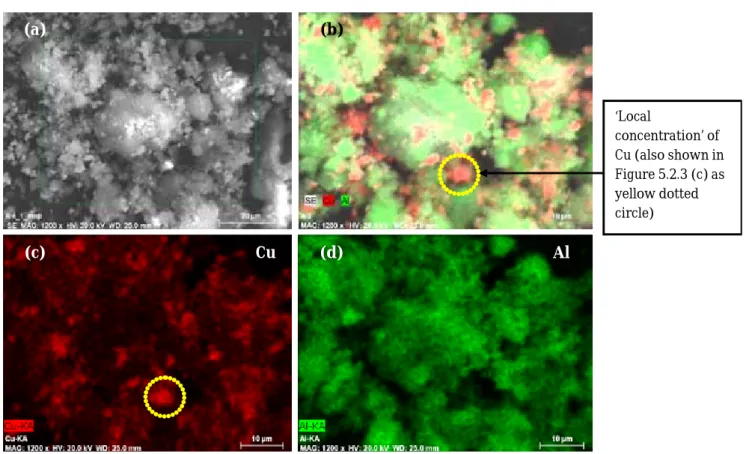
Figure 5.4: (a) Secondary SEM image and (b) – (d) EDS composition map data for CuO/Al2O3 ... 63
Figure 5.5 (a) – (b): SEM images of CuO/SiO2 ... 64
Figure 5.6 (a) – (b): Backscattered SEM images of CuO/SiO2 ... 64
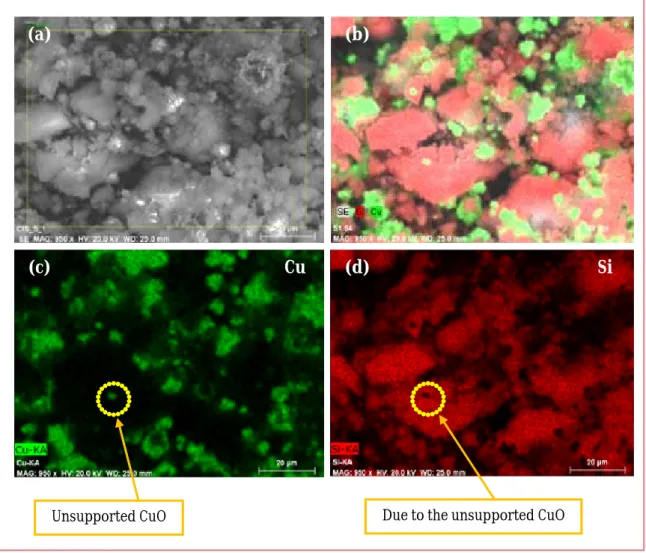
Figure 5.7: (a) Secondary SEM image and (b) – (d) EDS composition map data for CuO/SiO2 ... 65
Figure 5.8 (a) – (b): SEM images of CuO/Cr2O3 ... 66
Figure 5.9: Backscattered SEM image of CuO/Cr2O3 ... 66
Figure 5.10: (a) Secondary SEM image and (b) – (d) EDS composition map data for CuO/Cr2O3 ... 67
Figure 5.11 (a) – (c): TEM images of CuO/Al2O3 ... 68
(a) (b)
‘flower-like’
particles
Cu
Figure 5.12: SADP of CuO/Al2O3 ... 69
Figure 5.13: TEM image for CuO/SiO2 ... 70
Figure 5.14: SADP of CuO/SiO2 ... 71
Figure 5.15: TEM image for CuO/Cr2O3 ... 71
Figure 5.16: SADP for CuO/Cr2O3 ... 72
Figure 5.17: TPR Profile of (a) CuO/Al2O3; (b) CuO/SiO2; (c) CuO/Cr2O3 and (d) Unsupported CuO ... 76
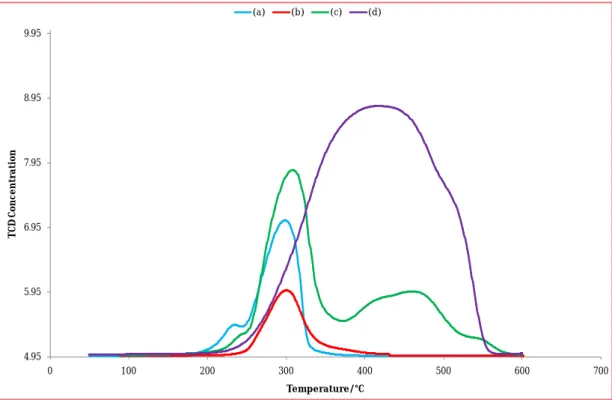
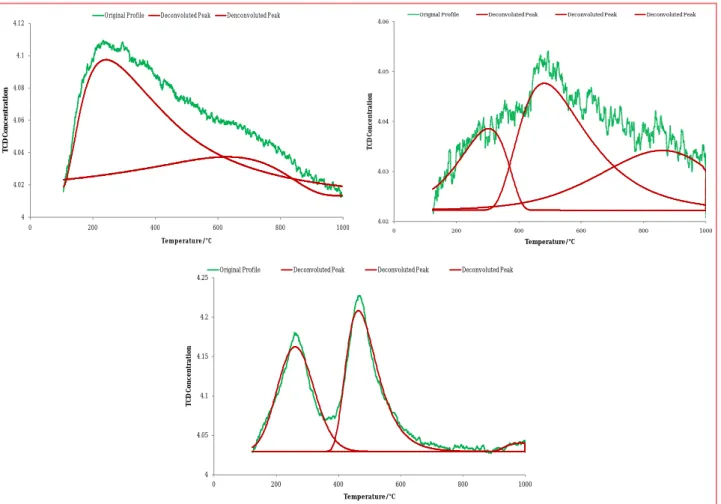
Figure 5.18: TPD Profile of (a) CuO/Al2O3; (b) CuO/SiO2 and (c) CuO/Cr2O3 ... 79
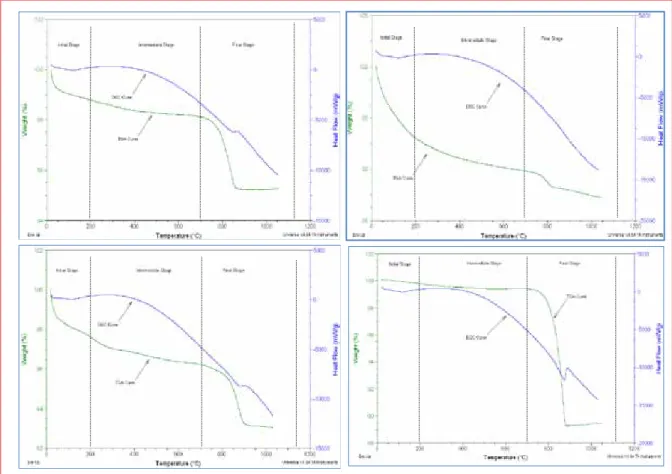
Figure 5.19: TGA-DSC curves of (a) CuO/Al2O3; (b) CuO/SiO2; (c) CuO/Cr2O3 and (d) unsupported CuO ... 82
Figure 5.20: IR spectra of (a) CuO/Al2O3; (b) CuO/SiO2; (c) CuO/Cr2O3; (d) Alumina; (e) Silica and (f) unsupported CuO ... 85
Figure 6.1: (a) Conversion of octanal and (b) Selectivity to octanol for the hydrogenation of octanal at 140; 160 and 180 °C ... 92
Figure 6.2: Conversion of octanal and selectivity to octanal at 160 °C and hydrogen/aldehyde ratios of one and two ... 93
Figure 6.3: Conversion of octanal and selectivity to octanol at 140 °C and hydrogen/aldehyde ratios of one and two ... 94
Figure 6.4: Graphical representation showing the by-products formed during the hydrogenation of octanal under various conditions ... 95
Figure 6.5: Selectivity to by-products formed during the hydrogenation of octanal at (a) 140 °C; (b) 160 °C and (c) 180 °C ... 100
Figure 6.6: Conversion of octanal and the selectivity to octanol for the hydrogenation of octanal using the fresh feed and the water-spiked feed ... 103
Figure 6.7: Selectivity to the various by-products formed during the hydrogenation of octanal using the fresh feed and the water-spiked feed ... 104 (c)
Figure 6.8: An illustration of the interaction between a water molecule and the surface
hydroxyl on alumina (Adapted from Thomas11) ... 105
Figure 6.9: Conversion of octanal and selectivity to octanol for the hydrogenation of octanal using fresh feed and water-spiked feed ... 106
Figure 6.10: Selectivity to the various by-products formed during the hydrogenation of octanal using the fresh feed and the water-spiked feed ... 107
Figure 6.11: Conversion of octanal and selectivity to octanol during the hydrogenation of octanal using fresh feed ... 108
Figure 6.12: Selectivity to the various by-products formed during the hydrogenation of octanal using fresh feed ... 109
Figure 6.13: Conversion of octanal and the selectivity to octanol during the hydrogenation of octanal using water-spiked feed ... 111
Figure 6.14: Selectivity to the various by-products formed during the hydrogenation of octanal using fresh feed and water-spiked feed ... 112
Figure 6.15: SEM image of Cu/SiO2 after (a) the reaction with fresh feed and (b) reaction with the water-spiked feed ... 115
Figure A 1: A simplified diagram showing a packed reactor tube ... 127
Figure A 2: H2 in situ diffractograms of CuO/Al2O3 ... 129
Figure A 3: H2 in situ diffractograms of CuO/Cr2O3 ... 130
Figure A 4: H2 in situ diffractograms of CuO/SiO2 ... 131
Figure A 5: Diffractograms of used Cu/Al2O3 after the reaction with fresh feed only and water-spiked feed ... 132
Figure A 6: Diffractograms of used Cu/Cr2O3 after the reaction with fresh feed only and water-spiked feed ... 133
Figure A 7: Diffractograms of used Cu/SiO2 after the reaction with fresh feed only and water-spiked feed ... 134
Figure A 8: SEM images of Cu/Al2O3 after (a) the reaction with fresh feed and (b) reaction with the water-spiked feed ... 135 Figure A 9: SEM images of Cu/Cr2O3 after (a) the reaction with fresh feed and (b) reaction with the water-spiked feed ... 135 Figure A 10: (a) – (c) EDS composition map data for Cu/Al2O3 used for the reaction with fresh feed ... 136 Figure A 11: (a) – (c) EDS composition map data for Cu/Al2O3 used for the reaction with water-spiked feed ... 136 Figure A 12: (a) – (c) EDS composition map data for Cu/Cr2O3 used for the reaction with fresh feed ... 136 Figure A 13: (a) – (c) EDS composition map data for Cu/Cr2O3 used for the reaction with water-spiked feed ... 137 Figure A 14: (a) – (c) EDS composition map data for Cu/SiO2 used for the reaction with fresh feed ... 137 Figure A 15: (a) – (c) EDS composition map data for Cu/SiO2 used for the reaction with water-spiked feed ... 137 Figure A 16: TEM images of Cu/Al2O3 after (a) the reaction with fresh feed and (b) reaction with the water-spiked feed ... 138 Figure A 17: TEM images of Cu/Cr2O3 after (a) the reaction with fresh feed and (b) reaction with the water-spiked feed ... 138 Figure A 18: TEM images of Cu/SiO2 after (a) the reaction with fresh feed and (b) reaction with the water-spiked feed ... 139 Figure A 19: TGA-DSC curves of Cu/Al2O3 after (a) and (b) the reaction with fresh feed and (c) and (d) reaction with the water-spiked feed ... 140 Figure A 20: TGA-DSC curves of Cu/Cr2O3 after (a) and (b) the reaction with fresh feed and (c) and (d) reaction with the water-spiked feed ... 140
Figure A 21: TGA-DSC curves of Cu/SiO2 after (a) and (b) the reaction with fresh feed and (c) and (d) reaction with the water-spiked feed ... 141 Figure A 22: IR spectra of Cu/Al2O3 after (a) the reaction with fresh feed and (b) reaction with the water-spiked feed ... 141 Figure A 23: IR spectra of Cu/Cr2O3 after (a) the reaction with fresh feed and (b) reaction with the water-spiked feed ... 142 Figure A 24: IR spectra of Cu/SiO2 after (a) the reaction with fresh feed and (b) reaction with the water-spiked feed ... 142
List of Schemes
Scheme 2.1: General reaction for the hydrogenation of an aldehyde ... 28 Scheme 2.2: Reaction pathways in the hydrogenation of α, β-unsaturated aldehydes15 .... 28 Scheme 2.3: Reaction for the hydrogenation of octanal to octanol ... 29 Scheme 6.1: Possible products formed from the aldol condensation of octanal (Adapted from Wang et al.4) ... 96 Scheme 6.2: Proposed mechanism for aldol condensation reactions over acid-base sites (Adapted from Wang et al.4) ... 97 Scheme 6.3: Acetal formation from octanal and octanol (adapted from Wang et al.4) ... 98
List of Tables
Table 1.1: Some examples of supports used for the active phase in selected catalytic reactions19 ... 8 Table 4.1.: A list of the deactivation mechanisms and the corresponding characterization technique used to determine its presence ... 51 Table 5.1: Showing the FWHM values and the XRD crystallite size for CuO at the highest intensity peak ... 61 Table 5.2: A summary of the range and average particle sizes determined for each catalyst ... 70 Table 5.3: A list of the copper loadings in each catalyst ... 73 Table 5.4: A list of the BET surface areas and total pore volumes for each catalyst ... 75 Table 5.5: List of temperature at maximum (Tm), degree of reduction and average
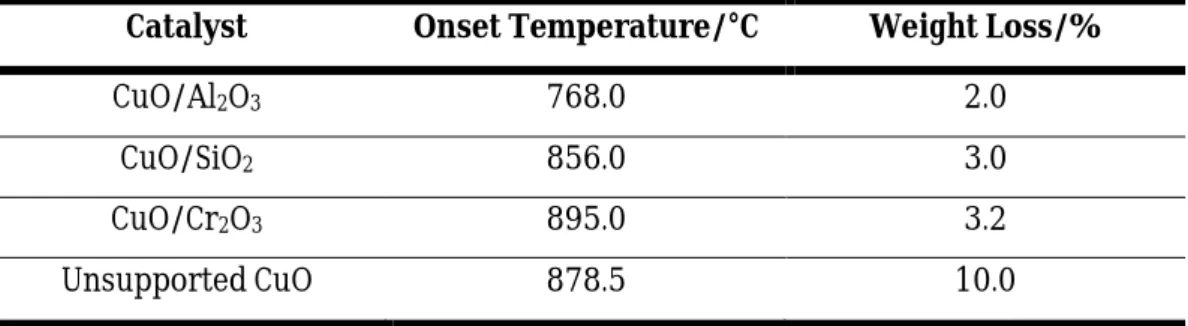
oxidation state of Cu for different catalysts as determined by H2-TPR ... 76 Table 5.6: A list showing the acid strength and acidity of each catalyst ... 79 Table 5.7: The weight losses seen for the Initial and intermediate Stages of the TGA-DSC curve for each catalyst ... 81 Table 5.8: A summary of the onset temperature and weight percent (wt %) loss for each catalyst in the final stage ... 82 Table 5.9: A list of the wavenumbers observed in the IR spectrum of each compound ... 86 Table 6.1: Selectivity to the by-products formed during the hydrogenation of octanal at 140 °C and hydrogen/aldehyde ratios of one and two ... 102 Table 6.2: Selectivity to the by-products formed during the hydrogenation of octanal at 160 °C and hydrogen/aldehyde ratios of one and two ... 102 Table 6.3: Showing the FWHM values and the crystallite size of the highest intensity Cu peak for each catalyst after the reaction using fresh feed and water-spiked feed ... 114 Table 6.4: A list of the BET surface areas and total pore volumes for each catalyst ... 117
Table 6.5: A list of the wavenumbers observed in the IR spectrum of each catalyst ... 119 Table 6.6: The weight losses seen for each catalyst in the TGA-DSC curve under N2 and static air environments ... 120 Table A 1: A summary of the range and average particle sizes determined for each
catalyst ... 139 Table A 2: A list of the copper loadings in the used Cu/SiO2 ... 139
Acknowledgements
First and foremost, all glory, honor and praise goes to my Lord and Savior Jesus Christ. He has brought me to the place that I am at and all that I have is only because of Him. I love you Jesus with all of who I am.
To my parents, thank you for your love, support and motivation. My daddy always took me where ever I needed to and go and waited rather patiently for me all the time. And my mum made sure that I never gave up and pushed me to do what I didn’t want to but it was worth all the effort in the end. I love you both!
Many thanks to Professor Holger Friedrich for his help and insight into the work and for always being ready to help and for making sure that I was always fine. I thank Dr James Wesley-Smith, Ms Sharon Eggers and Mrs Priscilla Martins (EM Unit at UKZN) for their help with and teaching me TEM and SEM. Thank you to Dr Sam Mahomed of SASOL R & D for initiating this project and for all the assistance during my studies. I thank Mr Francois Human and Mr Enrico Caricato of SASOL R & D; I really appreciate the assistance with the reactor setup. A special thank you goes out to Mrs Esti van Ryneveld of SASOL R & D for her constant readiness to help with all the reactor issues and for helping me know and learn all that I have in the last year.
Thank you to my friends for all the fun and laughter and being there for me. We made it through some tough times but we are still standing strong as The Dream Team! I thank the ‘oldies’ of the catalysis research group who were always ready to help and answer every question. Especially, Thirusha, I really appreciate everything that you have done for me and for imparting all your knowledge. And to all other members of group, thank you for anything that you have done.
And finally, to Calvin, thank you for being a support and always making sure that my work was done and being there to listen to my boring science. I love you!!!
Chapter 1
Introduction
Hydrogenation reactions catalyzed by supported metal catalysts are often used in the chemical industry. Such reactions find application in the preparation of pharmaceuticals and fine chemicals. Oxygenated compounds such as aldehydes are an example of the starting material utilized in catalytic hydrogenation in the fine chemicals sector.
Hydrogenation is often used in industry to convert products obtained from other processes that have little commercial importance to products with an increased demand and need in the chemicals industry.1, 2
One example of the above-mentioned is the hydrogenation of aldehydes, produced from the oxo process (hydroformylation). This reaction leads to the production of oxo alcohols which are important chemical commodities.3-7 It is possible, however, for impurities and by-products (formed upstream) to be present in the feedstock to the hydrogenation reaction. Water is an example of a possible contaminant in the feed to the hydrogenation reactor but this could negatively impact the reaction by causing catalyst poisoning. This can lead to the deactivation of the catalyst, since it has been shown that water, in both the liquid and vapor form, can cause catalyst deactivation8-11 (discussed further in Chapter 3).
Since hydrogenation of oxo aldehydes leads to the production of important organic chemicals,7 it is essential for catalyst deactivation, if any, to be avoided or delayed. For this study, octanal has been used as a model aldehyde to investigate the influence of water during the hydrogenation reaction. The results of this study will help ascertain the effects of water on the hydrogenation catalysts studied and consequently on the conversion of octanal and selectivity to octanol. Supported metal catalysts that are often utilized for commercial hydrogenation processes include copper supported on silica (Cu/SiO2), copper supported on chromia (Cu/Cr2O3) and copper supported on alumina (Cu/Al2O3).
These catalysts are therefore attractive for use in this study.
In order to understand the results of this study, knowledge of catalysis and the concepts associated with it is required. This information is provided in Sections 1.1 – 1.5.
1.1. Catalysis
Catalysis refers to “the phenomenon occurring when a catalyst acts”.12 Two types of catalytic systems exist, namely homogeneous catalysis and heterogeneous catalysis. The definitions of these two types of catalysis are based upon the phase in which the chemical reaction takes place. Homogeneous catalysis refers to a single phase chemical reaction without the existence of a phase boundary, whilst heterogeneous catalysis is when the chemical reaction occurs at an interface of two phases (the phase boundary separates the catalyst from the reactant molecules).13 The phases in which catalytic reactions can occur are in solution, within solution-like confines of micelles and the molecular-scale solution pockets of large enzyme molecules, within polymer gels, within molecular-scale cages of crystalline solids and on the surface of solids.14
1.1.1. Fundamental principles of catalysis
Chemical thermodynamics and chemical kinetics are areas that are central to the understanding of catalysis. Chemical kinetics forms the quantitative framework of catalysis, whilst the qualitative framework is provided by reaction mechanisms.14 Catalytic reaction kinetics forms the basis for the definitions of activity, selectivity and stability. The activity of a catalyst is given by the reaction rate, or reaction rate constant for the conversion of reactants and products. The selectivity of a catalyst is a measure of the catalyst’s ability to direct the conversion to the desired product.14 Since a catalyst accelerates the rate of a chemical reaction; it indicates that the reaction must be able to occur without a catalyst. It is also important that the chemical equilibrium reached remains unchanged with the use of a catalyst.13
The potential energy diagram shown in Figure 1.1 can be used to explain the steps that occur in a catalyzed reaction. Initially, the reactants are transported to the catalyst and are then adsorbed onto the surface of the catalyst. These adsorbed reactants interact with each other to form the product. This product is then desorbed from the catalyst surface and transported away from the catalyst.13 In order for these steps to occur, the activation
energy for the catalyzed reaction must be lower than for the uncatalyzed reaction. This is graphically illustrated in Figure 1.1 in which it is shown that the potential energy for a catalyzed reaction is much lower than for the corresponding reaction without a catalyst.12
Figure 1.1: Potential Energy diagram (adapted from reference 7)15
1.2. Heterogeneous Catalysis
This project was based on heterogeneous catalysis occurring on the solid surface of metals. Section 1.1 highlighted the definition of heterogeneous catalysis. Using heterogeneous catalysis for this study is advantageous since there is simple separation and recovery of the catalyst.16 This will allow for spent catalyst characterization which is a necessity for a deactivation study. In addition, heterogeneous catalysis is best suited for the investigation since this type of catalysis is used for gas- and liquid-phase operations and continuous-reactor operations.16 In the subsections to follow, aspects specific to heterogeneous catalysis are highlighted.
Catalyst
Reactants
Catalyst
Catalyst
Catalyst
Non-catalytic reaction Catalyzed reaction
Potential Energy
Adsorption
Reaction
Desorption
Product released and catalyst left unchanged Product
1.2.1. The catalytic cycle
Figure 1.2 shows a graphical representation of molecular and atomic level processes involved in a catalytic reaction. The process outlined in Figure 1.2 uses carbon monoxide (CO) oxidation as an example.
Figure 1.2: The heterogeneous catalytic cycle for the oxidation of carbon monoxide17
With reference to Figure 1.2, gas phase diffusion is the first step of the catalytic process.
The molecule diffuses through the gas phase to the metal surfaces and adsorbs to it in a molecular form. It is then followed by surface diffusion, when the dissociation of a molecule into atoms may occur depending on the internal bond strength of the molecule.
The surface reaction then occurs, where the O2 atoms react with the CO to form the adsorbed product, CO2. This step is often the rate determining step of the catalytic reaction. The final step of the cycle is product desorption, where the product to surface bond is broken, CO2 enters the gas phase, diffuses down the catalyst pores to emerge at the end of the reactor.17
1.2.2. Surface adsorption
The adsorption of the reactant gas molecule onto the catalyst surface is the first step of the catalyst cycle.17 Two types of adsorption exist, these being chemisorption and physisorption. Chemisorption involves the molecules and surface making contact by
means of the formation of a chemical bond. When the contact between the molecule and surface is made possible through a physical process involving weak Van der Waals forces, the adsorption is termed physisorption.14 The advantage of the adsorption of the gas phase molecule onto a solid surface is that the intermediate is stabilized. The absence of the interaction or contact between the gas phase reactant molecule and the catalyst surface would result in the intermediate having unsatisfied valences and a relatively unstable configuration.17
1.3. Catalysts
Catalysts are the key ‘ingredient’ to an efficient chemical process and the occurrence of the processes of life and are responsible for making possible the fundamental principle of catalysis that was highlighted in Section 1.1.1. It is necessary to remember that in creating this new and easier pathway for reactant molecules to be converted into product molecules, catalysts do not get consumed in the reaction, instead, they are regenerated during the rearrangement to product molecules.12
1.3.1. Types of catalytic material
Various types of catalytic material exist ranging from solid materials to biological enzymes, from gas phase molecules to liquid coatings on surfaces. Metals and many types of metal oxides are used. Metals are attractive as catalysts due to their high surface energy making them highly active, however selectivity to the desired product must also be considered. Many metal catalysts are placed on a support, such as alumina or silica, since these metal catalysts are thermally unstable in the high surface area form that they must be used in.17 The shape of the catalyst is also important to allow for efficient functioning of the catalytic process and reactor. Catalysts can be in a powder form, or as pellets with various pore sizes. The shape or physical form of the catalyst used depends on the process it is to be used for and on the reactor system which it will be used in.17
Catalysts can be made in a variety of ways. The most common methods are impregnation, slurry precipitation, co-precipitation, fusion, physical mixing, wash coating and pelleting.
Pelleting is used to make the macroscopic form of the catalyst which is used in the
industrial plant. The method chosen to make the catalyst depends on the individual synthesizing it and the properties desired in the catalyst.17
1.3.2. Supported metal catalysts
The most commonly used catalyst in industry is the supported metal and metal oxide catalyst, making it an important component of heterogeneous catalysis.18 Such catalysts play a major role in society and the economy.19 The commercial applications that utilize these catalysts include oil refining, chemicals manufacture and environmental catalysis.
These applications encompass reactions such as oxidation, (de)-hydrogenation and isomerization.19, 20 Synthesizing supported catalysts must produce a catalyst with high activity, selectivity and stability.21 To achieve such features, the active metal phase must be highly dispersed throughout the support, resulting in a large specific surface area and maximum specific activity. The catalyst support can disperse the metal and increase its thermal stability and hence the catalyst life.21 Supported metal catalysts are discussed in more detail in the subsections to follow.
1.3.2.1. Reasons for supporting catalysts
A catalyst is supported because the support can:
(a) Act as a thermal stabilizer, where the support stabilizes the catalyst against agglomeration and coalescing;
(b)Act as a component enhancing selectivity (the support causes resistance to by- product formation) or poison resistance;
(c) Decrease the density of the catalyst and allow for the diluting of costly ingredients with less costly ingredients and
(d)Resist breakage and minimize pressure drop (achieved using supports such as saddles, rings, etc.).22, 23
1.3.2.2. Effects of supporting a metal catalyst
The attachment of the support can have the following beneficial effects:
(a) The support can not only be an inert backbone but also promote selectivity by leading to the preferred orientations of the substrate at the catalytic site;
(b)The supported metal catalyst can have different chemical properties to the non- supported metal catalyst;
(c) Using a multidentate ligand as a support for a metal catalyst can alter the stereochemistry around the metal ion;
(d)The position of the equilibrium between metal ions and their surrounding ligands may be altered by supporting the metal catalyst and
(e) Catalytically active structures that are normally unstable can be stabilized with the use of a support.23
It is clearly seen that the attachment of the support to the metal catalyst produces a united catalyst that can possess the advantage of being highly selective.23 This further supports the use of supported catalysts for this study.
1.3.2.3. Types of supports
There are two main classes of supports that exist. These are organic polymers and inorganic supports. Polymers that function as supports include polystyrene, polypropylene, polyacrylates and polyvinyl chlorides. Such supports possess advantages such as easy functionalization, chemical inertness and a wide range of physical properties;
however, these polymers have poor mechanical properties and heat transfer abilities.
Inorganic supports, on the other hand, possess this quality that organic polymers lack.
Silica, alumina, glasses, clays and zeolites are among the inorganic supports that have been used. Other supports include titania, zirconia, chromia and other metal oxides.
Inorganic supports tend to be mainly metal oxides and contain hydroxyl groups which affect attachment.23 Table 1.1 lists some supports and the catalytically active phase and selected reactions that they have been used for.
Table 1.1: Some examples of supports used for the active phase in selected catalytic reactions24
Support Catalytically Active Phase Application
γ-Alumina, Al2O3
Cu-ZnO Methanol synthesis
Pd, Pt, Ru, Rh Hydrogenation
Silica, SiO2
CrOx Polymerization
V2O5 Oxidation
Carbon Pd, Pt Hydrogenation
1.3.2.4. Preparation of supported metal catalysts
Three methods are commonly used to prepare supported metal catalysts. These methods are:
(i) Impregnation or ion-exchange of the metal catalysts on the support;
(ii) Co-precipitation;
(iii) Deposition precipitation;
(iv) Drying and calcination and (v) Reduction.21
1.3.2.4.1. Impregnation methods
Impregnation preparation methods can be subdivided into two categories: (a) incipient or dry wetness and (b) wet or soaking impregnation. These categories are classified based on the amount of solution used. Generally, impregnation methods involve contact between the support and a certain quantity of the metal precursor (often a salt) followed by aging, drying and calcination.21
(a) Incipient wetness
In this technique, the evacuated support is stirred while the impregnating solution is sprayed on the support. A primary requirement for successful synthesis of a supported metal catalyst is that the metal precursor is distributed evenly throughout the support.
This is easily achieved in this technique by the evacuation of the air trapped in the inner pores. The advantages associated with this technique are that it is a simple and economical preparation method yielding reproducible metal loadings.21 A disadvantage, however, is that the reproducible metal loading is dependent on the solubility of the metal precursor.21
(b)Wet impregnation
In contrast to incipient impregnation, wet impregnation is distinguished by the use of an excess of solution with respect to the pore volume of the support. The procedure is similar to dry impregnation, involving aging, stirring, filtering and drying. Since precursor-support interaction is encountered, the concentration of the metal precursors on the support is dependent on the concentration of the solution, the pore volume of the support and the type and/or concentration of adsorbing sites existing at the surface.21
1.3.2.4.2. Co-precipitation
This procedure involves the addition of a precipitating agent to prepared solutions of the metal salt of the catalytically active material and the support. This produces hydroxides and/or carbonates, which, after washing, can be transformed to oxides by heating.21, 24 The method of co-precipitation yields a porous material with high surface area and a uniform distribution on a molecular scale of the different active species in the final catalyst.21, 24 The following variables must be carefully controlled during the synthesis:
(a) Mixing (must be efficient);
(b)The procedure and order in which solutions are added;
(c) Temperature;
(d)Aging time of precipitate;
(e) Filtering;
(f) Washing procedure and (g) pH.21
The co-precipitation method for synthesizing supported metal catalysts has evolved into the most preferred synthetic route since it can produce catalysts with a metal loading greater than 10 – 15 %.21
1.3.2.4.3. Deposition precipitation
This method involves the precipitation of a metal hydroxide or carbonate on the particles of a powder support by the reaction of a base with the metal precursor.21 The rate of nucleation and growth of the particles inside the pores of the support affects the distribution of the particles on the support. Ideally, rapid nucleation and growth is unwanted since it produces large crystallites and inhomogeneous distribution.21 Thus, an essential requirement for this preparation method becomes an efficient mixing in conjunction with a slow addition of the alkali solution. Following this step are filtration, washing, drying and heating. The disadvantage of this preparation method is that catalysts contain a low concentration of metal.21
1.3.2.4.4. Drying
Once the supported catalyst is prepared, it becomes necessary to remove the solvents used in the previous steps. The drying treatment is usually performed at temperatures between 80 °C and 200 °C.21
1.3.2.4.5. Calcination
The process of calcination causes the decomposition of the metal precursor which produces an oxide and generates gaseous products such as H2O and CO2. This heat treatment allows for the removal of these gases as well as anions and cations introduced in the previous preparation steps. The temperature chosen to calcine the catalyst is one that is higher than the temperature of the reaction. In addition, the heat treatment
process is carried out in an oxidizing atmosphere. Not only can the process of calcination decompose the catalyst, it can also cause sintering of the precursor or the formed oxide and the possibility of a reaction between the formed oxide and the support occuring.21
1.3.2.4.6. Reduction
Thermal treatment of the metal oxide or metal precursor in hydrogen flow, reducing it to a metal is termed reduction. Variables such as rate of heating, final temperature and time of reduction, hydrogen concentration and flow must be carefully selected based upon the type of metal, catalytic system and reaction to be performed. Essential requirements for this treatment are:
(a) A low water vapor concentration to prevent detrimental effects with dispersion of the metal;
(b)High enough hydrogen flows so that the water can be removed from the support during reduction and
(c) Direct reductions of some metal precursors should be avoided. For example, metal chlorides should not be directly reduced since this produces corrosive hydrochloric acid in the presence of water vapor.21
1.4. Catalytic Reactors
Chemical reactions that utilize catalysts are termed catalytic reactions and those vessels that are specifically designed to host these types of reactions are termed catalytic reactors. A number of reactor types exist and some examples include:
(a) Fixed-bed reactors;
(b)Fluidized-bed reactors;
(c) Batch reactors;
(d)Bubble column reactors;
(e) Continuous stirred-tank reactors and
(f) Trickle column reactors.12
A fixed-bed reactor contains a tube that is packed with ‘coarse’ catalyst particles through which the reactants flow. This obstacle to gas flow by the catalyst particles creates a pressure drop across the bed, thus demanding the application of positive pressure at the inlet to ensure a optimum flow rate.12 Fluidized bed reactors are similar to fixed-bed reactors in that they are also used for gaseous reactants. However, in the fluidized bed reactor, the catalyst is made up of fine particles, causing the gas to attain a critical velocity upon flowing upwards through the catalyst bed. As a result, the catalyst bed expands to a great extent, which influences the movement of the particles, hence the term fluidized bed.12 Batch reactors are used when the reactant is a gas as well as a liquid and has the catalyst as a fine powder suspended in the liquid reactant or solution which is kept under stirring. The continuous stirred-tank reactor and the trickle-column reactor may also be used for gaseous and liquid reactants. A ‘coarse’ catalyst is used for both these reactors, however for the trickle column, the catalyst is packed into a column, whilst in the continuous stirred-tank reactor, it is held in a wire-mesh basket which is rotated in the liquid as gas is bubbled below it.12
1.5. Fundamental Terminology
In catalytic reactor work and catalysis in general, there are a number of terms that need to be known. This is necessary since much of the quantitative data is determined by these concepts. These terms include contact time, space velocity, activity, selectivity, conversion and yield.
Contact time refers to the average time spent by a reactant molecule on the catalyst bed.
It is determined by the free volume in the bed (inclusive of the pore volume) divided by the flow rate of the gas.12 Contact time can be determined using the formula given by Equation 1.1.
Space velocity is the reciprocal of the contact time and is the number of volumes of gas flowing through the free volume of the catalyst in unit time.12 The space velocity is frequently expressed in h-1 provided that the quantities of the catalyst and the reactants are expressed in the same units. Depending on the phase in which the reactant is, the space velocity may be termed gas hourly space velocity (GHSV) or liquid hourly space velocity (LHSV).25 Equation 1.2 is the mathematical representation of space velocity and can be used to determine this value.
The yield of a product may be described as the amount, in mass or moles, of the product obtained from the quantity of reactant used. The yield of any particular product can be determine from Equation 1.3.25
The conversion of a reactant (X) may be described as the amount of X that has reacted from the quantity of X introduced into the reaction system. The conversion of reactant X can be determined from Equation 1.4.25
The selectivity of a catalyst, as defined in Section 1.1.1, is dependent on the reaction system as well as the duration of the reaction. In addition, a catalyst’s selectivity is a function of conversion.25 Using Equation 3 and 4, the formula for the determination of selectivity is given by Equation 1.5.
The activity of a catalyst refers to the rate of chemical change occurring in the catalytic system or how fast the chemical reaction reaches equilibrium in the presence of a catalyst.14, 26, 27 The more complex route to the determination of the activity of a catalyst is by calculating kinetic activities derived from fundamental rate laws. A simpler route exists in which the activity of a catalyst can be determined from a more practical viewpoint.26 The activity of a catalyst may be determined from the reaction rate, which is given by the conversion of the reactant per unit time per volume or mass of catalyst.
However, for comparative measurements and particularly for deactivation studies, there are four activity measures that may be used. These activity measures are:
(a) Conversion when the reaction conditions are kept constant;
(b)Space velocity when there is a known constant conversion;
(c) Space-time yield (amount of product formed per volume of catalyst per unit time) and
(d)Temperature that is needed for a particular conversion.26
Of these four activity measures, the most suitable route for the determination of the activity of the catalysts in this study is by comparing the conversion when the reaction conditions are kept constant.
1.6. Catalyst Characterization
The information discussed in the preceding sections lays the foundation required to understand catalytic testing and the quantitative aspects of it. However, explaining the observed trends from the catalytic testing requires catalyst characterization. 28 In addition, the information obtained from various characterization techniques provides useful information that can explain the catalytic functionalities of the catalysts being used and the observed trends for a particular reaction under investigation.28 Some methods for characterization are spectroscopy, microscopy, diffraction and methods based on adsorption and desorption or bulk reactions.24 The basis of the properties of a heterogeneous catalyst surface is its composition and structure on the atomic scale, thus making the primary focus of catalyst characterization the examination of the surface atom by atom under the reaction conditions in which the catalyst functions. However, various factors such as the presence of metal oxide, or sulfide particles, can make catalyst characterization complex. Thus, a simplified model catalyst in its operating system is
created to characterize the catalyst.24 There are a number of characterization techniques that are available; however only a few are utilized for any particular study. Techniques such as Low Energy Electron Diffraction (LEED), Secondary-Ion Mass Spectroscopy (SIMS) and X-Ray Photoelectron Spectroscopy (XPS) form a more sophisticated class of methods and are generally used for specialized model systems. Other techniques such as X-Ray Diffraction (XRD), Extended X-Ray Absorption Fine Structure (EXAFS), X-Ray Emission (XRE) and Proton Induced X-Ray Emission (PIXE) are more universally applicable.22 Some of the characterization techniques utilized in this study are discussed below.
1.6.1. X-Ray diffraction
X-Ray Diffraction (XRD) is a commonly used characterization technique and has existed for a long time. This method yields information that allows for the identification of the crystalline phases inside the catalysts. The information is obtained by means of lattice structural parameters. An insight into the particle size is also obtained from the XRD data.
This technique is attractive for catalyst characterization since the information obtained from the analysis is clear and can sometimes be obtained under reaction conditions.
However, such information is obtained for large crystalline particles only, hence either too small or amorphous particles will not be detected.24
1.6.2. X-Ray photoelectron spectroscopy
The use of X-ray Photoelectron Spectroscopy (XPS) as a catalyst characterization technique yields information pertaining to the elemental composition, the oxidation state of the elements and sometimes the dispersion of one phase over another.24 The physical phenomenon occurring in this technique is the photoelectric effect where a photo emission or auger process may occur. In this technique, the intensity of photoelectrons as a function of their kinetic energy is measured. Also, the photoelectron peaks are labeled according to the quantum numbers of the level from which the electron originates.24 The assignment of each peak in an XPS spectrum to a particular element is obtained by looking at the binding energy tables. XPS is also useful for surface morphology determination in that it can recognize how well particles are dispersed over a support.24 Since XPS measures the intensity from particles and the intensity of the support, it
becomes ideal to utilize when techniques such as electron microscopy, particle size determination and hydrogen chemisorption cannot distinguish between support and active phase.24
1.6.3. Electron microscopy
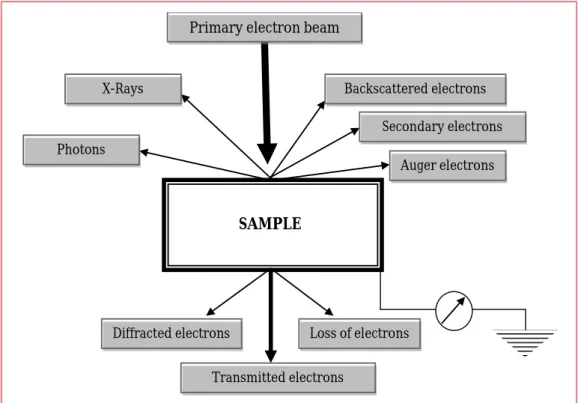
Electron microscopy is used to determine the size and shape as well as the surface morphology of supported particles. Due to the interaction between the primary electron beam and the sample, a number of detectable signals arise. Each type of detectable signal forms the basis of the various types of electron microscopy techniques that exist. The illustration in Figure 1.3 shows, in short, what happens when a primary electron beam strikes the sample.24
Figure 1.3: An illustration showing the detectable signals that arise when the primary electron beam interacts with the sample24
As discussed by Chorkendorff and Niemantsverdriet 24, once the primary electron beam strikes the sample, the following phenomenon occurs resulting in the respective signals:
Backscattered electrons Secondary electrons
Auger electrons X-Rays
Photons
Transmitted electrons
Loss of electrons Diffracted electrons
SAMPLE Primary electron beam
- Electrons are diffracted by particles yielding crystallographic information provided that these particles are favorably oriented towards the beam.24 Such information is obtained by performing selected area electron diffraction using the Transmission Electron Microscope (TEM). The diffraction patterns obtained may be used to determine information about the crystal structure of the particles.
- Electrons can collide with atoms in the sample and be scattered back.24 Such events may be investigated using Scanning Electron Microscopy (SEM) with a backscattered electron detector. The use of a backscattered electron detector allows for atomic number contrast to be investigated. This is because the ability of an element to back scatter electrons is dependent on how heavy the atom is.
Thus, heavier atoms will appear brighter in a backscattered image since these atoms will produce more backscattered electrons.29
- Auger electrons and X-Rays are formed in the relaxation of core-ionized atoms.
The X-Rays emitted allow for the determination of the elemental composition of a material since characteristic X-Rays are emitted for each element.24
- In addition to these processes, electrons may be lost or cause the excitation of characteristic transitions in the sample and photons are emitted causing cathodoluminescence.24
These detectable signals have formed the basis of the microscopy techniques that exist today, namely, TEM and SEM. Scanning electron microscopy is based on the interaction of the primary electron beam with the sample and the detection of the secondary electrons and can determine contrast due to the topology and composition of a surface.
Transmission electron microscopy is based on the interaction of the primary electron beam with the sample and the detection of the transmitted electrons. The electron beam in TEM projects all the information of the sample being analyzed in a two dimensional image of sub-nanometer resolution. This image produced is the bright field image. A dark field image may also be obtained (using the diffracted electrons) in which the regions of the sample that produce a selected reflection (a spot) in the diffraction pattern will appear bright in the dark field image.24, 30 This characterization technique is useful for particle size determination or particle distribution determinations as well as for obtaining crystallographic information of the sample.24
1.6.4. Temperature-programmed reactions
Temperature-programmed reactions involve monitoring a chemical reaction while the temperature increases linearly with time. The reactions that may be monitored are reduction, oxidation and/or sulfidation, as well as ammonia desorption. Temperature- Programmed Reduction (TPR) gives information on the temperature required for the complete reduction of a catalyst and the degree to which it is reduced. Temperature–
Programmed Oxidation (TPO) and Temperature-Programmed Sulfidation (TPS) analyses are useful for studying the oxidation and sulfidation processes, respectively, as well as the catalysts used for these processes.24 Ammonia–Temperature Programmed Desorption (NH3-TPD) is often used for the determination of surface acidity. The NH3-TPD profile obtained allows for the determination of the acidity of the catalyst and the strength of the acid sites.31, 32 Due to the small size of the ammonia molecule, it has the ability to enter the pores of the catalysts and to react with the Brønsted and Lewis acid sites.32 Acidity measurements are useful since their determination allows for the prediction of catalytic activity and in addition, the results obtained from catalytic reactions may be correlated to the acidity of the catalyst used.31
1.6.5. Brunauer-Emmett-Teller Method
The Brunauer-Emmett-Teller (BET) method is a gas adsorption method used for the determination of the surface area of finely divided and porous materials. This technique also allows for the determination of pore size distribution. The most applicable adsorptive for surface area determinations is generally nitrogen.33
1.6.6. Inductively coupled plasma-optical emission spectroscopy
Inductively Coupled Plasma–Optical Emission Spectroscopy (ICP-OES) is used for the determination of the elemental composition of the catalyst. The catalyst is digested prior to analysis and thus the elemental composition of the entire sample is determined. This technique is preferred since it is faster than other available spectroscopic techniques such atomic emission spectroscopy and there is a good detection limit and a high linear range.34
1.6.7. Thermogravimetric analysis and differential scanning calorimetry Thermogravimetric Analysis (TGA) is used to determine the changes in weight with changes in temperature. The peaks obtained in a TGA curve correspond to the loss of molecules from the sample. Differential Scanning Calorimetry (DSC) is a technique that is used to determine endothermic or exothermic processes. The peak area under a DSC curve is equal to the enthalpy change. The use of DSC will indicate whether the weight loss observed in the TGA analysis is an exothermic or endothermic process.
1.6.8. Infra-red spectroscopy
Infra-Red (IR) is a diagnostic tool utilized for the determination of functional groups present in the catalyst. Molecules vibrate or rotate at specific frequencies. These frequencies correspond to discrete energy levels and it is on this that IR spectroscopy is based. When a sample is analyzed using this technique, it is subjected to infrared light.
This light passes through the sample and is absorbed. The amount of this light that is not absorbed is transmitted and is detected by the instrument. This information can be related to wavelengths at which the energy is absorbed. These absorption wavelengths correspond to specific functionalities that make-up a compound. Attenuated Total Reflectance (ATR) is used together with IR spectroscopy however it allows for direct analysis of solids and liquids. This technique is based on total internal reflection and uses an ATR crystal that is in contact with the sample.
1.7. References
1. R. N. Landau, U. Singh, F. Gortsema, Y. Sun, S. C. Gomolka, T. Lam, M. Futran and D.
G. Blackmond, J. Catal., 1995, 157, 201.
2. R. M. Rioux and M. A. Vannice, J. Catal., 2003, 216, 362.
3. X. Wang, G. Li and U. S. Ozkan, J. Mol. Catal. A: Chem, 2004, 217, 219.
4. X. Wang and U. S. Ozkan, J. Mol. Catal. A: Chem, 2005, 232, 101.
5. X. Wang, R. Y. Saleh and U. S. Ozkan, J. Catal., 2005, 231, 20.
6. X. Wang and U. S. Ozkan, J. Catal., 2004, 227, 492.
7. J. J. McKetta, Encyclopedia of Chemical Processing and Design, Marcel Dekker Inc., New York, 1990.
8. W. B. Burford and J. C. W. Frazer, J. Am. Chem. Soc., 1945, 67, 331.
9. J. Chang, T. Lin and C. Cheng, Ind. Eng. Chem. Res., 1997, 36, 5096.
10. Z. Ma, R. Jia and C. Liu, J. Mol. Catal. A: Chem, 2004, 210, 157.
11. W. Wang, M. Qiao, H. Li, W. Dai and J. Deng, Appl. Catal. A: Gen., 1998, 168, 151.
12. G. C. Bond, Heterogeneous Catalysis: Principles and applications, Oxford University Press, Oxford, 1974.
13. G. C. Bond, Principles of Catalysis, The Chemical Society, London, 1972.
14. B. C. Bates, Catalytic Chemistry, John Wiley & Sons Inc., New York, 1992.
15. ESA - Impress Catalysts or making it happen,
http://www.sapceflight.esa.int/impress/text/education/Images/Catalysis/Image _002.png, Accessed 24/11/2009.
16. R. A. Sheldon and R. S. Downing, Appl. Catal. A: Gen., 1999, 189, 163.
17. M. Bowker, The basis and applications of Heterogeneous Catalysis, Oxford University Press, Oxford, 1998.
18. A. J. v. Dillen, R. J. A. M. Terörde, D. J. Lensveld, J. W. Geus and K. P. d. Jong, J. Catal., 2003, 216, 257.
19. K. P. d. Jong, Curr. Opin. Solid State Mater. Sci., 1999, 4, 55.
20. B. L. Mojet, J. T. Miller, D. E. Ramaker and D. C. Koningsberger, J. Catal., 1999, 186, 373.
21. F. Pinna, Catal. Today, 1998, 41, 129.
22. F. R. Hartley, Supported Metal Complexes: A new generation of catalysis, D. Riedel Publishing Company, Holland, 1985.
23. A. B. Stiles, Catalyst Supports and supported metal catalysts: Theoretical and applied concepts, Butterworths Publishers, Stoneham, 1987.
24. I. Chorkendorff and J. W. Niemantsverdriet, Concpets of modern catalysis and kinetics, Wiley -VCH Verlag GmBH & Co. KGaA, Weinham, 2003.
25. J. Haber, Pure & Appl. Chem., 1991, 63, 1227.
26. J. Hagen, Industrial Catalysis A Practical Approach, Wiley-VCH, Weinham, 1999.
27. C. N. Satterfield, Heterogenous catalysis in industrial practice, Second edn., Krieger Publishing Company, Malabar Florida, 1996.
28. G. V. Sagar, P. V. R. Rao, C. S. Srikanth and K. V. R. Chary, J. Phys. Chem. B, 2006, 110, 13881.
29. J. J. Bozzola and L. D. Russell, Electron Microscopy: Principles and techniques for biologists, Jones and Bartlett Publishers, Boston, 1992.
30. D. H. Kay, Techniques for electron microscopy, Blackwell Scientific Publishers, Oxford, 1965.
31. D. R. Brown and C. N. Rhodes, Thermo. Acta, 1997, 294, 33.
32. A. M. Venezia, V. L. Parola, B. Pawelec and J. L. G. Fierro, Appl. Catal. A: Gen., 2004, 264, 43.
33. K. S. W. Sing, D. H. Everett, R. A. W. Haul, L. Mascou, R. A. Pierotti, J. Rouquérol and T. Siemieniewska, Pure & Appl. Chem., 1985, 57, 603.
34. D. A. Skoog, D. M. West, F. J. Holler and S. R. Crouch, Fundamentals of Analytical Chemistry, Eighth edn., Thomson Brooks/Cole, Belmont, 2004.
Chapter 2
Aldehydes, Alcohols and Hydrogenation: A Brief Introduction
Chapter 1 discussed the concepts used to describe catalytic data. By using the characterization techniques outlined in Section 1.6, an understanding of the make-up of the catalyst will be provided. This will aid in explaining the catalytic data obtained.
However, a comprehensive reasoning of the observed catalytic results such as selectivity and conversion requires knowledge of the reaction under investigation and the structure of the reactants. Thus, since this study investigates the hydrogenation of octanal to octanol, a brief introduction to these compounds and the hydrogenation of octanal is provided in this chapter.
2.1. Aldehydes
An aldehyde is a type of organic compound belonging to the Class II carbonyl compound since it does not possess a functionality that can be replaced by a nucleophile.1 The general structure of an aldehyde is given in Figure 2.1, which shows that an aldehyde is comprised of a carbonyl group (C=O), a hydrogen and an alkyl or aryl group (-R) that is bonded to the carbonyl carbon. Aldehydes often possess a characteristic pleasant odor and are generally in a liquid form and have a high boiling point.1, 2
Figure 2.1: General structure of an aldehyde
C O
R H
There are a number of routes via which aldehydes may be prepared by. Industrially, however, aldehydes are typically synthesized by the oxidation of the related alcohol.3 Another commercially known process that yields an aldehyde as a product is the hydroformylation of an olefin to produce an aldehyde having one additional carbon to that of the olefin reactant. The synthetic routes for the synthesis of aldehydes include:
(a) Hydroboration – oxidation of a terminal alkyne;
(b)Primary alcohol oxidation by e.g. pyridinium chlorochromate;
(c) Swern oxidation of a primary alcohol and (d)Rosenmund reduction, amongst others.1
Due to the properties that an aldehyde possesses (namely the polarity of the C=O group and the acidity of the α-hydrogen), these compounds have become attractive for uses in many other organic reactions. The reactions that exist for aldehydes as a starting material include:
(a) Reduction of the aldehyde to a primary alcohol;
(b)Oxidation of aldehydes to carboxylic acids;
(c) Cannizzaro reaction;
(d)Nucleophilic addition reactions and (e) Displacement at the α-carbon.2
Aldehydes are widely used for small scale reactions. In industry, formaldehyde is the most commonly used aldehyde. Some common uses for aldehydes are as solvents, in perfumes, as flavoring agents, as well as intermediates in the plastics, dyes and pharmaceutical industries.2, 3
2.1.1. Octanal
Octanal is an organic compound that belongs to the aldehyde group of organic compounds and may also be known as capryl aldehyde, caprylic aldehyde or octyl aldehyde.4 As can be seen fro