Genetic relation of C02 and its suitable usage in the Peninsular Malay Basin.
By
Mohd AI Fatah Bin Zakariyah
Final Report submitted in partial fulfillment of the requirements for the
Bachelor of Engineering (Hons) Petroleum Engineering
APRIL2011
Universiti Teknologi PETRONAS Bandar Seri Iskandar
31750 Tronoh Perak Darul Ridzuan
CERTIFICATION OF APPROVAL
Genetic relation of C02 and its suitable usage in the Peninsular Malay Basin.
Approved by,
By
Mohd AI Fatah Bin Zakariyah
A project dissertation submitted to the Universiti Teknologi PETRONAS in partial fulfillment of the requirement for the
Bachelor of Engineering (Hons) Petroleum Engineering
April2011
Asso · te Professor,
Swapan Kumar Bhattacharya, Universiti Teknologi PETRONAS, Bandar Seri Iskandar ,
31750 Tronoh, Perak Dam! Ridzuan
CERTIFICATION OF ORIGINALITY
This is to certify that I am responsible for the work submitted in this project, that the original work is my own except as specified in the references and acknowledgements, and that the original work contained herein have not been undertaken or done by unspecified sources or persons.
Mohd AI Fatah Bin Zakariyah Petroleum Engineering Student Universiti Teknologi PETRONAS Bandar Seri Iskandar
31750 Tronoh
Perak Darul Ridzuan.
ACKNOWLEDGEMENT
First and foremost I would like to express my sincere gratitude to my project supervisor, Associate Professor Dr Swapan Kumar Bhattacharya, for his
encouragement, guidance and support from the initial to the final level enabled me to develop an understanding of the subject. I was privileged to experience a sustained enthusiastic and involved interest from his side. This fueled my enthusiasm even further and encouraged me to boldly step into a better student.
My deep sense of gratitude to PETRONAS Carigali Sdn Bhd and PETRONAS Management Unit for provides me the data to complete this project. Thanks and appreciation to the helpful people at PETRONAS Carigali Sdn Bhd and PETRONAS Management Unit, for their support.
Last but not least, I would also thank to Universiti Teknologi PETRONAS and Faculty of Geosciences and Petroleum Engineering without whom this project would have been a distant reality. I also extend my heartfelt thanks to my family and fellow clique.
ABSTRACT
Reservoirs with high C02 content are connnon throughout the Asia Pacific region, notably the Gulf of Thailand, Malaysia, Indonesia and Vietnam. In Malay Basin, C02 production ranges from 5 to 90% mol. The high production of C02 is concentrated in certain region in the Malay Basin. The most notable high production of C02 is the northern region near Thailand and the center of Malay Basin. The comprehensive study on C02 genetic relation and its source haven't been established yet. For this project the authors have studied the origin of produced C02 in order predicts the continuous supply for field development program. The author also made a comprehensive study on the tectonic framework, stratigraphy, various plays and geothermal gradient of Malay Basin to relate with the existence of associated gas. For the development program EOR operation is preferable among others since it is the suitable due to numerous of C02 supply from the field. The C02 flooding operation will be discussed in this report where the details modeling for reservoir and well are established to predict the performance of the reservoir with C02 flooding. Results from the modeling indicate C02 flooding as EOR may be suitable for further development plan to increase the production of oil up to 20 % from naturally flow well. In the fmal chapter of this report, the author relates the statigraphy, heat flow and plays in Malay Basin to conclude the finding on origin of C02 in Malay Basin. The high production of C02 is mainly originated from inorganic origin while low production of C02is from organic origin; The isotopic value of
o
13C is used to distinguish between these two types of C02 .Contents
PROJECT BACKGROUND ... 5
1.1 Background study ... ; ... 5
1.2 Problem Statement ... 5
1.3 Objective ... 7
1.4 Scope of Study ... 7
1.5 The relevancy of the project ... 7
LITERATURE REVIEW ... 8
2.1 Sources of Carbon Dioxide ... 8
2.1.1 Thermal degradation of organic matter ... 8
2 .1.2Thermal breakdown of carbonates ... 8
2.1.3 Inorganic clay reaction ... 8
2.2 Isotopes of carbon ... 9
2.2.1 Stable Isotopes ... 9
2.3 Malay Basin (The Petroleum Geology and Resources of Malaysia, 1999) ... 11
2.3.1 Tectonic Framework ... 11
2.3 .2 Stratigraphy and Palaoenviroments ... 13
2.3 .3Hydrocarbon Plays and Trap styles ... 15
2.3.4 Migration and Entrapment ... 16
2.4 Prediction of C02 occurrence in South East Asia (Scott W. Imbus L*, B. J. (1998)) ... 17
2.4.1Empirical associations with basin attributes ... 18
2.4.2 Statistical associations with reservoir attributes and fluid composition ... 18
2.4.3 Neural network analysis ... 19
2.5 Organic-rich tropical rivers and their role in C02 and methane generation (Robert C Shoup, and Yutthorn Gonnecome, 2009) ... 20
2.5.1 Origin Theory ... 21
2.6 Carbon isotopic signature of C02 in Arthit gas field, Northern Malay basin, the Gulf of Thailand (S. Pisutha-Amond & A. Sirimongkolkitti, V. Pisutha-Amond, 2008 ) ... 22
2.7 Possible Inorganic Origin of the High C02 Gas Reservoirs in the Platong and the Erawan Gas Fields, Gulf of Thailand (Masashi Fujiwara, Makoto Yamada, Akio Sasaki,
2009) ...•...•...•..•.•...•...•..•... 27
2.8 Enhanced Oil Recovery in Malaysia: Making it Reality (M.K Hamdan, ,N. Dannan, D. Hussain,Z. Ibrahim) ... 28
2.8.1 Challenges and Obstacles ... 29
2.9 Enhanced Oil Recovery in Malaysia: Making it Reality Part 2 (Y. Samsudin. N. Dannan, D. Husain, M.K Hamdan, PETRONAS Carigali Sdn Bhd, 2005) ... 30
2.9.1 Dulang Field (Immiscible WAG) ... 30
2.9.3 West Lutong Field ... 31
3.0 Petex (Petroleum Experts) ... 31
3.0.1Mbal ... 31
3.0.2 PROSPER ....•... 32
3.1 Material Balance Principle ... 33
3 .1.1 Gas Cap Expansion ... 34
3.1.2 Release gas volume ... 35
3 .1.3 Remaining Oil Volume ... 35
3.1.4 Rock and Connate Water Expansion ... 35
3.1.5 Water lnflux ... 36
METHODOLOGY ... 37
3 .I Methodology Flowchart ... 37
3.3 Distribution of C02 in Malay Basin ... 38
3.4 C02 flooding modeling ... 39
3.4.1Reservoir modeling ... 40
Data preparation ... 40
Reservoir definition ... 41
PVT correlations matching ... 41
3.4.2 Well modeling ... 41
PVT correlation matching ... 42
IPR prediction ... 42
Vertical Flow Correlation Matching ... 42 2
Injector Well ... ; ... 43
RESULTS AND DISCUSSION ... 44
4.1 C02 genetic relation ... 44
4.2 Results from rnodeling ... 45
CONCLUSION ... 48
REFERENCES ... 50
Gantt chart for FYP 1 ... 51
Gantt chart for FYP 2 ... 52
Project Activities for FYP ! ... 53
Project activities for FYP 2 ... 53
List of Figures
Figure I: Malay Basin (Petroleum System of Malay Basin Province Malaysia, 2002) ... 6
Figure 2 : Gas Reserves in Malaysia ... 6
Figure 4: Antclines Axes zones (The Petroleum Geology and Resources of Malaysia, 1999) .. 12
Figure 3: Basement Depth and faults zones (The Petroleum Geology and Resources of Malaysia, 1999) ... 12
Figure 5: Structural and Fault zones (The Petroleum Geology and Resources of Malaysia, 1999) ... 12
Figure 6: Generalised stratigraphy, hydrocarbon occurrences and structural history of the Malay Basin (EPIC, 1994) ... 13
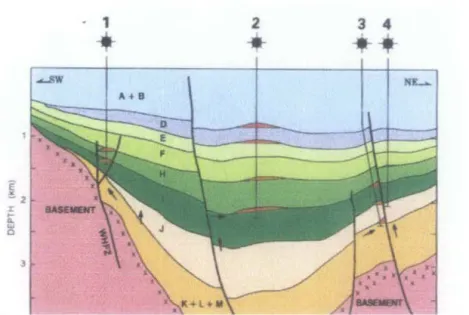
Figure 7: Cross section of Malay Basin with different trapping style zones (The Petroleum Geology and Resources of Malaysia, 1999) ... 15
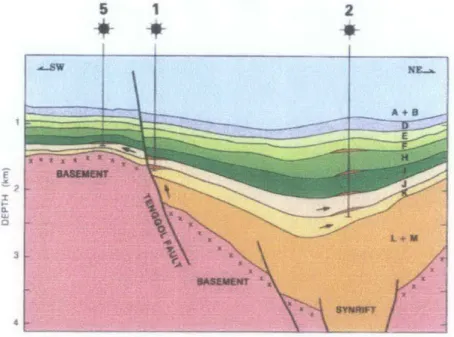
Figure 8: Cross section of Malay Basin with different trapping style zones (Resource: The Petroleum Geology and Resources of Malaysia, 1999) ... 16
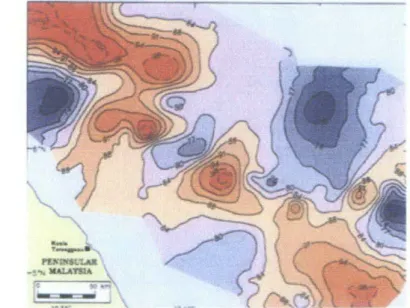
Figure 9: Heat Flow in the Malay Basin zones (Resource: The Petroleum Geology and Resources of Malaysia, 1999) ... 16
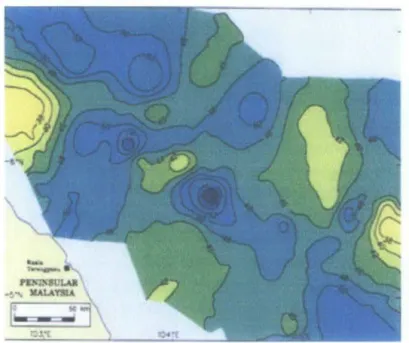
Figure 10: Geothermal gradient in the Malay Basin zones (Resource: The Petroleum Geology and Resources of Malaysia, 1999) ... 17
Figure 12: Carbon isotope fractionation factors of C02 and ... 24
Figure 13: Cross plot between C02 contents and carbon ... 25
Figure 14: Carbon isotope compositions of major carbon ... 25
Figure 15: Cross plot between C02 contents and Carbon isotopic ... 26
Figure 16: The generation of gases from organic matter with ... 26
Figure 11: Oil reserves in Malaysia ... 28
Figure 17: Mba! workflow ... 32
Figure 18: Material Balance Principle ... 34
Figure 19 : Distribution of C02 in the Malay Basin (The Petroleum Geology and Resources of Malaysia, 1999) ... 38
Figure 20 : Contour map of C02 distribution (The Petroleum Geology and Resources of Malaysia, 1999) ... 38
Figure 21: Cross plot of Cross plot of liB C against mole% for C02 in Malay Basin (The Petroleum Geology and Resources of Malaysia, 1999) ... 44
Figure 22: C02 migration route (The Petroleum Geology and Resources of Malaysia, 1999) .. 45
Figure 23: Reservoir production (without C02 flooding) ... 45
Figure 24: Reservoir production (with C02 flooding) ... 46
4
CHAPTER I
PROJECT BACKGROUND
1.1 Background study
The Malay Basin, located to the south of the Gulf of Thailand, covers an area of around 80,000 km2 with sediment thickness up to 14 krn in the basin centre. The basin can be broadly subdivided into a northern-central gas-prone province and a southern oil- prone province, save for some minor exceptions to this generalization such as the gas trend occurring in the south western margin and the oil trend on the north eastern flank of the basin. The abundance of hydrocarbon reserves testifies to the presence of effective Oligocene/Early Miocene and Early Miocene/Middle Miocene petroleum systems, each sourced by lacustrine and fluviodeltaic source rocks, respectively. Both hydrocarbon and non-hydrocarbon (particularly carbon dioxide) gases also occur as large accumulations in the Malay Basin. Furthermore, the accumulation of carbon dioxide is reported higher in the north of Malay Basin. As such carbon dioxide prediction is an important aspect for future exploration and also for commercialized purposes.
1.2 Problem Statement
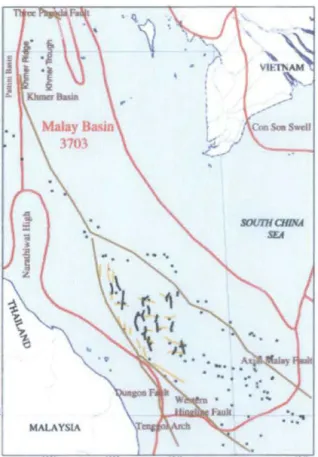
The amount of C02 encountered in wells in the Malay Basin (Figure I) varies from a few percentage points to as high as 90%. Although the geographical distribution of C02
in the Malay Basin is probably understood, the stratigraphic distribution of C02 still posses many questions. So far, there is no predictive technique available to estimate the genetic relation and concentrations of C02 production in Malay Basin. It is important to understand the source and the distribution of the COz and how it can be fully utilize to increase the production of declining field nearby.
Figure 2 : Gas Reserves in Malaysia
6
1.3 Objective
The main objectives of this project are to study the genesis of carbon dioxide in the Malay Basin to understand its magnitude as supply source. The geologic information and geothermal gradient of Peninsular Malay Basin will be studied to determine the relation between genesis of carbon dioxide with thermal changes. The s.e.cond objective is to study the modes of commercial utilization of produced carbon dioxide.In this context, the author will focusing on C02 flooding.
1.4 Scope of Study
Production of carbon dioxide in the Malay Basin Reservoir Engineering
Reservoir rock and properties Petroleum Geosciences
Reservoir Rock and Fluid Properties Petroleum Experts (PROSPER, MBAL)
In the nutshell, students need to apply their knowledge gained in study into real solving problems situation.
1.5 The relevancy of the project
This project allows students to:
• Integrate and relate the knowledge acquired from the various petroleum engineering sub-disciplines.
• This project is relevant for EOR study for PETRONAS.
CHAPTER2
LITERATURE REVIEW
2.1 Sources of Carbon Dioxide
There are four sources which carbon dioxide C02 can be produced, one organic and three inorganic.
2.1.1 Thermal degradation of organic matter
In organic process, the carbon dioxide is produced resulted from thermal degradation of organic matter which occurs during diagenesis and catagenesis. Both of this process plays important role in hydrocarbon generation. Diagenesis is a changes and alterations that take place on skeletal (biological) material in a burial context that done by bacterial activity and low-temperature chemical reactions. It covers temperature range up to approximately 50°C.Chain decomposition activity form kerogen to condensate and gas with increasing temperature is called catagenesis. The catagenesis range is from about 50°C to 200°C.
2.1.2Thermal breakdown of carbonates
Carbon dioxide from this reaction is a result of endothermic reaction of thermal cracking of carbonates at high temperature probably. Group 2 of carbonates decomposed on heating to produce carbon dioxide as explained by below reaction
CaC03(s) -+CaO (s) + C02 (g) 2.1.3 Inorganic clay reaction
The inorganic source is important source of C02in the deeper sections of sedimentary basin (Hutcheon et a!, 1980). The reaction is explains by following expression.
8
5FeC03 + Si02 + AhSbOs (OH)4 +2H2 <---> FesAhShOw(OH)s + 5 C02
The isotopic composition of this C02 depends on the isotopic composition of the precursor carbonate. However the average isotopic composition of carbonates in metamorphic rock is around -6% (Ohmoto and Rye, 1979).
2.1.4 Volcanic Activity
Carbon dioxide can be derived from several sources in volcanic area which are subduction and or partial melting or the metamorphism of the siliceous or carbonate rock/sediments (Mary et. AI 200 I). Arc volcanic gases can also incorporate carbonate rich fluids from crustal metamorphism and metasomatic reaction triggered by magmatic heating. The third source of carbon dioxide is volatilization of entrapped water itself at mean temperature and pressure (J.P Lockwood, Richard W Hazlet, 201 0).
2.2 Isotopes of carbon
Isotopes are different types of atoms (nuclides) of the same chemical element, each having a different number of neutrons. In a corresponding manner, isotopes differ in mass number (or number of nucleons) but never in number. The number of protons (the atomic number) is the same because that is what characterizes a chemical element.
For example, carbon-12, carbon-13 and carbon-14 are three isotopes of the element carbon with mass numbers 12, 13 and 14, respectively. The atomic number of carbon is 6, so the neutron numbers in these isotopes of carbon are therefore 12-6 = 6, 13-6 = 7, and 14-6 = 8, respectively.
2.2.1 Stable Isotopes
The isotopes for C12 and C13 are stable isotopes. The isotope C13is distributed sediments of all geological ages and can be used to solve many geochemical problems because its difference in mass relative to carbon-12 results in fractionation by both biological and physical processes.
Above equation calculate the ratio difference of C 13 per C 12 in parts per thousand, relative to the standard. The standard established for C 13 work was the Pee Dee Belemnite or (PDB) and was based on a Cretaceous marine fossil, Belemnitella Americana, which was from the Pee Dee Formation in South Carolina. This material had an anomalously high 13C: 12C ratio and was established as 13C value of zero. Use of this standard g1ves most natural material a negative 813C (http://en. wikipedia.org/wiki/%CE%9413C).
~...-. .. ~ -~-._...,.,..~~"~''""f"jll07" ,--~~''"">'~~· ·v~...,..---~ ... ~-.--- _,.., -..---.-.-- ... "!'"·~-~-~•·-·--~· .. ~ -~- -· ···-~
r
'"
-~"'-" .. ... ,::__..___.. .... ~-L ~'-- 0 - c;· . __ _.
---··
_,...) __.____
:_ .. ~ .. ~---~ - <:.___,._.~Thermal degradation of organic matter -8 to -12 Thermal destruction of carbonates +4 to -5 Bacterial oxidation of methane -20 to -59
Volcanic degassing -8
Atmospheric C02 -8
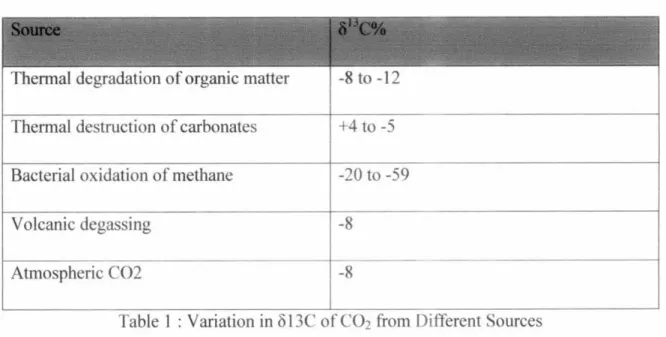
Table I : Variation in 813C of C02 from Different Sources
Above table explains that different sources of carbon dioxide cause different 813C values of carbon. As we can see thermogenic C02 from organic material has more negative 813C values from decomposition of carbonates while bacterial oxidation of methane results in wide range of813C value.
10
2.3 Malay Basin (The Petroleum Geology and Resources ofMalaysia,1999)
The Malay Basin is situated in the southern part of the Gulf Of Thailand between Vietnam and Peninsular Malaysia. The basin continues northwestwards to merge with Thailand's Pattani Trough and southwestwards with the Indonesia's West Natuna Basin (Figure Below).
2.3.1 Tectonic Framework
The Malay Basin s located at the center of Sundaland, the cratonic core of Southeast Asia and elongate NW-SE trending , about 500 km long and 250 km wide underlain by a pre-Tertiary basement of metamorphic, igneous and sedimentary rocks.
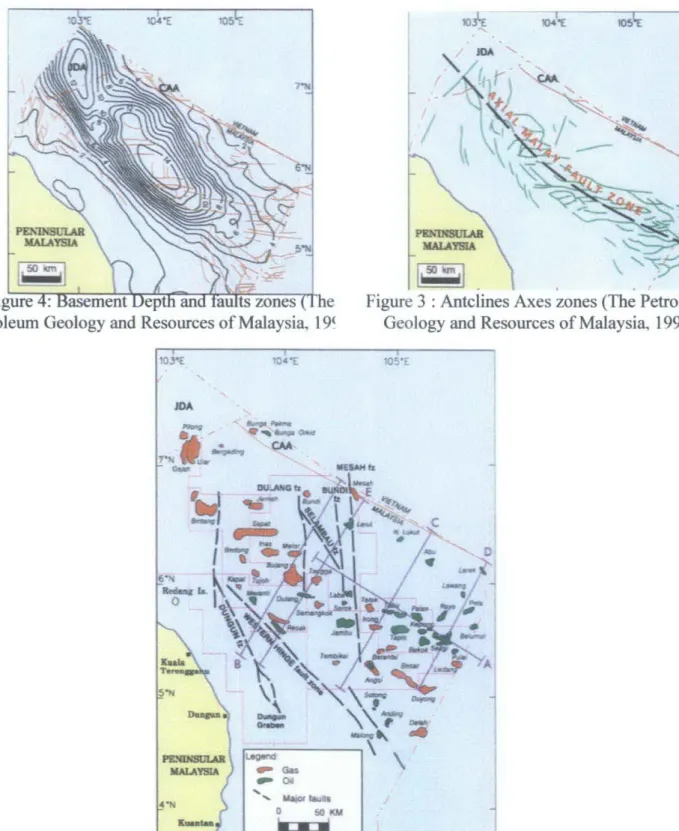
The basin is bounded by relatively shallow basement; the Terengganu Platform and Tenggol Arch to the southwest, the Narathiwat High to the northwest. The basement represents the late Mesozoic continental landmass that existed before the basins were formed. The Malay Basin is asymmetrical along its length and in cross section. Its southwestern flank is slightly steeper than its northeastern flank. Basement faults in the southeastern and central parts of the basin mostly trend E-W represent overall basin trend. The southwestern margin is marked by the Western Hinge Fault (WHF). To the south of WHF the Tenggol Fault marks the northeastern edge of Tenggol Arch. The Dungun Fault is a splay of the WHF that cut across the Terengganu platform on the southwestern flank of the Malay Basin. The Malay Basin is a complex rift composed of numerous extensional grabens. Most of these grabens have been penetrated because of their great depths but were interpreted from magnetic, gravity, and seismic data (Mazlan B Hj Madon, Peter Abolins, Mohammad Jamal B Hoesni, Mansor B. Ahmad, 1999).
10J'£
5"N
-= ~- { \
4"N
a--,
~
- Ges
- 0.1
' ' lapllullll 0 !JO KM
....
I '
...
50 11m I : IFigure 3 : Antclines Axes zones (The Petrolc Geology and Resources of Malaysia, 1995
105•£
l i
!
Figure 5: Structural and Fault zones (The Petroleum Geology and Resources of Malaysia, 1999)
2.3.2 Stratigraphy and Palaoenviroments
The Malay Basin strata are subdivided into seismostrt.atigraphic units. Each unit is bounded by basin-wide seismic reflectors. The groups are designated alphabetically in order of increasing age, from A to M. The stratigraphic development of the Malay Basin is directly related to its structural evolution which occurred in 3 phases: 1) a pre Miocene (Oligocene or earlier) extensional or synrift phase, 2. An Early to Middle Miocene thermaVtectonic subsidence phase and 3.a late Miocene -Quaternary subsidence phase.
AGE GROUP > z LITHOLOGY FACIES OIL/
w GAS
-<>
- ~
• -¢-
• -¢-
•-¢-
• -¢-
• -¢-
• '¢-
SOURCE ROCK
II)
~~.~_
: r -~=
c n - c
~-
u -
--
c n -
..J
·-
0
(.)
UJD
..J c
%
:!o
za:
....II)
:;:,
0 ~o
STRUCTURAL HISTORY
~~IU ~
2 IU
ffi•9
:riCIO
1- ID
I~
LEGEND
D
Fl.J\IIAl & EST\:A~INESANDS
D
MARII'oE AhD :>ELTA FRONT SANDSD
COASTAL PLAIN AND OFFSHORE SHA!.ESD
lACUSTRINE s.;ALES~ COALS
D
AllUVIAl FAWAlllN!Al PlAI ... SEDIMENTSFigure 6: Generalised stratigraphy, hydrocarbon occurrences and structural history of the Malay Basin (EPIC, 1994)
The pre-Miocene phase represents the extensional phase of the basin development, during which subsidence was controlled by faulting. Initially, sedimentation in isolated
half graben depocenters deposited thick synrift successiOns of alternating sand- dominated and shale-dominated, fluviolacstrine sequences (figure above). Group M to K, which fill the extensional sub-basins, comprise the deposits of braided streams, coastal plains, lacustrine deltas and lakes. These deposits show increasing lacustrine influence towards the basin center (Mohd Tahir Ismail et al., l994).Extensional faulting ceased during Late Oligocene. Continued thermal subsidence, however resulted in deposition of Group L to D. The basin was probably at or near sea level by Early Miocene times, as indicated by the abundance of coal-bearing strata in the succession. The fist sign of the marine inundation were recognized from micropalaeontlogy within Lower Mocene strata (Azmi Mohd Y azkzn et al., 1994; Mod Tahir Ismil et al., 1 994).A cyclic sucession of offshore marine , tidal-eustraine ,coastal plain and fluvial sediments was deposited in the Lower to Middle Miocene. Groups I and J consist of progradational to aggradational fluvial to tidally-dominated estuarine sands.
Group H and F are dominantly marine to deltaic sediments with flvial/eustarine channels, deposited during an overall sea-level rise. Group E and D were deposited by the progradational stacking of dominantly fluvial/estuarine channels and culminated with a localized erosional unconformity.The Early-Middle Miocene period of thermal/tectonic subsidence was accompanied by compressional deformation which resulted in local inversion of half grabens by re-activation of their bounding faults and a major uplift in the southeastern part of the basin. The unconformity is overlain by undeformed marine sediment of Groups A and B. Deformation was contemporaneous with sedimentation, such that erosion and non-deposition on the crests of the structures occurred simultaneously with deposition on the flanks. It is estimated that up to I 200m of sediment may have eroded off the crests of some structures (Murphy 1989). Inversion is more severe in the southeastern part of the basin; while sedimentation of Groups D, E and Fin the central and northern parts of the basin was relatively continuous .Sediments in the north may have been derived partly from erosion of pre-existing sediment in the south.
14
2.3.3Hydrocarbon Plays and Trap styles
Compression Anticlines
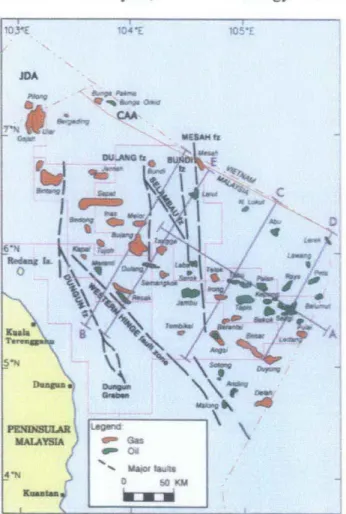
Hydrocarbon distribution map indicates that compressional anticlines in south are oil- prone while those in the northern part are gas prone. In the south, most of anticlines are either domal or asymmetrical and often compartmentalized by normal faults. The main reservoirs are shallow marine and fluvial sandstones of Group H, I, J and K.The compressional anticlines in the central part of the basin involves reservoir in Group D and E sands.Most traps are formed by 4-way dip closures in domal structures or assymetrical anticlines and normal fault-bounded structures as shown in Figure 5 and 6.The reservoiras are formed by shallow marine sandstone if Group D and E. There are major gas trend in the southwestern part of the basin, close to the Tenggol Fault. This is the Angsi-Duyong trend (Figure 6).These larger compressional anticlines are structurally similar to those in the main oil province to the north, and are underlain by synrift half-grabens controlled by normal faults.
1 2 3 4
* * **
A+B
Figure 7: Cross section of Malay Basin with different trapping style zones (The Petroleum Geology and Resources of Malaysia, 1999)
15
e
,.-,
:r....
0.. ....
0
3
5
*
...
1..
2Figure 8: Cross section of Malay Basin with different trapping style zones (Resource: The Petroleum Geology and Resources of Malaysia, 1999)
2.3.4 Migration and Entrapment
The Malay Basin is a relatively young Tertiary basin which explains the significantly high present-day surface heat flow especially northern and central parts of the basin.
Geothermal in Malay Basin vary from about 32°Ckm-1 on the flank and increase to 53°Ckm-1 in the basin centre basin (Figure 8). High Heat flows of around 105mwm-2 are recorded in the axial region, decreasing towards the basin flanks (Figure 7).
Figure 9: Heat Flow in the Malay Basin zones (Resource:
The Petroleum Geology and Resources of Malaysia, 1999) 16
Figure 10: Geothermal gradient in the Malay Basin zones (Resource: The Petroleum Geology ru Resources of Malaysia. 1999)
2.4 Prediction of C02 occurrence in South East Asia (Scott W. lmbus L*, B. J.
(1998))
In this study a detailed basin model and geohistories and available comprehensive compositional and isotopic data on hydrocarbon/ non-hydrocarbon gas component are constructed. All of the data are examined at four different levels of details.
(1) Circumstantial- assigning origin based on the presence or absence of major known or suspected geologic elements.
(2) Empirical- tally of C02 level vs. geologic elements over the entire study area.
(3) Statistical - cross plotting and linear regression of% C02 and numerical reservoir attribute and fluid data for a set of basin complexes (two or more basins of similar tectonic setting and in geographic proximity).
(4) Neural network - multivariate analysis of pre-screened, potentially influential parameters over the entire study area.
17
Results
Circumstantial- assigning origin based on the presence or absence of major known or suspected geologic elements
Geological features (for example: basement type, sediment thickness) and high geothermal gradient have no effect in the production of
co1.
Table 2: Possible influences on C02 distribution
".'l.lEmp•ncai assoc1anons with Dasm attributes
C02 abundance is categorized as (low= <10%, moderate =10-25%, high= >25%). Basin related influences in Table 2 are te1med the empirical approach. Among the associations made are seen in Table 3.Basinal factors such as specific tectonic setting and major structural features (e.g. fault type and density)have a significant effect on C02 abundance while major basinal factor (such as thermal alteration of carbonates and humic organic matter) doesn't affect the C02 production.
2.4.2 Statistical associations with reservoir attributes and fluid composition
Reservoir-related attributes are considered qualitatively (e.g. % C02 vs lithology) and quantitatively (%C02 vs depth, pressure, temperature, porosity, permeability, water saturation, % N2 and % H2S content and % gas dryness. The raw data used are compiled in Table 4. Carbon dioxide levels appear to be slightly higher in carbonate, relative to clastic reservoirs (mean: 18.4 vs 11.3%, respectively). Mixed clastic and carbonate reservoirs appear to have the lowest C02 levels (mean: 7.4%). Cross- correlations (linear regression) between % C02 and numerical parameters yield a significant correlation only for reservoir temperature as shown in Figure. 3. Reservoir- related attributes, compiled with respect to basin complexes (two or more basins of similar tectonic setting and geographic proximity) were used in an effort to detect
18
specific associations with C02 abwulance. In this study, reservoir-related attributes, compiled over five basin complexes, are observed to have the following statistically significant correlations with C02 level. The basins are: 1) Brunei- Sabah/Sarawak/Sokang,2) Java (East and West)/ Sunda,3) Mahakam/Tarakan,4) Malaya! Natuna /Thai and 5) Swnatra (Central, North, South).
In Java (East and West)/ Sunda it is shown that C02 content increase with depth, under ordinary circumstances, should be accompanied by similar increases in C02 content with temperature and pressure. Increases in C02 content with depth (and temperature/
pressure) could represent basinal or reservoir processes. Correlations with reservoir lithology, porosity, permeability and H2S likely represent reservoir-related processes (e.g. diagenesis). Strong positive correlations between C02 content and depth and temperature also suggest the prevalence of reservoir related processes on % C02 in the Sumatra (Central, North and South) basin complex. Furthermore, the strong positive correlation between C02 and H2S in this basin complex suggests the involvement of thermo chemical sulfate reduction in C02 generation (the amount and distribution of the data, however, are very limited). Secondary processes (see Table 2) responsible for C02 enrichment are more difficult to infer than basin- or reservoir-related processes. More detailed data and an understanding of these processes will require basin modeling. This is particularly true for documenting the influence of C02 vs hydrocarbon content from processes such as phase segregation (PVT behavior) and differential solubility that occur during migration from source to reservoir or during remigration.
2.4.3 Neural network analysis
The neural network approach to inferring the origin and occurrence of C02 in Southeast Asia incorporates basin features, reservoir attributes and fluid composition. The neural network analysis ranks the relative influence of ten parameters (found to have potential influence during
19
pre-screening by non-linear regression) as follows: reservoir pressure ~ basin type (Klemme) > asement fault density > reservoir lithology > reservoir permeability ~
reservoir temperature
> reservoir water saturation> basin length/width aspect ratio > basin size. The collective correlation coefficient (r 2) for 103 observations is 0.59 (r = 0.76) and data scatter between predicted and observed COz is sufficiently constrained to be useful in roughly predicting of C02 content. The importance of reservoir pressure (apparently related to overpressure situations as reservoir depth and temperature do not appear highly influential) may reflect the increased solubility of C02 with pressure or the composition of fluids prior to reservoir breaching. The high rankings of basement fault density (also found by the empirical assessment to be influential) and basin tectonic setting (Klemme's basin classification) attest to the association between C02 abundance and young, tectonically active basins with migration conduits for volcanic and metamorphic fluids. It is expected that a neural network study of individual basin complexes or basins (with more complete data) would improve the predictive capability of this technique.
2.5 Organic-rich tropical rivers and their role in C02 and methane generation (Robert C Shoup, and Yutthorn Gonnecome, 2009)
Reservoirs contains high C02 productions are common throughout the Asia Pacific region, notably the Gulf of Thailand, Malaysia, Indonesia and Vietnam. There are two main possibilities which this C02 originated which either by thermogenic alteration of basement or carbonates or diagenetic breakdown of organic material in shallow depth.
In north Malay Basin, there are 3 trends production of C02 with relative to depth.
The first trend shoes that the percentage of C02 increase gradually with depth from 0%
to approximately 30% or less C02 production. The second trend explains the increment in C02 production from 0% to 80%, before decreasing back to I 0% to 30% with
increasing depth. The third depth versus C02 percentage trend observed in the North Malay Basin is characterized by a relatively rapid increase in the percentage of C02 from 0% to approximately 80% or higher. No break back to lower C02 percentages are observed in this
20
C02 trend, however, the maximum C02 values are encountered near the well total depth. It is conceivable that had these wells drilled deeper, a reduction of C02 percent may have occurred.
2.5.1 Origin Theory
The most relevant theory of inorganic C02 is from thermal breakdown of carbonates probably in basement. However results obtain from well cutting shoes that North Malay Basin is underlain by granitic basement and not carbonates as predicted earlier.
Therefore it is uulikely that the carbonates are the source. The second possible
explanation for the inorganic C02 encountered in the North Malay Basin is that it is sourced from the mantle. It is possible that mantle-generated C02 migrates into the shallow section along deep-seated faults. If mantle-derived C02 is the source of C02 in the North Malay basin, it would be expected that the percent of C02 would increase with depth as observed in trend 3. However, the decrease of C02 percent with depth as seen in trend 2 is not readily explained by migration of mantle-derived C02, or any deep-sourced C02.
The most likely source for C02 in the North of Malay Basin is from the degeneration of organic compound during diagenesis and catagenesis process. In the first stage of diagenetic process, bacterial decomposition of interbedded organic material will result in the generation of carboxylic acid anions. At reservoir temperatures between 80o and 120o C the concentrations of carboxylic acid anions will increase exponentially. As formation temperatures increase with increased burial, the carboxylic acid anions are destroyed by thermal decarboxylation. Although destruction of carboxylic anions will initiate at approximately 1 OOo C, the maximum rate of carboxylic anion destruction occurs between 120o and 200o C (Figure 3). During the process of thermal decarboxylation, both methane and C02 are generated by following equation
CHJCOOH --> CH4 + C02
21
The process of C02 generation by diagenesis seems to provide the best explanation for the distribution of C02observed in the North Malay Basin. The highest concentration of C02in the North Malay Basin occurs in the northernmost portion of the basin in the region of the Kim Quy High. The present-day reservoir temperatures across the Kim Quy High range from 1 OOo C and 140o C which are ideal for the generation of C02through thermal decarboxylation.
40
60
90 G i...
f 100
! •
G. 120
e
•
1-
140
180
10 100 1000
Otnuctlon of Bacteria
Decarboxylation CH;,COO~CKC + C02
10,000
2.6 Carbon isotopic signature of C02 in Arthit gas field, Northern Malay basin, the Gulf of Thailand (S. Pisutha-Arnond & A. Sirimongkolkitti, V. Pisutha-Arnond , 2008)
Arthit gas field located at northwestern margin of the Malay Basin with area
approximately 3900 krn2.Carbon dioxide production discovered in this field ranging from less than 10% to as high as 90%.The objective of this study is to discuss the distribution of carbon isotopic data of C02 and its contents. 60 samples are obtained from RFT and TST from 19 wells drilled during 1999 to 2002 and this sample will be
22
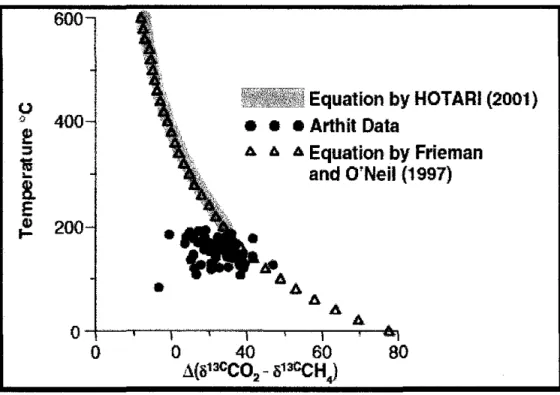
evaluated to study the sources and migration of C02 in Arthit gas field. Figure 2 shows the carbon isotopic fractionation factors between C02 and Cf4. The triangle symbols are the equilibrium carbon isotopic fractionation curve given by Friedman and O'Neil (1977). The grey circles (packed into grey line) are the equilibrium carbon isotopic fractionation line proposed by Horita (2001; cited in Chacko et al., 2001). The
fractionation factor given by Hotari (200 1) is in good agreement with that of Friedman and O'Neil (1977). The A(
one
COz-o
13C Cf4) are plotted against the formation temperatures from Arthit gas field in Figure 12 in order to test whether the C02 and Cf4 in the Arthit gas field were in or out of isotopic equilibrium with each other. The results of the plot indicate that carbon isotopic compositions of C02 and Cf4 in Arthit gas field are out of isotopic equilibrium. Because of the non-isotopic equilibrium and thesluggishness of the C02 - Cl4gaseous reaction, the carbon isotopic reequilibration between C02 and CH4 in Arthit gas field should not have been undergone to a
significant degree. It is therefore likely that the carbon isotopes of both C02 and CH4 do maintain their original isotopic signatures. Hence it is possible to use the
o
13C COzvalues to interpret the source of C02 as well as the
o
13C values of CH4 for the origin of CH4from its own isotopic variation separately. This assumption can be confirmed by the carbon isotopic values of all methane samples (theone
Cl44 values of 60 samples varying from -26 to -52 %o, see Figure 15) which fall in a typical range of thermogenic methane even in some gas samples containing small content of Cf4 but large amount of C02.Based on the content and carbon isotopic values of C02 the gas reservoirs in Arthit gas field can be grouped asGroup 1: High C02 composition about 40 to 90% with enriched isotopic values ranging from 0 to &%.This group is characterized by inorganic dominated source and may be generated deep buried inorganic sources. This gas migrated along faults and fractures before mixed hydrocarbon gases and accumulated in shallower reservoir.
Group 2: This group can be divided into 3 sub categories because it dominated by Cf4 and C02 of inorganic, organic (kerogen) and a mixing origins. The C02 content of this group ranging from 5 to 40% with
o
13C values from 0 to 14%.• Group 2a: Organic dominated source, very light carbon isotopic value, no contribution of inorganic sources of COz so the C02 (organic source) content is very low.
• Group 2b: Mixing sources with minor to moderate Cf4 dilution. Low to
medium C02 contents (5--40%), carbon isotopic values of COz are ranging from -8%o to -13%o.
• Group 2c: This sub-group represents reservoir gases dominated by Cf4 without organic COz. Varying amount of inorganic C02 could migrate into such the reservoirs and their carbon isotopic compositions of COz in the reservoirs are controlled essentially by the isotope values of inorganic COz. This sub-group is therefore has the isotopic value similar to inorganic C02 which is above -8%o.
0 ~ 400
!!!
:I'15
...
8. E
~ 200
0
•
Equation by HOTARI (2001)
• • Arthit Data
.~~> Equation by Frieman and O'Neil (1997)
80
Figure 11: Carbon isotope fractionation factors of COz and
24
0
• I
C02 INORGANIC ORIGINI
-2
• •
• • •
-4
'· •
~
•• •
-,E 0· -6
•
...
f t
0
I
(J -8
..
~<.()-10
I
C02 MIXED ORIGINI
-12
•
C02 ORGANIC ORIGIN-14
0 20 40 60 80 100 Co2(%)
Figure 12: Cross plot between C02 contents and carbon
-100 -80
o
13C (%o)
-60 -40 -20 0 10
Solid phase
Bicarbonate Atmospheric C02
• -
Metamorphic C02
-
Kerogen
Petroleum
...
Thermogenic CH4 Increasing maturity
CH4tn Arthtt gas Field A - A '
Biogenic CH4
-100 -80 -60 -40 -0 0 10
o
13C (%o)
Figure 13: Carbon isotope compositions of major carbon 25
Original values of organic in this
-<· ... ! ...
...:; ... .
"·
•••••••••••
Group I
• • •
• •• •
.
... ·-"'•... Original· i{
yalues ~~• morgamc : C02in
.
•. . .
•.
:.
•• . .
: this area •. . .
Mixing path of inorganic C02 and CH4 (without organic C02) in the trap path of inorganic C02 and CH4 (with organic C02 ) in the trap
Figure 14: Cross plot between C02 contents and Carbon isotopic
Diagenesis
Catagenesis
Sapropelic Source
CH4 •• •
•• ••
•
Humic Source
• •
CH4 :• • ••
• •
Metagenesis
Relative yield of gas from organic matter in fine- rained sediments
Figure 15: The generation of gases from organic matter with
26
2. 7 Possible Inorganic Origin of the High C02 Gas Reservoirs in the Platong and the Erawan Gas Fields, Gulf of Thailand (Masashi Fujiwara, Makoto Yamada, Akio Sasaki, 2009)
The Erawan gas field is located at central part of Thailand Trough in the Gulf of Thailand. Maximum production of carbon dioxide and nitrogen found from
northwestern part ofErawan gas field are 59.72%.ln this field natural gas are divided into two main groups which are
Group A: Characterized by heavy methane ranging from -30 to 33% PDB on carbon isotopic composition and poses high content of carbon dioxide and nitrogen. Gases produce from this group might be originated from organic and inorganic sources. This gas is believed have migrated into reservoirs from Pre-tertiary basement through fault.
Group B: This group of gases contains normal content of carbon dioxide and nitrogen and lighter methane (-38 to 41% PDB) by carbon isotopic composition. This gases is a result of thermal maturation and degradation of organic matter in Tertiary sediments.
The Platong gas field was discovered by the Platong-1 well in 1976 and commercial production was initiated in 1985. The clean up tests before production started showed that some production wells were non-commercial due to the presence of high C02 in some reservoirs and led the operator to modify the production profile. The origin of the high C02 was interpreted to be of hydrothermal origin based on geological phenomenon such as abundance of pyrite in the cuttings and samples of fresh water taken in the tests.
E-logs of shale near the high C02 shows high density and relatively low neutron porosity. Difference in shale density between high C02 zones and normal C02 zones is 0.08gm/cc on average. Resistivity of shale zone in high C02 zones is relatively higher compared to that oflow C02 zones due to low salinity water in shales probably derived from hydrothermal origin. (Placeholder 1) (Mashashi Fujiwara, 2009)
27
2.8 Enhanced Oil Recovery in Malaysia: Making it Reality (M.K Hamdan, ,N.
Darman, D. Hussain,Z. Ibrahim)
As in January 2003, Malaysian oil reserves stands at 3.5 BSTB and the cumulative oil production is 4.9 BSTB and oil in place 24.9BSTB. These numbers translate to an average oil recovery factor of 34%. PETRONAS has set target to increase the recovery factor the existing 34% - 45%. One of the ways to achieve this objective is through EOR in the depleted oil fields.
The earliest feasibility study for EOR in Malaysia was recorded inl985 with objective to investigate the technical potential of miscible enriched gas and surfactant flooding in the fields located in Peninsular Malaysia. Then in 1986, a screening study was conducted by Shell to look into EOR potential in the East Malaysia. The study of recognizing the potential of enhanced oil recovery in the fields is conducted later by PETRONAS in 2000.From Peninsular Malaysia 33 reservoirs is screened form 16 fields and 39 reservoirs from 19 fields in East Malaysia. By considering some practical limitation (gas source and reservoir heterogeneity) the number was reduced to 37 reservoirs. The main processes studied in the screening exercise were chemical, microbial enhanced oil recovery and gas flooding. The miscible hydrocarbon and C02 WAG flooding are the most favorable method.
•+---
2+---
aJoJ OR~O tfln . . . ·rtr• ...._..., 1tl'& oA"W 1118 ... , . 11tlli ... ~ .. ..,. ' " " ... '* ,. ... . . . 17Ytt o<.~o 1'Nl · - · 111111' ... ~-0"&" 1Vi6 · · - · lUOO ... i!iilt ....H
Figure 16: Oil reserves in Malaysia 28
2.8.1 Challenges and Obstacles
In Malaysia, most of producing fields are located offshore. In this environment, technical and commercial value needs to be identified precisely. One of the primary concerns is the well spacing for effective EOR process. The average well spacing for the Malaysian fields ranges from 100ft-3000ft.This distance is not suitable for chemical and thermal process which requires much closer well spacing. But this range of this is suitable for gas flooding mechanism as this method operated at larger well spacing.
However large spaced wells caused a difficulty in prediction of recovery due to uncertainty of the reservoir characteristics between wells.
Nature of the well itself will add another complexity in implementing EOR in Malaysian. Most of the well is deviated or highly deviated or without proper flooding pattern. For a conversion to a pattern injector, some wells need to be sidetracked in order to optimize the injection capability. This action will increase the cost for EOR implementation. Age of the offshore platform is another concern in EOR implementation. On the average 68% of 157 existing platforms are more than 20 years old. Large investment needed to maintain the existing platforms and installation of compressor and pumps is required for EOR projects.
The main obstacle for EOR implementation in offshore is the high cost an also the technology itself. Below figure expressed the average costs of the difference types of recovery process.
29
Process Cost, US$/bbl of incremental oil Injectant Only Total Process•
Thennal
-steam 3-5 5-7
-Purchased fuel 4-6 7-10
Gas
-C02 5-10 12-20
Cherrical
-SUrfactant (Micellar} 10-20 20-30
-Alkaline -7 -19
- SUrfactal ti:/AikalineiPolyrrer 2-7 10-17
- Polyrrer 1-5 -2-7
2.9 Enhanced Oil Recovery in Malaysia: Making it Reality Part 2 (Y. Samsudin. N.
Darman, D. Husain, M.K Hamdan, PETRONAS Carigali Sdn Bhd, 2005)
Among the Enhanced Oil Recovery (EOR) techniques applicable to Malaysian
reservoirs, C02 injection has been identified as the most amenable process. Preliminary laboratory studies were conducted on the applicability of COz displacement process. It is estimated that potentially, about 1 billion barrel additional crude oil could be recovered from Malaysian producing oil fields through application ofiORIEOR .Such a gain will result in reserves growth, and extend the producing life of these reservoirs. This
potential for oil recovery presents a major economic opportunity. In Malaysia there are several EOR projects that are in the late stages of study which being used as references for this particular study.
2.9.1 Dulang Field (Immiscible WAG)
This field located at about 130 km from Terengganu Crude Oil Terminal (TCOT).
Dulang structures are East West trending anticline with area size about llkm by 3.5 km.
The field was divided into three major areas namely Dulang Unit, Dulang Western and Dulang Eastern. As time goes by reservoir pressure depleted and led to declining of production rates. Later, feasibility studies identified reinjection of the produced gas as EOR option. For EOR operation WAG method was proposed and now at its final stage
30
of implementation. Soon after WAG injection started, pressure increase with increase oil rate and reduced GOR and water cut. Oil rate increase to 300 BOPD from 105 BOPD while GOR reduced to 200 scf!stb from 4500 scflstb and water cut reduced from 80% to 70%.
2.9.3 West Lutong Field
West Lutong is located in the Baram Delta Province 12 km North West offshore Lutong.The KL and MN sand are the major producing reservoirs West Lutong and contribute more than 70 % of the total production. The STOUP is 110 MMstb. A test was conducted to test the feasibility of miscible gas injection in Baram Delta fields. The current plan is to implement an observation pilot program with one injector and one or two observation well to be drilled 100 feet away.2MMscf/d of high purity C02 will used to supply the injectant gas at miscibility conditions. Continuous gas injection is
considered due to the extremely strong aquifer and the process will be closely monitored to see the performance of pilot program. If the pilot is successful, the miscible process can give an incremental of up to 165 MMstb for the BDO fields.
3.0 Petex (Petroleum Experts) 3.0.1Mbal
Efficient reservoir development requires a good understanding of reservoir and
production systems. MBAL helps the engineer better define reservoir drive mechanisms and hydrocarbon volumes. This is a prerequisite for reliable simulation studies. This software is commonly used for modeling the dynamic reservoir effects prior to building a numerical simulator model. It also contains the classical reservoir engineering tool and has redefmed the use of Material Balance in modem reservoir engineering. For existing reservoirs, MBAL provides extensive matching facilities. Realistic production profiles can be run for reservoirs with or without history matching. MBAL is an intuitive
31
program with a logical structure that enables the reservoir engineer to develop reliable reservoir models quickly.
Identify & assign compartment
Gather/organise
Sensitivity runs/ gas injection
L Historical production
evaluatioDo etc. __
n. PVT/Rock properties
Start Mbal Input PVT and match
I
Set Up tank model
I
Predictionrun~!
analyse•
Well data (history)1
•
Tank data Re-define compartmentsCalculate tank production history Set up prediction
wellsfmjectors Not OK OK
Histmymatching
I
•
Analytical method·1
Run simulation & analyseI
•
Graphical methodFigure 17: Mbal workflow 3.0.2 PROSPER
PROSPER is a well performance, design and optimization program for modeling most types of well configurations found in the worldwide oil and gas industry today. This application can assist the production or reservoir engineer to predict tubing and pipeline hydraulics and temperatures with accuracy and speed. It's sensitivity calculation
32
features enable existing well designs to be optimized and the effects of future changes in system parameters to be assessed. PROSPER is designed to allow building of reliable and consistent well models, with the ability to address each aspect of well bore modeling; PVT (fluid characterization), VLP correlations (for calculation of flow line and tubing pressure loss) and IPR (reservoir inflow). By modeling each component of the producing well system, the User can verizy each model subsystem by performance matching. Once a well system model has been tuned to real field data, PROSPER can be confidently used to model the well in different scenarios and to make forward
predictions of reservoir pressure based on surface production data. With PROSPER detailed flow assurance can be studied at well and surface pipeline level. This software provides unique matching features which tune PVT, multiphase flow correlations and IPR to match measured field data, allowing a consistent model to be built prior to use in prediction (sensitivities or artificial lift design).
3.1 Material Balance Principle
When a volume of oil is produces from a reservoir, the space once occupied by this volume must be filled by something else. This could be replaces by either;
• Gas cap expansion
• Released gas volume
• Remaiuing oil volume
• Rock and water expansion
• Net water influx
Original Conditions
Gas Cap Expansion Released Gas Volume
After Oil Production
Figure 18 : Material Balance Principle
3.1.1Gas Cap Expansion
• Gas cap (if present) will expand to partially replace the volume occupied by the produced oil.
GAS CAP EXPANSION = (G-GPC) Ba-G Bar [rb]
Where
G = original gas cap gas volume, scf
GPC = cumulative gas production from the gas cap, scf Ba = gas formation volume factor at current pressure, rb/scf
Bar = gas formation volume factor at original reservoir pressure, rb/scf
• gas cap shrinkage problem - if GPC is large - Joss of oil recovery
34
3.1.2 Release gas volume
• gas will be released from solution if reservoir pressure falls below the bubble point
At any time during the production of a reservoir, the gas originally in solution can be placed into three categories
• still in solution
• released from solution and produced from reservoir
• released from solution but still in reservoir
RELEASED GAS VOLUME= {N
Rs1 -
(N- Np)Rs -
GPS} Ba [RB]N = original oil volume, STB Np = cumulative oil produced, STB
Gps =cumulative solution gas produced, SCF
Rs1
=original solution GOR, SCF/STBRs
=solution GOR at current pressure, SCF/STBBa = gas formation volume factor at current pressure, RB/SCF 3.1.3 Remaining Oil Volume
RESERVOIR OIL VOLUME= (N- Np) Bo [RB]
Where;
N = original oil volume, STB Np =cumulative oil produced, STB
Bo- oil fonnation volume factor at current pressure, RB/STB 3.1.4 Rock and Connate Water Expansion
• effect is generally negligible if gas phase is present
• effect is important only when P>PB in oil reservoirs
• expansion effects are combined into one term and expressed as the formation compressibility, Cr - fractional change in hydrocarbon pv per psi change in reserv01r pressure
• PV can be expressed in terms of original oil volume
ORIGINAL OIL VOLUME= N Bor = Vp Sot= Vp (1-Swr) [RB]
where:
N = original oil volume, STB
Bm =OIL formation volume factor at initial pressure, RB/STB V p
=
reservoir pore volume, RBSor = initial oil saturation
Swt = initial or connate water saturation
Rockexpansion=Cf ( NBoi_)(Pi-P)
[RB]
1-Swz
Cr = formation compressibility, vollvollpsi
Pi= initial reservoir pressure, psi P = current reservoir pressure, psi 3.1.5 Water Influx
• cannot be calculated directly
• depends on size and strength of aquifer
• can caJculate net water influx indirectly
NET WATER INFLUX= WE- W pBw [RB]
Where;
We = cumulative water influx, RB
wp = cumulative water produced, STB
bw
=
water formation volume factor at current pressure, RB/STB 36CHAPTER3
METHODOLOGY
3.1 Methodology Flowchart
Objective 1
is achieved
Objective
2 is
achievedEvaluate characteristic and
origin of produced COz
- /
Title SelectionStudy the distribution of
C02 in Malay Basin
-/
Literature Review&
Analysis
Review Mal Basin
- ... .. - .. -· · -··-··-···
Evaluate the possible usage of
produced C02
37
Reservoir modeling using
Mba I
I
Well modeli ' using PROSP
v
3.3 Distribution of C02 in Malay Basin
The author used the data from The Petroleum and Geology Resources book as the references data for the production of C02 in the Malay Basin. From Figure. 15 illustrates that the high production of C02 concentrated mainly in the center and the northern part of the Malay Basin. The percentage of C02 ranges from approximately 5% to 85%
mol.The percentage of C02 in Malay Basin is coutoured to see the trend of it.
l
Malay Balin Guu0 -~..
I . .. -;:,
' - -- - - -- '
.. .,.
Figure 19 : Distribution of C02 in the Malay Basin (The Petroleum Geology and Resources ofMalaysi~ 1999)
PENINSULAR MALAYSIA
- •
r: •
I
• •
..
't
Figure 20 : Contour map of C~ distribution (The Petroleum Geology and Resources ofMalaysia, 1999)
From the percentage of C02 countoured we can see that there are three main pockects where the C02 are concentrated. which are north, center and south part of the basin. The Malay Basin basement are found deeper in the north and axial.Buried deeper in the basin, the geothermal gradient increase and this phenomena is prove by reffering to thermal gradient of Malay Basin in Figure 7 and 8. This condition is ideal for generation of inorganic C02 from thermal breakdown of carbonates which occur at high temperature. For this study the author are focusing on finding the source of high production of C02 which mostly results from inorganic origin. This is because this type of C02 is a stable source compare to organic origin of C02 which results from breakdown of keroge at low temperature .This type of C02 are found concentrated in the center of the basin and associated with large gas accumulation. This gas are migraed along the fault and mixed with the shallower thermal gas.Such phenomena is found in Dulang and Tangga fields.
3.4 C02 flooding modeling
In designing effective C02 flooding, there are rule of thumbs that should be follow
• To be an effective solvent, C02 must flow through the reservoir above its minimum miscibility pressure (MMP). This means that the reservoir generally should be greater than 2,500 ft. deep.
• C02 is most effective with light crudes, those with oil gravities greater than 25°
API. Preferably higher than 30 ° API (William C. Lyons, Gary J. Plisga, (William C. Lyons, 2005))
• Because C02 flows through the reservoir more easily than oil, it also does best in reservoirs with low heterogeneity. If some layers of the reservoir are far more porous than others, C02 will flow there preferentially, rather than maintaining uniform front and high sweep efficiency.
• Stratification, fracturing and adjacent loss zones (adjacent gas caps) can cause loss of C02 and reduced oil recovery.
3.4.1 Reservoir modeling
Reservoir modeling is important to simulate the real scenario of the reservoir by using fictitious data obtain from well report. The detail modeling process is explained in the appendix.
Data preparation
For this modeling there are numbers of data required to run the software such as PVT data, reservoir data, well data and etc. However due to lack of data, the author will used the fictitious data to run the software. These data should be recalculated once the actual information's are available.
PVT data
