Horticultural production decreased by 2%, mainly due to lower production of vegetables and subtropical fruits, while animal production increased by 2%. Pasture prices decreased by 22.9%, but slaughter animals, poultry and milk increased. by 2.1, 3.1 and 10.7%, respectively. The total gross value of agricultural production (total production in the production season, valued at the average basic prices received by producers) for 2003/04 is estimated at R70 485 million, compared to the previous R71 213 million - a decrease of 1.
Gross revenue from horticulture products increased by 6.9% to R20 645 million compared to a figure of R19 316 million for the previous 12 months. Farm equipment prices fell 1.3% compared to a 14.7% increase the previous year. The price index for machinery and equipment increased by 2.0%, for needs for fixed improvements by 6.9%, while prices for intermediate goods and services decreased by 1.9.
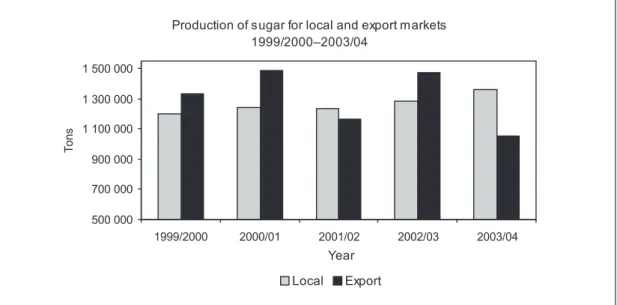
The gross investment in respect of fixed improvements for the year ending 30 June 2004 increased by 4.2% to R2 798 million. In the case of dairy products and eggs, prices rose by 5.6%, and an increase of 4.2% was recorded for sugar and related products.
Branches of the industry
FIELD CROP HUSBANDRY
The significant drop in maize prices during planting time, together with the increase in value of the Rand also contributed to the smaller maize plantings. The decline was caused by a unique combination of factors, such as the drop in world prices for these commodities, appreciation in the value of the local currency, as well as a domestic corn surplus. Less than 1% of the arable land in South Africa is used for the cultivation of sorghum.
Most of the wheat produced in South Africa is bread wheat, with small amounts of durum wheat being produced in certain areas. The climate in the Southern Cape, where most of the country's barley is grown, has not been favorable to barley production in recent times. Part of the South African barley crop is generally less suitable for malting purposes and is therefore used as animal feed.
Sunflower seed can be planted from the beginning of November to the end of December in the east of the country and until mid-January in the west of South Africa. The marketing season for sunflower seeds in South Africa starts on January 1 and ends on December 31 of the calendar year. The main reasons for this are the continued strengthening of the Rand/Dollar exchange rate, as well as a fall in international soybean prices.
The domestic price of soybeans largely depends on international price movements. It is a fungal disease and can lead to the complete collapse of the infected plant and cause extensive crop losses. The 2004/05 growing season was characterized by dry conditions in some areas of the Western Cape, resulting in lower rapeseed yields.
The expected reduction in production for the 2004/05 production season was caused by below average rainfall in the Southern Cape and a very dry season in the Swartland area of the Western Cape Province, resulting in lower than normal yields. The increase in areas sown with rapeseed is the result of greater local demand for rapeseed over local supply, so producers expect favorable prices. About 49% of the area planted to cotton in South Africa for the 2004/05 marketing season is dryland, with the remainder irrigated.
Most of the commercial dry beans are produced in Mpumalanga, followed by the Free State and Gauteng provinces. The Dry Bean Producers Organization is the national commodity organization that promotes the interests of the dry bean producers in the country.
HORTICULTURE
This important initiative was developed by growers and millers in the South African sugar industry. Dry conditions and the deteriorating water situation in the Western Cape and other fruit-producing regions will have a negative impact on the 2004/05 crop. The dried fruit is mainly produced in the western and southern parts of the Western Cape Province and in the Lower and Upper Orange River areas of the Northern Cape Province.
Wine is mainly produced in the Western Cape Province and along parts of the Orange River in the Northern Cape Province. Over the past six years, there has been a shift from white to red wines, resulting in a dramatic increase in the production of red varieties, namely Shiraz, Merlot, Ruby Cabernet, Cabernet Sauvignon and Pinotage. The KWV episode tarnished our reputation and affected our position in the global market.
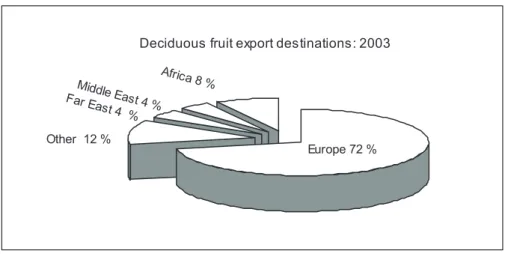
Granadillas and guavas are also grown in the Western Cape, while pineapples are grown in the Eastern Cape and KwaZulu-Natal. Citrus fruits are grown in the provinces of Limpopo, Mpumalanga, KwaZulu-Natal, Eastern Cape and Western Cape, where subtropical conditions prevail (warm to hot summers and mild winters). South Africa is one of the five largest citrus exporters in the world.
With the exception of naartje, there was a marked increase in the prices of citrus fruits sold in the fresh produce markets during 2003/04 compared to 2002/03. As shown in the chart below, approximately 52% of the volume of vegetables produced is traded in major fresh produce markets. The importance of vegetables in a healthy diet is being strongly promoted by all stakeholders in the fresh produce marketing chain.
Other important regions in terms of cultivated hectares are the Onderberg area of Mpumalanga province with 550 ha and the Eastern Cape border area with 450 ha. This can be attributed to an increase in the planted area from 300 to 550 ha. The acreage and production of tomatoes in the world has remained fairly constant over the past six years.
The main production regions, however, are located in Limpopo, North West, Mpumalanga, Free State and Western Cape Provinces. This means that the increase in potato intake from processing plants will continue.
ANIMAL PRODUCTION
Although sheep farms exist in all provinces, they are concentrated in the drier parts of the country. The total number of employees in the pig production industry in South Africa is estimated to be approx. 10 000. The red meat industry is one of the most important and fastest growing industries in the agricultural sector and contributes approx. 13% to the gross value of agricultural production in RSA.
The effect of the drought over the past 2 years may result in dry conditions in the winter and spring of 2005. Imports play an important role in terms of the supply of broiler meat in the country. If the value of the Rand remains unchanged, the demand for chicken meat is expected to remain strong.
Today, all major stakeholders in the industry are affiliated with the National Ostrich Processors of SA and the South African Ostrich Business Chamber, with the aim of working together for the advancement of the ostrich industry in South Africa. South Africa's ostrich slaughter is expected to fall to around 230,000 head in 2005, mainly due to the impact of avian flu. Due to the strong recovery of the Rand, producers' incomes are expected to be much lower.
Milk production in South Africa makes a very small contribution to world milk production (about 0.5%), but measured in terms of the value of agricultural production in South Africa, it is the fifth largest agricultural industry in the country. Due to the lower grain prices, especially corn, the costs of production inputs should level off. Wool is produced throughout South Africa, but the main production areas are located in the drier areas of the country.
Cape Wools acts as the executive arm of the Forum and started operations on September 1, 1997. This was mainly due to the improvement in the value of the South African currency, but also to lower demand for certain micron groups. However, due to the limited number of buyers at these auctions and a lack of effective competition, there has been a general decline in the volume of hair channeled through these auctions.