THE TIME COURSE CHANGES IN SELECTED FATIGUE INDICATORS IN MODERATELY TRAINED PARTICIPANTS
BY
BONGANI CYPRIAN MADUNA
THESIS
Submitted in fulfillment of the requirements for the Degree Master of Science
Department of Human Kinetics and Ergonomics Rhodes University, 2019
Grahamstown, South Africa
ABSTRACT
Background: During daily physical activities, individuals will encounter some level of fatigue. This is especially true for athletes who exert their bodies to achieve superior performance and attempt to delay the onset of fatigue as far as possible. However, fatigue is a progressive process that is part of physical exercise. It is therefore, important to understand the various factors associated with fatigue. Objective: The purpose of this research project was to observe the changes in perceptual, physiological responses, and workload while participants performed a fatiguing cycling exercise task. In order to observe the aforementioned changes, one of the three variables, either perceptual, physiological responses or workload was kept constant, while the other two were observed as dependent variables. There were three test conditions, which permitted each variable to be kept constant in at least one of the three test conditions. Methods: Thirty-six apparently healthy university students were recruited for the study. The exercise was of 35 minute duration for each condition, with the data collection for HR (physiological response), RPE (perceptual response), and power output (workload) occurring at two minute intervals from the eighth minute until the thirtieth minute. The participants were required to perform a peak-power-output test in order set the relative performance ranges for each participant in order to elicit an observable fatigue response from all the participants. The three conditions included constant HR response, constant workload, and constant RPE response where each participant performed all of the above conditions on separate days. Results: The perceptual (RPE) response increased significantly (p<0.05) over time in all three test conditions, even under the constant RPE condition where it was expected to remain unchanged throughout the test duration. The HR response only demonstrated a significant (p<0.05) increase over time under the constant workload condition. Lastly, workload remained constant in all three testing conditions.Conclusion: Participants may be able to exercise for longer periods during sub-maximal exercise if they disregard the RPE warning response. In the current study, the RPE response illustrated that participants were being exerted more over time; however, the participants still had physiological and workload capacity to continue exercising. This research project has confirmed the
fact that fatigue is a multifaceted phenomenon. Furthermore, it has been illustrated that RPE response alone as an indicator of fatigue onset may be misleading as participants did not breach the HR and workload steady state during the current research. Therefore, it may be more appropriate to assess fatigue onset through the assessment of more than one fatigue variable in order to ensure increased accuracy of the participants’ fatigue state assessment.
DEDICATION
This research is dedicated to my family: Ryan, Tim, Kyle, Kirsty, Kay, Makhosazana, Paige, Robert, and Ompa. Without their love and support, this study would never have been possible to complete.
ACKNOWLEDGEMENTS
I wish to thank the following individuals who were vital to making this study possible:
Firstly, I want to thank Dr. Swantje Zschernack my supervisor for her consistent support and, patience throughout the duration of the project. Without her willingness to share her time and knowledge, this research project would not have been possible.
Professor Candice Christie, Professor Matthias Goebel, June McDougall, Tyrone and the staff of the Human Kinetics and Ergonomics Department for their invaluable contribution during this long journey.
Most importantly, thank you to all the willing participants who volunteered their time and effort to make this research project happen.
Lastly, thank you to ARMSCOR SOC Ltd for their financial contribution, thus affording me the opportunity to embark on a Master’s Degree.
Table of Contents
ABSTRACT ... i
DEDICATION ... iii
ACKNOWLEDGEMENTS ... iv
CHAPTER I ... 1
1. INTRODUCTION ... 1
1.1 BACKGROUND TO STUDY ... 1
1.2 STATEMENT OF THE PROBLEM... 3
CHAPTER II ... 5
2. REVIEW OF LITERATURE ... 5
2.1. Psychological Fatigue ... 6
2.2. Cardiovascular Fatigue ... 12
2.3. Biomechanical Fatigue ... 17
2.3.1 Economical exercise patterns... 18
2.3.2 Muscular Contractions ... 20
2.4 Neuromuscular Fatigue ... 22
2.4.1 Central Fatigue ... 22
2.4.2 Excitation of Muscle Fibres ... 25
2.4.3 Peripheral Fatigue ... 29
CHAPTER III ... 34
3. METHODOLOGY ... 34
3.1 Research concept ... 34
3.2 Research Hypotheses ... 36
3.2.1 Constant physiological response condition ... 37
3.2.2 Constant perceptual response condition ... 39
3.3 EXPERIMENTAL DESIGN ... 43
3.3.1 Exercise Task ... 43
3.3.2 Participants ... 48
3.3.3 Research variables ... 50
Constant perceptual response condition ... 50
Constant workload condition ... 51
Controlled variables ... 51
3.3.4 Experimental Procedure ... 52
Habituation and Peak Power Output ... 52
Testing Procedure ... 54
Experimental Equipment ... 55
Data Collection ... 56
Physiological Response Data... 58
Perceptual Response Data ... 59
Workload Data ... 60
Data Analysis ... 60
Relativisation of Data ... 61
Descriptive statistics ... 61
Analysis of Variance (ANOVA) ... 63
Post-Hoc Tests ... 63
CHAPTER IV ... 64
4. RESULTS ... 64
4.1 Participants Demographics ... 64
4.2 Constant HR Response Condition ... 67
4.2.1 Descriptive Statistics ... 67
4.2.2 Relativised Data ... 70
4.2.3 Response to Hypothesis ... 72
4.3 Constant Workload Condition ... 74
4.3.1 Descriptive Statistics ... 74
4.3.2 Relativised Data ... 76
4.3.3 Response to Hypothesis ... 80
4.4 Constant RPE Response Condition ... 81
4.4.1 Descriptive Statistics ... 81
4.4.2 Testing for Consistency ... 83
4.4.3 Relativised Data ... 85
4.4.4 Response to Hypothesis ... 87
CHAPTER V ... 89
5. DISCUSSION ... 89
REFERENCES ... 105
APPENDICES ... 123
List of Figures
Figure 1: Diagram of Borg’s RPE Scale ………...…….8
Figure 2: The Cardiovascular / Anaerobic Model………..……….……14
Figure 3: Diagram Illustrating Afferent Feedback………...………25
Figure 4: Sketch of attributing factors to Peripheral Fatigue…………...……….30
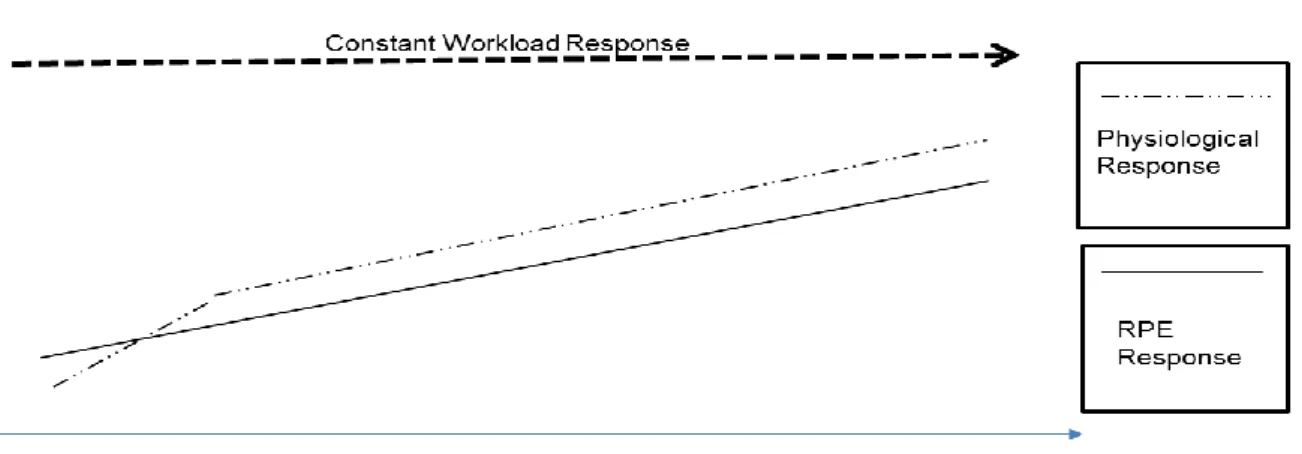
Figure 5: Expected perceptual and workload data from the constant physiological response condition…………..……….…………37
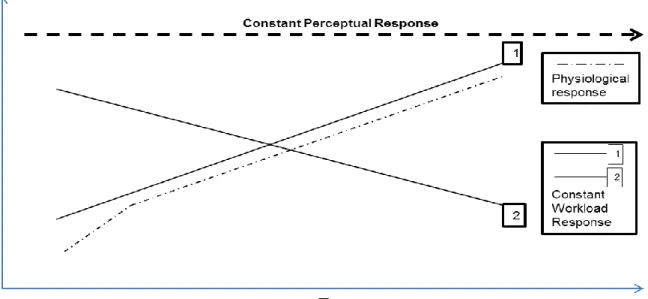
Figure 6: Expected physiological and workload data from the constant perceptual response condition………...……….…...39
Figure 7: Expected physiological and perceptual responses data from the constant workload condition………...………...41
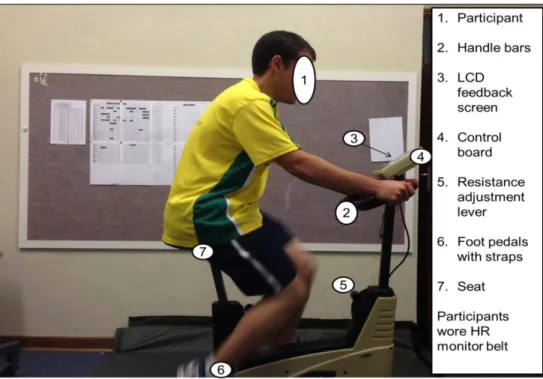
Figure 8: Author seated on Cateye Ergociser cycle ergometer………...…56
Figure 9: (a) The FT1™ Polar Heart Rate Monitor and (b) Transmitter……..……...56
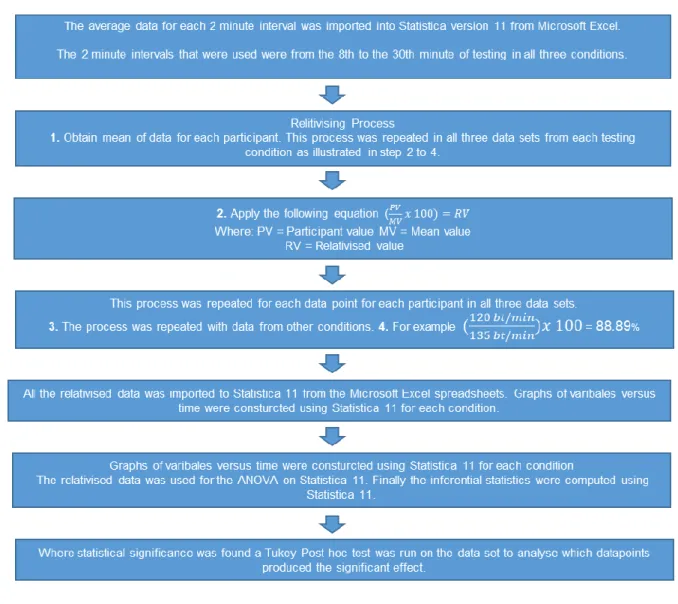
Figure 10: Flow Chart showing the how the absolute data was relativised…..….….62
Figure 11: Mean data from the Constant Heart Rate Condition……….….…....68
Figure 12: Mean changes in RPE over time during the Constant Heart Rate response condition………..……….…71
Figure 13: Mean data from the Constant Workload Condition………...………..75
Figure 14: Mean changes in HR over time during the Constant Workload condition………...……….……….77
Figure 15: Mean changes in RPE over time during the Constant Workload condition………...……….……….79
Figure 16: Mean data from the Constant Rating of Perceived Exertion Condition………...……….…...….82
Figure 17: Mean changes in RPE over time during the Constant RPE response condition………...……….…….84
Figure 18: Mean changes in HR over time during the Constant RPE response condition………...……….…….86
List of Tables
Table I: Difference between Constant versus Variable exercise intensity…………..18 Table II: The research variables and testing conditions………...……….…36 Table III: Participants’ Characteristics …...………...65 Table IV: Participants’ weight before and after the fatiguing exercise task …..…...66 Table V: Repeated Measures ANOVA for consistency for constant heart rate
response during the constant heart rate condition………....……….…….69 Table VI: Repeated Measures ANOVA for workload in the constant heart rate
condition ………...……….……70 Table VII: Repeated Measures ANOVA for RPE response in the constant heart rate condition………...……….……….71 Table VIII: Post-hoc test for RPE response in constant heart rate
condition………....…….72 Table X: Repeated Measures ANOVA for the heart rate response during the
Constant Workload Condition………...….……….76 Table IX: Repeated Measures ANOVA for consistency in the workload during the Constant Workload Condition………...……….……….76 Table XII: Post-hoc test for heart rate Response in constant workload
condition………...……….……….77 Table XIII: Repeated Measures ANOVA for the RPE response during the Constant Workload Condition………...……….…..…78 Table XIV: Post Hoc Test for RPE Response in Constant Workload
Condition………...……….………80 Table XV: Repeated Measures ANOVA for consistency in the RPE response during the Constant RPE Condition………..………..………...83 Table XVI: Post Hoc Test for RPE Response in Constant RPE Response
Condition………...……….……85 Table XVII: Repeated Measures ANOVA for heart rate response during the Constant RPE Condition………..……….…...…85 Table XVIII: Post Hoc Test for HR Response in Constant RPE Response
Condition………...……….………87
Table XIX: Repeated Measures ANOVA for workload during the Constant RPE Condition………...……….87
List of Appendices
Appendix A: Experimental Protocol………...…………125
Appendix B: Letter to Participants………...…………..130
Appendix C: Sample Details………...………133
Appendix D: Risk/ Benefit Issues………...………135
Appendix E: Consent Form………...………..138
Appendix F: Privacy, Anonymity, and Confidentiality Issues……….140
Appendix G: Feedback Issues………...……….142
Appendix H: Ethical Considerations………...…………143
Appendix I: Post Hoc Test Tables………...…………...153
Appendix J: Participants’ Information Form………...…..158
Appendix K: Testing Procedures for All Test Conditions………159
List of Abbreviation ACSM American College of Sports Medicine ANOVA Analysis of Variance
ATP Adenosine Tri-Phosphate
BMI Body Mass Index
BPM Beats per Minute
CHO Carbohydrate
CNS Central Nerve System
DV Dependent Variable
EMG Electromyography
fMRI Functional Magnetic Resonance Imaging
HR Heart Rate
HRmax Maximum Age Predicted Heart Rate
IDV Independent Variable
K+ Potassium ion
KG Kilogram
mm Millimeters
MVC Maximal Voluntary Contraction
Na+ Sodium ion
PAR-Q Physical Readiness Questionnaire POMS Profile of Mood States
POMS-SF Short Form Profile of Mood States
PPO Peak Power Output
RHR Resting Heart Rate
RPE Rate of Perceived Exertion
SOFI Swedish Occupational Fatigue Inventory SSC Shorten-Stretching Cycle
VO2Max Maximal Oxygen Uptake
CHAPTER I
1. INTRODUCTION 1.1 BACKGROUND TO STUDY
Individuals engaging in day-to-day activities will often experience increased discomfort, and increased difficulty performing given exercise after prolonged exercise performance, even when performing sub-maximal intensity tasks or exercises (Lorist et al., 2002; Allen et al., 2008a). The cause of increased difficulty or decreased performance, and increased sensation of discomfort is often attributed to various factors (Swart et al., 2012). In most cases individuals assume that their decreased performance and increased pain sensation is because they fatigued, have lowered energy levels and/or they are exhausted (Enoka & Duchateau, 2008).
Individuals who experience a “tiredness” sensation often cannot explain the cause of the pain and the accompanying reduced performance. There is a possibility that the working muscles, and cardiovascular system are the limiting factors to exercise performance and/or it is the perceived pain sensation which accounts for the decreased performance (St Clair Gibson et al., 2003). The perceived pain sensation can often be intolerable, especially for individuals with a low-pain threshold (Grandjean, 1979; Borg et al., 1985). Therefore, the pragmatic reaction from an individual experiencing tiredness-related pain or discomfort is to discontinue the task or terminate the exercise, or reduction of the effort applied to continue performing the exercise, which is thought to be the cause of the tiredness and painful sensation (Marino, 2004; Taylor et al., 2006; Yoon et al., 2007).
In the scientific community the “tiredness” sensation which most ordinary individuals experience when performing tasks and/or exercises for prolonged periods, is referred to as fatigue (Grandjean, 1979; St Clair Gibson et al., 2003). Fatigue carries various definitions in the scientific community (St Clair Gibson et al., 2003). It can be defined as the inability of an individual to maintain the initial performance response to the task over time (Lorist et al., 2002). For example, exercising individuals will often begin a task with a higher power output than the power output, which is
observed after a prolonged period of time on the task, or at the point of exhaustion during exercise (Farina et al., 2003).
There are various forms of fatigue (Grandjean, 1979; Abbiss & Laursen, 2005;
Enoka & Duchateau, 2008). In this research, the focus is on physical fatigue, which is thought to affect the cardiovascular and peripheral system during exercise task performance (Grandjean, 1979; Kent-Braun et al., 2002; Gandevia, 2008). The phrase “physical fatigue”, and the term “fatigue”, are used interchangeably in this study. It is noteworthy to mention that fatigue is different from exhaustion which occurs at the point at which the participant can no longer continue performing the exercise or task (Faulkner & Eston, 2007; Amann & Dempsey, 2008). Exhaustion is the point at which the participant terminates the exercise, whereas fatigue may be defined as the point where more effort is required to perform a given task or exercise in order to maintain the performance levels (Lorist et al., 2002). While fatigued participants can often increase their effort levels to counter the negative effects of fatigue on exercise performance (Brown et al. 2010). In contrast exhausted participants are unable to counter exhaustion to maintain the performance levels (Garcin et al., 2004; Marino, 2004; Faulkner & Eston, 2007).This is because exhaustion is often followed by the reduction in effort levels and in some cases termination of the exercise task (Ament & Verkerke, 2009).
There is a growing body of evidence which proposes that fatigue is a brain-derived emotion (Noakes, 2000; St Clair Gibson et al., 2003; St Clair Gibson & Noakes, 2004; Noakes et al., 2004; Lambert et al., 2005; Noakes, 2012; Swart et al., 2012).
In terms of this notion of fatigue, it is proposed that the sensation of fatigue in the brain is a protective mechanism against catastrophic events (Marino, 2004; Noakes et al., 2005, 2004). St Clair Gibson et al. (2003) noted that fatigue is thought to be a response to the increasing disequilibrium in the exercising participant’s homeostasis as a consequence of the participant’s bodily organs not being able to meet the current and prospective demands of the given exercise task. However, this notion that fatigue is a brain-derived sensation is not yet well established. There are other theories, which propose that fatigue originates peripherally; namely, in the working muscle and cardiovascular system rather than in the brain (Grandjean, 1979;
Gandevia et al., 1996; Allman & Rice, 2002; Allen et al., 2008b; Enoka & Duchateau, 2008; Giulio et al., 2011). Therefore, the impact of fatigue can either be in a bottom-
up manner and/or top-down manner. Neither of these concepts of fatigue are mutually exclusive owing to the fact that all the systems in the human body, which affect the participants fatigue status, are linked (Gandevia, 2001; Nybo & Secher, 2004; Abbiss & Laursen, 2008; Noakes, 2012; Swart et al., 2012). Prolonged exercise activities have elucidated the link between the brain and muscular system, where individuals who have been exercising for lengthy periods of time demonstrate cerebral perturbation and generally struggle to produce peak performance in a cognitive task (Nybo & Secher, 2004).
This study focused on physical fatigue and how changes in physiological responses, perception, and workload, could assist in the understanding of the development of fatigue during exercise performance.
1.2 STATEMENT OF THE PROBLEM
The interaction between physiological, perceptual responses, and workload during fatiguing exercise tasks have not formed a major part of physical fatigue research (Gandevia et al. 1996; St Clair Gibson et al. 2003; Meeusen et al.,2006; Taylor et al., 2006; Enoka & Duchateau, 2008; Higham & Biewener, 2009; Noakes, 2012). In addition, investigations of whether exercising participants perceive physical fatigue prior to exhibiting physiological fatigue responses and/or workload decrements and vice versa, do not seem to be the focus of physical fatigue literature. The investigation of the changes in perception of fatigue, physiological responses, and workload decrements may provide valuable information as to where physical fatigue occurs initially during exercise task performance.
Physical fatigue can be defined as diminishing performance, which arises over time during exercise task performance in healthy participants, affecting the cardiovascular system and peripheral muscular system, and to a lesser extent the cerebral component (Grandjean, 1979; Lorist et al., 2002; Nybo & Secher, 2004; Abbiss
&Laursen, 2005). The affected systems demonstrate signs of fatigue with changes, which include increased breathing frequency, increased heart rate (HR), increased electromyography amplitude, and diminished muscular contraction time, including increased pain and discomfort levels in the working muscles (Schwartz et al., 1993;
Oberg, 1995; Vøllestad, 1997; Aaronson et al., 1999; St Clair Gibson et al. 2003).
Changes in the working muscles can be observed through the use of the following:
subjective ratings of perceive exertion (RPE) scores; changes to muscle contraction strength; changes to exercise task performance; and in some cases the levels of perturbation to cognitive function (Noakes, 2000; Ament & Verkerke, 2009; Desmond
& Matthews, 2009; Kato etal., 2009). The aforementioned factors could potentially provide information about whether exercising participants perceive physical fatigue prior to exhibiting objective fatigue responses and if the objective fatigue responses precede the perception of physical fatigue.
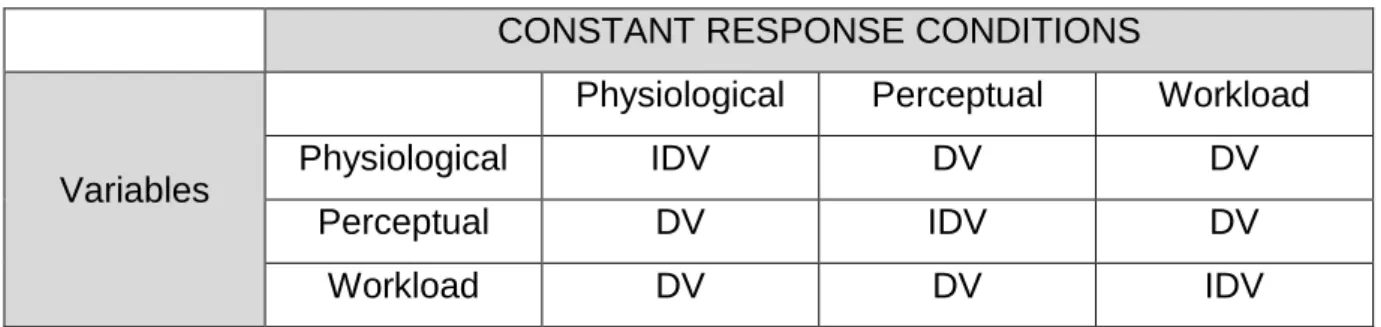
In this study, in order to observe the changes in the participants’ physiological, psychological responses, and workload output, one of these factors was kept constant during testing in order to observe the changes of the two factors, which were not kept constant. Since there were three factors, this suggests that there were three testing conditions: one of the three factors was constant in order to observe changes of the remaining two factors. To keep the desired factor/response constant, the participants were prescribed condition-specific exercise instructions, which were adhered to during testing. This design allowed for the changes of two responses to be observed, while one response was kept constant. This principle was applied to all three testing conditions for observation of the changes in the responses over time.
This led to the current research project using three exercise conditions that participants were required to perform while maintaining one response of the exercise task constant for the duration of the testing session. There were three parameters for each testing condition: physiological response, perceptual response and workload.
During the testing of each condition, one response was maintained as constant this was the independent variable while the remaining two responses were the dependent variables. Maintaining one response of the exercise condition constant provided an opportunity to observe the changes in the two other responses, which were not maintained as being constant. The three exercise conditions included:
exercising under constant physiological response, constant perceptual response, and constant workload.
CHAPTER II
2. REVIEW OF LITERATURE
2.1 Background Information
Fatigue has been studied for decades within various disciplines, which has resulted in varying definitions to suite the various disciplines (Noakes, 2000; St Clair Gibson et al., 2003; Abbiss & Laursen, 2005). Research conducted to gain a better understanding of fatigue has led to various disciplines adopting a reductionist methodology to understand fatigue within the given discipline; for example, psychologists will have a different definition of fatigue compared to physiologists and neurophysiologists (St Clair Gibson et al., 2003). In the neurophysiology discipline, fatigue is described as the diminished effect of the action potential stimulating the efferent motor neurons, which results in a reduced muscle activation and muscle force production (Gandevia, 2001). While the physiologists refer to fatigue as a reduction in the performance of the complete physiological system or a component of the system which has noticeable impact of the physiological system (Green, 1997).
Fatigue is viewed as a negative effect of physical exercise, which hinders performance over time, and this has resulted in extensive research being conducted into understanding fatigue and its impact on exercise performance (Noakes, 2000;
Kay et al., 2001; Kayser, 2003; Rattey et al., 2006). A better understanding of fatigue during exercise performance will benefit both coaches and athletes (Abbiss &
Laursen, 2005). A better understanding of the fatigue mechanisms and the impact it has on exercise performance may help athletes in selecting the appropriate training strategies, which can maximise the adaptations to the exercise for improved performance (Noakes, 2000). These discipline-specific definitions of fatigue have resulted in various models that aim to describe it (St Clair Gibson et al., 2003).
These models include, but are not limited to the Psychological fatigue model, the Cardiovascular fatigue model, Muscular fatigue model, and the Biomechanical fatigue model (Noakes, 2000). The aforementioned models are pertinent to the current research project as these models relate directly to the current research
project independent variables. While the discussion of neuromuscular fatigue model was included, to illustrate the close relationships that exist amongst the various models of fatigue and hence it is difficult to study a fatigue model in isolation.
In this research project, the term fatigue is used to define an increase in the physiological response, an increase in the perceptual response, and a decrease in the power output over time because of physical exercise performance (Borg, 1990;
Kay et al., 2001; Tucker, 2009). It must be mentioned that exercise is terminated at volitional exhaustion; however, fatigue is a precursor to exhaustion (Kay et al., 2001).
In order to compile the literature review for the current study various academic search engines were used these mainly included Research Gate, Science Direct, Google Scholar, and Elsevier. All papers containing the terms ‘fatigue’ and ‘exercise’
and ‘fatigue during exercise’ and ‘tiredness’ or ‘physical fatigue’ or ‘EMG’ or ‘RPE’ in the title or abstract were identified. To refine the literature search the researcher focused on literature relating to subjective fatigue measured using RPE, objective fatigue measure using performance indicators. These performance indicators included power output, distance travelled, speed, and time trials. Based on the literature search, the models of fatigue that formed the core focus of the current study included psychological, cardiovascular, biomechanical, and neuromuscular fatigue models. The abstracts of these studies were then inspected to ascertain whether they contained information about the ‘exercise fatigue’ or ‘EMG’ or ‘RPE’ or
‘cycling’. The researcher then reviewed 176 studies which had information which was to be included in the literature review and discussion section.
2.2 Psychological Fatigue Model
Athletes often refer to mental preparation for events. This mental preparation is believed to improve their motivational levels and psychological readiness for the upcoming event (Nybo, 2008; St Clair Gibson et al., 2003; Swart et al., 2012). The benefits of psychological readiness are thought to have a positive impact on athletes’
neuromuscular readiness for a given exercise as athletes use visualisation techniques to prepare for the exercise psychologically (St Clair Gibson & Noakes, 2004). According to this school of thought, it is believed that athletes with low motivational levels for an event often possess reduced neuromuscular function which
may lead to poor muscle activation (Borg, 1982; Vollestad, 1997; Cochrane &
Sleivert, 1999; Tatterson et al., 2000).
In addition to the above, Pughet al., (2002) found that there was a difference in exercise performance when comparing laboratory performance to performance during competition. Untrained individuals generally reach volitional exhaustion around core temperatures between 38°C and 39°C, while trained participants generally reach volitional exhaustion at core temperatures above 40°C under laboratory conditions (Pugh et al., 2002). In contrast, trained athletes can still perform at core temperatures above 40°C during competitions without reporting volitional exhaustion (Pugh et al., 2002). The difference observed between the trained and untrained individuals can be attributed to factors such as the training status, motivational levels that are influenced by the competition environment, and personality types of the trained individuals (Cheung & McLellan, 1998; Pugh et al., 2002). These factors are attributed to the superior performance observed during competitions in trained individuals (Cheung & McLellan, 1998).
During cycling events it is well established (Nikolopoulos et al., 2001; Albertus et al., 2005; Abbiss & Laursen, 2008; Tucker, 2009; Micklewright et al., 2010; Faulkner et al., 2011) that professional cyclists possess superior pacing strategy versus their non-professional counterparts (Tucker, 2009). Albertus et al. (2005) observed the superior pacing strategy of trained athletes during a study investigating the impact of distance feedback on pacing strategy and perceived exertion during cycling. There were 15 well-trained cyclists who performed two 20-kilometers time trials; the controlled time trial cyclists were provided with accurate distance feedback but in the experimental condition, participants were provided with inaccurate distance feedback (Albertus et al., 2005). It was found that there was no difference in the finishing times between the two conditions and that the pacing strategies were not changed, with the power output data illustrating no significant difference between the two conditions (Albertus et al., 2005). There was a significant (p<0.05) difference noted in the HR data between the two conditions. It is noteworthy to mention that 20 kilometer is relatively short distance on a bicycle and may have not been a sufficient distance to elicit differing responses from well-trained cyclists who are accustomed to cycling 100 kilometer distances regularly (Lepers et al., 2002; Swart et al., 2012).
The evidence illustrating the psychological impact on cycling performance is equivocal, as there is no obvious link between the various sources of afferent feedback during exercise and the feedback’s impact on the psychological state of the athletes. The following factors are thought to have an impact on the on the psychological state of the athletes and thus the athletes’ performance: training status, ambient temperature, core body temperature, exercise duration, HR, metabolite accumulation, cadence, and the type of competition - marathon or sprint race (Halson et al., 2002; Lepers et al., 2002). However, there is no defined model to illustrate how all the information from the aforementioned factors affects the psychological response of the athletes’ during exercise (Halson et al., 2002).
The most acknowledged model to observe the psychological state of individuals’ and their exercise performance is Borg’s (1990, 1982) 15-point Rating of Perceived Exertion (RPE) Scale (Figure 1). However, there are other models, which perform a similar function such as the Borg’s CR – 10 Scale (Borg, 1990) and the Swedish Occupational Fatigue Inventory (SOFI) designed by Gutierrez et al. (2005). Others are Profile of Mood States (POMS) and Short Form Profile of Mood States (POMS- SF) outlined by Curran et al. (1995) and Lee et al. 1991).
Figure 1: Diagram of Borg’s RPE Scale (Adapted from Borg, 1990).
However, during studies of physical exercise activities the most commonly utilised scale to assess the onset of psychological fatigue is the RPE scale (Hampson et al., 2001; Baden et al., 2005; Green et al., 2006; Tucker et al., 2006; Swart et al., 2012).
It has been observed, as shown in Figure 1, that the onset of fatigue is associated with an increase in RPE and generally, volitional exhaustion occurs between extremely hard and maximal exertion (Green et al., 2007; Swart et al., 2012). The RPE scale has demonstrated a robust correlation to physiological responses to exercise such as HR, oxygen uptake, and cardiac output, with the exception of core body temperature (Green et al., 2006; Faulkner et al., 2007; Crewe et al., 2008;
Swart et al., 2012).
The use of the RPE scale during exercise is common and this is due to the robust nature of the RPE (Nybo, 2008; St Clair Gibson et al., 2003; Swart et al., 2012;
Fontes et al., 2013). However, RPE data alone is limited because it does not provide for an internal perspective on what occurs in the different brain regions during exercise (Borg, 1990). It is known that, as exercising participants perceive increased exertion because of a given exercise; their RPE response generally increases linearly with exercise intensity and duration (Green et al., 2006; Faulkner et al., 2007;
Crewe et al., 2008; Swart et al., 2012). Recent work by Fontes et al. (2013) has linked RPE responses to functional magnetic resonance imaging (fMRI) during cycling. This study offers a new method of understanding psychological fatigue response, while the fMRI data provides objective data to support the subjective RPE responses (Fontes et al., 2013). Furthermore, this study lends support for the importance of using RPE response during exercise, as now it is possible to link the physiological brain activity with the participants’ RPE response to a given exercise.
Although, Fontes et al. (2013) did not perform a fatigue exercise protocol during the cycling exercise, they noted that RPE increased linearly over time.
In addition, correlation analysis between RPE and the fMRI data revealed which regions of the brain are activated when participants are exercising below an RPE rating of 15, and when participants are exercising at an RPE equal or greater than 15 (Fontes et al., 2013). From the seven participants, only four participants’ data were used to correlate fMRI and RPE; however, these findings still provide insight into the
brain regions, which may be associated with the perception of exertion (Fontes et al., 2013). This evidence further supports the robust nature of the RPE responses having a strong correlation to physiological data during exercise (Swart et al., 2012;
Fontes et al., 2013). Relative to the other studies reviewed in the current research project, the work of Fontes and his fellow researchers in 2013 was not conducted during a prolonged cycling exercise. However, due to the consistency of the RPE response during exercises of varying duration, this permitted the inclusion of such a study in the current research project. Viana et al. (2016) made similar findings regarding the robust nature of RPE response during a study where nineteen participants performed four multiple-lap time trials of 9.9 kilometer each. A correlation between the RPE and POMS revealed that POMS data was able to explain for 88 % of the changes observed in the RPE responses during the multiple- lap time trials (Viana et al., 2016). The fact that RPE can be correlated to a variety of other fatigue indicators illustrates the important role that RPE has in linking factors such as psychological, physiological, and biomechanical response to fatigue exercises (Swart et al., 2012; Fontes et al., 2013; Viana et al., 2016). With RPE having such strong correlations with other fatigue indicators, this allows for a more holistic approach to the understanding of fatigue relative to the reductionist approach that may limit fatigue to a specific discipline. For example, within the discipline of physiology, the physiologist may refer to fatigue as decreased performance in a component of the physiological system, which has noticeable impact (Green, 1997;
Vollestad, 1997).
Another study by Crewe et al. (2008) was conducted in an environmental chamber where seven well-trained male cyclists performed five trials. Two of the five trials were performed at a cooler temperature of 15 °C (at 65% and 70% of their Peak Power Output) and the remaining three trials were performed at a hotter temperature of 35°C (at 55%, 60%, and 65% of Peak Power Output (PPO). It was established that fatigue onset occurred significantly (p<0.05) sooner at 35°C at 65% of PPO and at 15°C at 70% of PPO relative to the other conditions. Interestingly, in this study it was found that rectal temperature and RPE demonstrated a stronger linear correlation (r = 0.92) than the correlation of RPE and skin temperature. With RPE demonstrating a linear increase under all five conditions, with a significantly (p<0.05) higher positive gradient occurring during the 35°C at 65% of PPO condition and the
15°C at 70% of PPO compared to the 35°C at 55% of PPO condition. The participants demonstrated a faster increase in RPE ratings towards the end of the trials relative to the beginning of the trials. This may be an indication that the participants may have been receiving increased afferent feedback from the physiological systems and the working muscles in relation to metabolite accumulation, muscle trauma damage, and energy stores, which are some of the factors that affect RPE (Borg, 1982, 1990). Lastly, previous experience may also influence the athletes’ RPE response during similar exercises (Micklewright et al., 2010).
Evidence of the psychological impact on exercise performance of athletes has been observed in studies which have investigated the impact of pacing strategies (Nikolopoulos et al., 2001; Albertus et al., 2005; Tucker, 2009; Micklewright et al., 2010; Billaut et al., 2011; Faulkner et al., 2011).
It has been observed that exercise performance during exercise events where participants are informed of the exercise duration or the exercise distance yields superior performance results versus athletes’ performance where the participants are misinformed (Albertus et al., 2005; Faulkner et al., 2011). The impact of accurate exercise information and the participants’ experience may give the informed participants the advantage, which resulted in their superior performance (Faulkner et al., 2011). Faulkner et al., (2011) noted that athletes might adopt lower performance levels during exercise events where there is limited feedback concerning exercise duration. This pacing strategy may be adopted in order to maintain energy reserves for longer as exercise termination is unknown, and thus protects the exercising participants against premature fatigue onset (Tucker et al., 2004; Baden et al., 2005). Furthermore, the regulation of energy expenditure through such pacing strategies may help the exercising participants avoid premature exercise termination due to over-exertion (Tucker et al., 2004).
It was noted that superior pacing strategies exist in well-trained athletes relative to novice and recreational athletes (Takaishi et al., 1996; Faulkner et al., 2011). These superior pacing strategies may be facilitated by the years of experience accumulated by well-trained athletes relative to their recreational athlete counterparts. Takaishi et al. (1996) made similar findings where well-trained cyclists demonstrated superior
performance relative to their counterparts. The aforementioned evidence illustrates the importance of experience in selecting optimal pacing strategy in order to achieve superior exercise performance without premature exercise termination. Furthermore, well trained athletes are capable of anticipating the required power output during short cycling racing to such an extent that optimal performance is achieved while fatigue onset is delayed (Micklewright et al., 2010).
Under this school of thought, it is believed that athletes’ performance levels are linked to the athletes’ motivational levels. Decreases in the athletes’ motivational levels are believed to have a negative impact on their performance levels and are a sign of fatigue onset. Although there has been no evidence, detailing the exact mechanism illustrating how exactly diminished motivational levels affect physical performance. In addition, there is no clear evidence as to whether motivational levels affect athletes’ physiological response to exercise and vice versa. It is however, believed that changes in psychological factors have an impact of exercise performance in combination with afferent feedback from the working muscles (Albertus et al., 2005; St Clair Gibson et al., 2003; St Clair Gibson & Noakes, 2004).
Lastly, the Borg RPE scale is said to illustrate fatigue onset when the participants respond with increasing RPE scores over time during exercise activities. It is thought that changes in the working muscles can be observed through the assessment of the RPE scores, changes to muscle contraction strength, changes to exercise task performance, and in some cases the levels of perturbation regarding cognitive function.
2.3 Cardiovascular Fatigue Model
During exercise, the heart works to supply the working muscles with oxygen and remove the waste products from the working muscles such as lactic acid (Noakes, 2000). Evidence for the increased work rate by the heart during exercise can be seen in the increased cardiac output, increased HR, and increased oxygen utilisation by the working muscles (Noakes, 2000). Trained athletes generally have higher maximal oxygen uptake (VO2max) values relative to their sedentary counterparts (Noakes, 2000). The higher VO2max values of 70mL/kg/min to 80 mL/kg/min affords these athletes the capability of transporting sufficient oxygen to the working muscles during periods of increased work rate to meet their exercise demands (Noakes,
2000; Lucia et al., 2002). There are various factors which influence an athlete’s VO2max and these include genetics, plasma volume, blood cell mass, cardiac output, increased oxygen delivery, and oxygen utilisation at the tissue level (Coyle et al., 1992; Noakes, 2000; Goodman etal., 2005).
Heart rate and stroke volume are responsible for increasing an individual’s cardiac output (McArdle et al., 2007). The heart does have limitations in terms of contributing to the increase in cardiac output (Tanaka et al., 2001). An increase in age has been correlated to a decrease in maximal HR values, which in turn affects an athlete’s heart capability to pump blood to the working muscles (Tanaka et al., 2001). With endurance training, both athletes and sedentary individuals have been shown to improve their cardiac output due to an enlarged left ventricle of the heart muscle, which allows the heart to pump more blood through the aorta (McArdle et al., 2007).
The enlarged left ventricle is often the result of endurance training; other benefits of endurance training include greater left ventricular dilation, increased mitochondria, capillarisation and hypertrophy of the heart muscle, which do not occur in sedentary individuals (Goodman et al., 2005; Jeukendrup & Diemen, 2011). From the evidence presented above, it is reasonable to assume that exercise performance is limited by an individual’s cardiac output (Noakes, 2000). A study by Gonzalez-Alonso and Calbet, (2003) using eight healthy males during an intense upright cycling exercise until exhaustion, examined muscle blood-flow, cardiac output, mean arterial pressure and muscle oxygen delivery. The study found that with increased thermal stress there was a decrease in the participants’ cardiac output and mean arterial pressure with subsequent decrements to muscle blood-flow, oxygen delivery, and volume of oxygen uptake (Gonzalez-Alonso & Calbet, 2003).
The second finding from the study concerned the decrease in the oxygen uptake by the skeletal muscles prior to fatigue under normal conditions, and conditions with heat stress. The decrease in skeletal muscle oxygen uptake was associated to the similar lowering in both the skeletal muscle and systemic oxygen delivery as the leg vascular conductance, arterial oxygen content, and exercising leg oxygen extraction were unchanged. Thirdly, an enhanced muscle lactate accumulation, Adenosine Triphosphate (ATP), and Phosphate Chromium hydrolysis accompanied the reduced
leg oxygen uptake with heat stress, yet muscle energy stores were not depleted upon onset fatigue (Gonzalez-Alonso & Calbet, 2003).
Gonzalez-Alonso and Calbet (2003) noted that by the end of the exercise limitations to oxygen diffusion at the working muscles could not be the primary cause of fatigue.
This was because the leg arterial venous oxygen difference and extraction continued to increase throughout the exercise but never reached the maximum of 91%
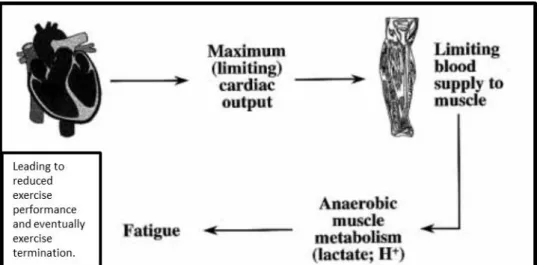
(Gonzalez-Alonso & Calbet, 2003). In a study conducted on cross-country skiers, Calbet et al. (2004) were able to demonstrate that reduced cardiac output attributed to diminished performance as illustrated in Figure 2.
Figure 2: The Cardiovascular / Anaerobic Model (Adapted from Noakes, 2000) Shei and Mickleborough’s (2013) observations during exercises of varying intensity was that cardiac output along with blood-flow to the working muscles rises to peak levels until the working muscles cannot accommodate the increased blood-flow. The result is both oxygen supply and metabolite removal from the working muscles is limited (Nybo, 2008; Shei & Mickleborough, 2013). This process occurs in both trained and sedentary individuals during exercise (Shei & Mickleborough, 2013).
The notion of cardiac output affecting performance is further supported by the fact that during exercise in hot conditions, there is a notable difference in exercise performance (Wall et al., 2013). Aerobic performance is affected by dehydration and the additional heat stress as it was thought that the decrease in the water volume in the body affects the blood volume, leading to lowered plasma volume. The lower plasma volume affects the cardiac output and stroke volume during exercise (Wall et
al., 2013). Lowered plasma volumes are thought to lead to a lowered cardiac output, which would affect blood-flow to the working muscles during exercise in both trained and sedentary individuals.
Exercise activities conducted under hot conditions in both self-paced and closed- loop exercise demonstrate similar performance decrements, (Lucia et al., 1999;
Lepers et al., 2000; Padilla et al., 2000; Allman & Rice, 2002; Kayser, 2003; Tucker et al., 2004). There is, however, minimal understanding of the biological mechanisms which are responsible for these performance decrements. The aforementioned notion that a decrease in cardiac output affects exercise performance has been the important point in explaining the onset of fatigue during exercise using the cardiovascular model.
However, there is evidence which indicates that the performance decrements observed during exercise activities in hot conditions may not be attributed to decreases in cardiac output and reduction in blood flow to the working muscles (Lucia et al. 2000; Cairns et al. 2005; Tordi et al. 2003; Pinniger et al. 2000; Tucker et al. 2004). As such, fatigue has been observed at a core temperature above 38°C (Millet et al. 2003; Tucker et al. 2004). The onset of the fatigue is regardless of the individual’s temperature prior to the exercise activity and the individual’s heat storage (Tordi et al., 2003; Noakes & St Clair Gibson, 2004; Tucker et al., 2004). Therefore, it has been postulated that the onset of fatigue observed during hot exercise conditions is associated with what is termed the critical core temperature (Tucker et al., 2004; Abbiss et al., 2010). Exercise activities, which raise the individual’s core temperature to critical levels are said to have an impact on the central nervous system, thus exercise performance is decreased to protect the individual and prevent potential catastrophic incidents (Millet et al., 2003; Tucker et al., 2004; Cairns et al., 2005).
Moreover, it is established that participating in exercise activities conducted under extreme weather conditions can have a detrimental effect on exercise performance (Noakes, 2000; Abbiss et al., 2010). Under cool conditions between 3°C up to 20°C performance decrements are less prevalent relative to exercise activities performed in conditions where the environmental temperature is above 31°C (Candau et al.,
1999; Garside & Doran, 2000; Noakes et al., 2001; Laursen et al., 2003; Tucker et al., 2004; Ozgunen et al., 2010).
The prevailing train of thought was that as a result of the hot environmental conditions the circulatory system will be negatively affected resulting in the reduction of cardiac output and blood-flow to the working muscle (Noakes et al., 2001; Tucker et al., 2004; Ozgunen et al., 2010). The negative impact is thought to increase because under hot environmental conditions the body needs to maintain homeostasis by maintaining adequate blood supply to the working muscles as well as the skin for thermoregulation (Ozgunen et al., 2010).
Signs of a malfunctioning central nervous system include confusion, dizziness, and poor coordination. Individuals who exercise until volitional fatigue in hot conditions exhibit these aforementioned markers. This illustrates that a perturbed central nervous system is a contributing factor to fatigue during exercise under hot conditions. Therefore, the cardiovascular system alone cannot be responsible for the onset of fatigue and subsequent termination of the exercise activity under such conditions (Gissane et al., 1991; Tucker et al., 2004; Ozgunen et al., 2010).
There are various aspects of the cardiovascular system that may be considered when looking at the probable causes of fatigue under the cardiovascular model.
These include plasma volume, muscle blood-flow, and blood volume. With endurance training, it is known that athletes generally improve exercise performance because of the increased number of mitochondria in the skeletal muscles, increased capillarisation, and an increase in red blood cells (Abbiss & Laursen, 2005).
Endurance-trained athletes possess superior blood volume levels compared to sedentary individuals with an average blood volume range of 4800 millilitres to 5000millilitres (Abbiss & Laursen, 2005). The increased capillarisation in trained athletes assists with the increase blood-flow to the working muscles during exercise resulting in a superior performance by trained athletes as compared to the sedentary individuals (Noakes, 2000; Ozgunen et al., 2010).
However, because the current study did not include the collection of blood samples, it was prudent to focus on factors that related to the cardiovascular, psychological and biomechanical models that could be understood under the current study’s parameters. For example, it is possible to relate the athlete’s exercise HR to the
athlete’s cardiovascular function. Therefore, factors such as metabolite accumulation and oxygen perfusion rate will not be discussed in the current study.
In summary, optimal cardiovascular function is imperative for delayed fatigue onset and maintaining desired exercise performance during exercise activities. Under the cardiovascular model, exercise performance is dependent on cardiovascular system’s capability to meet the working muscles’ substrate and oxygen demands. It is evident that when the demands of the working muscles are not met with sufficient oxygenated blood, and/or there is poor blood flow to the working muscles, fatigue onset is likely to occur sooner than later - more especially in sedentary individuals when compared to trained athletes (Tucker et al., 2004; Ozgunen et al. 2010). It is noteworthy to mention that the research pertaining to the cardiovascular model does not address the current research’s question on whether the athletes perceive fatigue onset prior to exhibiting fatigue symptoms and vice-versa.
2.4 Biomechanical Fatigue Model
Economical exercise patterns are thought to be critical when viewing fatigue using the biomechanical model. Cyclists who adopt non-economical cycling patterns are exposed to higher oxygen uptake (VO2) levels versus those cyclists who adopt economical cycling patterns. Furthermore, increases in oxygen uptake are associated with increased substrate utilisation for a given exercise (Takaishi et al., 1996; Takaishi et al., 1998; Passfield & Doust, 2000). The increased substrate utilisation gives rise to increased core body temperature and a higher rate of metabolite accumulation versus metabolite clearance (Lambert et al., 2005; Enoka &
Duchateau, 2008; Ament & Verkerke, 2009; Shei & Micklebrough, 2013). The factors that are thought to be the sources of biomechanical fatigue are attributed to the economical exercise patterns and muscular contractions more specifically the stretching-shortening cycle. For example, an individual who has a linear gait pattern versus an individual who deviates greatly from a linear trajectory will likely experience the onset of fatigue sooner. Similarly, if the stretching-shortening cycle time of an exercising muscle changes it may be the result of fatigue onset (Komi, 2000).
2.4.1 Economical Exercise Patterns
Athletes who have exhibited higher levels of oxygen uptake levels during prolonged cycling exercise have been associated with reduced performance levels because of poor cycling economy (Coyle et al. 1992; Lucia et al. 2002). The reduced performance levels can be observed in reduced MVC and power output of the athletes (Abbiss et al., 2010; McCartney et al., 1983).
Hence, professional cyclists possess superior performance capacity relative to recreational cyclists because the professionals have greater economy during exercise resulting in lower levels of oxygen uptake along with performing well below their anaerobic threshold (Noakes, 2000). This creates a buffer that allows professional cyclists to attain superior performance during exercise compared to recreational cyclists (Wiener et al., 1995; Lucía et al., 2000).
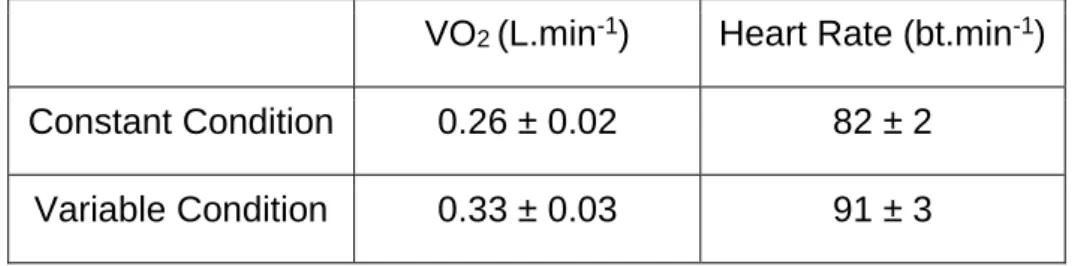
Kang et al. (2005) showed that it was more economical to cycle at constant exercise intensity versus adopting variable cycling intensity (Table I). During a study involving 15 participants (seven males and eight females) there were no significant differences observed in the average HR and oxygen uptake, and RPE data between the 2 conditions tested during the exercise. In contrast, data collected at the end of the exercise protocol revealed that there was a significant (P< 0.05) difference in average HR and oxygen uptake at the end of the exercise (Table I).
Similar results were observed by Theurel and Lepers (2008) where the constant power output condition resulted in lower fatigue levels compared to the variable power output condition, as the power output of the constant condition was higher compared to the variable power output condition (Theurel & Lepers, 2008).
Table I: Difference between Constant versus Variable exercise intensity (Kang et al., 2005)
VO2 (L.min-1) Heart Rate (bt.min-1) Constant Condition 0.26 ± 0.02 82 ± 2
Variable Condition 0.33 ± 0.03 91 ± 3
In addition, the lactate levels at the end of the exercise protocol were higher in the variable condition compared to the constant condition, (7.2 ± 0.8 vs 2.7 ± 0.3 mmol.L-1) respectively. Kang et al (2005) asserted that when exercising at a constant average exercise intensity there is minimal added demand placed on the physiological systems but exercising at a varying average exercise intensity will lead to higher oxygen uptake post-exercise and lactate levels. The economic benefits of constant average exercise intensity have also been attributed to the African runners, more specifically the Kenyan runners’ superior performance when compared to Caucasian runners (Weston et al., 2010).
Overall exercise economy is affected by various factors including but not limited to the specific exercise performed, training status, and cycling cadence which is important when observing fatigue (Macintosh et al., 2000; Lepers et al., 2001; Lucia et al., 2002; Hamada et al. 2003; Lucia et al. 2004). Professional cyclists have been observed to select higher cadence compared with their recreational cyclists (Takaishi et al., 1996). Cadence levels of 70 revolutions per minute (rev.min-1) and a cadence range of 80 to 90 rev.min-1 have been observed in recreational cyclists and professional cyclists respectively (Takaishi et al., 1996; Takaishi et al., 1998). In both cases, the selected cadence has been associated with lower neuromuscular fatigue, as it is thought that power output achieved by the respective cyclists and their selected optimal cadence improves cycling economy, increases cardiac output and minimises blood occlusion (Takaishi et al., 1998; Calbet et al., 2004; Corbett et al., 2011).
Gotshall et al., (1996) observed similar results where professional cyclists cycling at a cadence of 110 rev.min-1 had a notable decrease in their arterial venous oxygen difference, lending support for the notion that the cardiac output was more than adequate in meeting the oxygen demands of the given exercise. The increased cardiac output is also thought to improve the clearing of metabolite accumulation such as lactic acid in the working muscles (Balsom et al., 1999; Rasmussen et al., 2010). The higher cadence has the added benefit of reduced power output requirements as there is less inertia for the cyclists to overcome with each stroke and higher cadence relative to lower cadence which activates fewer fast twitch fibres which are not as fatigue resistant as slow twitch fibres (Argentin et al., 2006;
fibres makes them non-economical relative to slow twitch muscle fibres and this may be one of the reasons professional cyclists prefer the higher cadence (Gotshall et al., 1996; Takaishi et al., 1996; Macintosh et al., 2000).
During prolonged cycling exercises, muscle activation will increase as athletes become increasingly fatigued over time (Shei & Micklebrough, 2013). The increased activation occurs as athletes attempt to maintain desired performance levels by recruiting new and non-fatigue muscle fibres (Vøllestad, 1997; Westerblad etal., 2010). The increase in muscle fibre recruitment is associated with increased oxygen uptake as the athletes’ muscles attempt to compensate for the fatigued muscle fibres (Vøllestad, 1997). In summary cyclists who adopt sustainable cycling patterns may be able to delay the onset of fatigue and maintain higher performance levels for longer periods compared to non-economical cyclists.
2.4.2 Muscular Contractions – Stretching and Shortening Cycle
During exercise activities, muscles will experience both concentric and eccentric contractions (Green, 1997; Komi, 2000). Cycling exercises the majority of the muscles of the lower limbs, quadriceps, biceps femoris, and gastrocnemius (Gollhofer et al., 1987 & Komi, 2000). These muscles and other lower limb muscles go through what is termed the stretch-shortening cycle (SSC) (Komi, 2000).
Eccentric contractions form part of the stretching phase while concentric contractions are part of the shortening process during the SSC (Komi, 2000). Explosive exercise such as some plyometric exercise focus on capitalising on the benefits of the stored energy in the tendons and ligaments (Komi, 2000; Place et al., 2010). The elastic nature of the ligaments and tendons is what provides the energy, which is recuperated during the shortening phase and utilised to provide maximal stretching (Gollhofer et al., 1987; Komi, 2000). Komi (2000) found that there is about 6% to 8%
increase in muscle-tendon length during observation of exercise activities such as drop jumps, sprinting and skipping rope. During cycling, the stored energy may be utilised to improve power output during the lengthening phase and thus has the potential to improve the cycling performance because of the efficient SSC (Gollhofer et al., 1987; Komi, 2000).
However, the elastic energy has limits due to repeated shortening and stretching during prolonged exercise activities, which may lead to the working muscles fibres
becoming damaged and fatigued. This means the elastic energy is limited, depending on the fatigue resistance of the working muscles and the training status of the athlete (Gollhofer et al., 1987). The repeated SSC process may also decrease the efficiency of the elastic effect of the ligaments and tendons, progressively attenuating the impact the elastic energy has on force production with each stroke (Komi, 2000; Kay et al., 2001).
Overtime the SSC process duration increases, resulting in the exercising athletes’
performance decreasing due to longer contraction period in the working muscles (Vollestad, 1997; Kay et al., 2001). The afferent feedback from the working muscles and Golgi tendons is associated with the increased contraction period in an effort to prevent a catastrophic event (Marino, 2004; Noakes et al., 2004; Tucker et al., 2006). With increased fatigue there is a high possibility of muscle damage while the afferent feedback reduces the central nervous system (CNS) stimulation of the working muscles and reduces the motor unit firing rate for protective purposes (Enoka, 2012; Taylor et al., 2000). It evident that peripheral fatigue and central fatigue factors contribute to the overall observed peripheral fatigue, even though central fatigue may have minimal impact; it cannot be disregarded (Vollestad, 1997;
Tucker et al., 2006). Therefore, superior performance and reduced fatigability is a result of improved exercise economy especially in cycling, as it results in economical cycling (optimal cadence selection) strategy. This is because professional athletes can maintain the higher cadence, which requires lower oxygen uptake, and force production. The overall impact of these factors is that professional cyclists are able to maintain higher performance levels for longer, maintain lower core body temperature, reduce the rate of metabolite accumulation, and invariably delay the onset of fatigue (Tucker et al., 2006).
Minimal attention is given to the major contributing factor to the onset of fatigue under this school of thought. There is no precise distinction as to whether the poor cycling economy leads to altered SSC process resulting in overall performance decrements. Alternatively, changes in the SSC precede the altered economy of cycling. Furthermore, this school of thought, similar to the others in this study give minimal attention to the question of whether athletes exhibit poor exercise economy prior to perceiving the fact that they are becoming progressively fatigued and vice-
2.4 Neuromuscular Fatigue
Some of past research into the development of fatigue during prolonged exercise has assumed that exercise performance is determined by either the ability of the cardiovascular system to provide enough blood, nutrients and oxygen to the working muscles, or the ability of the energy systems to deliver sufficient energy substrates to the working muscles. There is the notion that fatigue during prolonged exercise such as long-distance cycling races, is because of individuals’ experience of fatigue because of neuromuscular changes. Neuromuscular fatigue can be defined as the reduced ability of an individual to generate action potentials which can activate the appropriate muscle mass to meet the exercise demands. In addition, the reduction in the action potential delivered to the working muscles, together with neuromuscular fatigue is thought to be the result of reduced actin myosin coupling at the sight of the working muscles. From the aforementioned concepts about neuromuscular fatigue illustrated in Figure 3 by Vollestad, (1997), it is evident from the brain to the working muscles there are three sites where it is proposed neuromuscular fatigue emanates.
These three proposed sites are discussed separately in detail regarding their potential role into the onset of fatigue during exercise.
2.4.1 Central Fatigue
To provide a clear description of neuromuscular fatigue, it is prudent to discuss each proposed site of fatigue. The CNS is responsible for the providing neural stimulation to the working muscles (Vollestad, 1997). It is thought that when there is reduced stimulation by the CNS to the working muscle, this onset, which is also termed central fatigue, is encompassed within the term neuromuscular fatigue (Vollestad, 1997). However, scientific research in this area is equivocal as fatigue is a complex and multifaceted topic (Takaishi et al., 1996; Lepers et al., 2000; Noakes, 2000; Kay et al., 2001; Noakes et al., 2001; Allman and Rice, 2002).
Lepers et al. (2001) observed the quadriceps muscle during a five-hour cycling exercise where participants were required to exercise at 55% of maximal aerobic power. It was noted that the vastus lateralis muscle showed significantly decreased electromyography (EMG) activity from the beginning of the exercise protocol. In addition, when using twitch interpolation technique, it was found that the vastus medialis muscle along with the central activation was reduced significantly by the