1 | P a g e
uPhongolo Municipality Annual Report
Financial year 2013/14
2 | P a g e
Table of Contents
CHAPTER 1: MAYOR’S
FOREWORD………...4
1.1 MAYOR’S FOREWORD………...4
EXECUTIVE SUMMARY………8
1.2. MUNICIPAL MANAGER’S FOREWORD ... ……….8
1.3.MUNICIPALOVERVIEW ... 11
... 11
COMPONENTA:DEMOGRAPHICPROFILE ... 11
COMPONENTB:ECONOMYGROWTH ... 13
CHAPTER 2 – GOVERNANCE………..15
COMPONENTA:POLITICALANDADMINISTRATIVEGOVERNANCE………..15
POLITICALGOVERNANCESTRUCTURE ... 15
HIGHLEVELADMINISTRATIVEGOVERNANCE ... 15
COMPONENTB:INTERGOVERNMENTALRELATIONS………..16
INTERGOVERNMENTALRELATIONS ... 16
COMPONENTC:PUBLICACCOUNTABILITYANDPARTICIPATION……….16
PUBLICMEETINGS ... 16
2.5 IDPPARTICIPATIONANDALIGNMENT ... 17
COMPONENTD:CORPORATEGOVERNANCE………17
2.6. RISKMANAGEMENT ... 17
2.7. ANTI-CORRUPTIONANDFRAUD ... 17
2.8.SUPPLYCHAINMANAGEMENT ... 18
2.9.BY-LAWS ... 18
2.10.WEBSITES ... 18
2.11.PUBLICSATISFACTIONONMUNICIPALSERVICES ... 19
2.12. ALLMUNICIPALOVERSIGHTCOMMITTEES ... 19
CHAPTER 3: SERVICE DELIVERY PERFORMANCE (PERFORMANCE REPORT PART I)………20
3.1EXECUTIVE SUMMARY MUNICIPAL PERFORMANCE………...20
3.4ORGANISATIONAL SCORECARD………24
3.5 CONTRACTOR PERFORMANCE 2013/14……….48
COMPONENTA:INTRODUCTIONTOTHEMUNICIPALPERSONNEL……….58
4.1EMPLOYEETOTALS,TURNOVERANDVACANCIES ... 58
COMPONENTB:MANAGINGTHEMUNICIPALWORKFORCE………...59
4.2POLICIES ... 59
4.3INJURIES,SICKNESSANDSUSPENSIONS ... 60
4.4PERFORMANCEREWARDS ... 61
COMPONENTC:CAPACITATINGTHEMUNICIPALWORKFORCE………62
3 | P a g e
4.5SKILLSDEVELOPMENTANDTRAINING ... 62
COMPONENTD:MANAGINGTHEWORKFORCEEXPENDITURE………..64
4.6EMPLOYEEEXPENDITURE ... ….64
CHAPTER 5 – FINANCIAL PERFORMANCE………66
CHAPTER 6 – AUDITOR-GENERAL AUDIT FINDINGS………83
REPORTONTHEFINANCIALSTATEMENTS……….83
INTRODUCTION ... 83
ACCOUNTING OFFICER’S RESPONSIBILITY FOR THE FINANCIAL STATEMENTS ... 83
AUDITOR-GENERAL’S RESPONSIBILITY ... 83
OPINION ... 84
EMPHASIS OF MATTERS ... 84
MATERIAL LOSSES ... 84
ADDITIONAL MATTERS ... 84
UNAUDITED SUPPLEMENTARY SCHEDULES ... 84
UNAUDITED DISCLOSURE NOTES ... 84
REPORTONOTHERLEGALANDREGULATORYREQUIREMENTS ... 85
PREDETERMINED OBJECTIVES ... 85
MATERIAL LOSSES ... 89
APPENDICES………99
UPHONGOLO LOCAL MUNICIPALITY ANNUALFINANCIAL STATEMENTS………..116
INTERNAL AUDIT COMMITTEE REPORT………..168
GLOSSARY OF TERMS AND ABBREVIATIONS………208
4 | P a g e
Chapter 1: Mayor’s Foreword
1.1 Mayor’s Foreword
The Hon Mayor: Cllr. M. M. HADEBE
Honourable Speaker, Members of the Council, the Executive Committee, the Community at large, Municipal Manager and officials, it is with profound gratitude that I present to you the Annual Report for the financial year ending June 2014
Top of our Agenda in this financial year has been a dedicated effort to be one with the strategic priorities issues as promulgated by the Provincial growth and development strategy read together with the National Development plan. As such we have hoisted education, health, fighting crime and corruption, rural development, Job creation, nation building and good governance.
In line with the above strategy and on a groundbreaking note the municipality has embarked on structural projects to address the provincial priority issues. In the education sphere we have continued in our quest to get the small infant in class as early as possible (as prescribed in the NDP) by building crèches in all our communities. Our vision being that there be at least one crèche in all our wards. In this reporting financial year we dedicated almost 2 million for crèches in wards 4, 5 and 11. In the next financial year we will add another crèche in ward 7. Construction is still underway for these projects.
5 | P a g e As a way of encouraging a healthy population, we have embarked on a healthy lifestyle campaign, structurally spearheaded by the construction of sports field within our rural and urban wards. Sports field are currently under construction or being upgraded in Mkhwakhweni, Belgrade, Ncotshane and Sigungwini. A total of 5.5 million was provisioned for these sports fields and we are expecting them to be finished early next financial year. It is my conviction that as we do this nation building, creating jobs through, building sports fields, crèches and community halls, many a child shall be saved from crime and HIV and will have a chance to be educated for the better preservation of this our future and our nation.
Over and above these delicate issues noted, the Council has also been busy with other projects that will change the face of uPhongolo for generations to come. To mention but a few of these, High Mast solar lights have been erected and are fully functional in Ncotshane, we hope to deter criminal acts through this provision, Solar street lights were also erected in partnership with COGTA and are fully operational in the CBD. We have also worked notably hard in changing the image of our city roads infrastructure which had become every comedian’s opening line. New Republic street, Naude and Jan Mielie streets have recently been given a new life. I assure our motorist and pedestrian citizenry that potholes will by the end of this new financial year be a thing of the past. The Municipality has also embarked on the construction of a new taxi rank and a flea market in the central CBD that are nearing completion stage. This has been aimed at creating new opportunities for the informal sector and entrepreneur in you. The informal sector has a vast job creation capacity and as we continue to evolve ever towards our development, this initiation will stimulate our job creation capacity.
Honourable Speaker, you will remember that in the last financial year R 822 604.00 that was earmarked for EPWP projects was withheld. The explanation for this was under expenditure as only R 200 000 had been spent in 2012/13. I am proud to report today that in the 2013/14 financial year, we not only utilized the 1million EPWP grant but also the R 822 604 Rolled over. In our corrective efforts, the municipality managed to create 10 286 work opportunities. A total of 15 new projects were implemented and the Department of Works has for the next financial year
6 | P a g e awarded the municipality R1 837 000.00. We look forward to the next chapter of this and other development as we strive to reach new heights every year.
Council has also recently revised its vision and strategic objectives in the latest IDP.
Our new vision reads;
“uPhongolo Local Municipality will ensure an inclusive socio-economy by providing quality services that yields a better life for all by 2030.”
The new strategic objectives have a bearing on our vision and were used in the creation of measurable performance targets for the new financial year. I also welcome our new HOD for community services, Mr. Msezane who has recently joined us. It is our belief that his efforts will further our cause and enable us to meet our mandate as enshrined in the legislation as well as our IDP. Honourable Speaker, we have finally secured the services of a new Corporate services manager. We can attest to our citizenry, that the arrival of these two HODs will only bolster our efforts and enable us to speed up service delivery.
I would like to thank our community members for the tremendous support they have shown during our IDP roadshows which were well attended. We shall continue to create more awareness and more platforms to educate the community on the importance of public participation in an effort to improve service delivery. We believe that our employing of schools, churches, notice boards and other means have been the reason for the strong turnout. We however welcome any suggestions on how we can improve out communication with the community at large.
As we embark on this new financial year, I would like to continue to thank the administration for their hard work as we continue with our turnaround strategy. I urge the community to shy away from destroying public facilities as this will only mean that we divert funds for new development to repair the destroyed structures.
This kind of behavior can only lead us backwards. Honourable Speaker, service delivery is what we want to see, it is therefore with concern that critical targets that we set have not been met.
7 | P a g e I urge all HODs to instill a culture of deliverance in their departments. I want to see the 8 million that was withheld released and spent in the next financial year. All projects that are lagging behind should have penalties applied to the respective contractors.
Lastly I wish to thank all the Councilors, Honourable Speaker, for the hard work they have put in their respective roles of oversight and as committee members. The Municipality can only achieve more in unison. Also would like to thank the communities of uPhongolo and their parties for orchestrating a peaceful and highly successful election and for the continued support we receive whenever we call upon you. We thank the administration and all the employees for their sacrifice in trying to change the peculiar circumstance of our people that we inherited from apartheid and still struggle to shake off.
I thank you,
Cllr. M. M. HADEBE HONORABLE MAYOR
8 | P a g e
Executive summary
1.2.
Municipal Manager’s Foreword
Mr. N.M. Mabaso
Chapter 7 of the Constitution provides for the establishment and functioning of Local Government
Section 152 (1) states that the objects of local government are -
to provide democratic and accountable government for local communities;
to ensure the provision of services to communities in a sustainable manner;
to promote social and economic development;
to promote a safe and healthy environment; and
to encourage the involvement of communities and community organisations in the matters of local government.
In line with the above mandate and in order to better serve our communities the municipality embarked on a strategic meeting where we reexamined our vision and objectives. A SWOT analysis was performed to better understand our position and the direction our development should follow. We also reexamined our organogram to cater for our new mission and our SDBIP is indicative of these changes.
In this reporting financial year we had a set of mixed results. On the brighter side the municipality was able to source funding for the solar street electrification and high mast lights to brighten up Ncotshane and town. We also managed to acquire our own refuse truck which should drastically change the cost setting of this service as much of the work
9 | P a g e will be done in-house. A fleet of vehicles was also acquired to intensify project monitoring and allow the municipality to cut costs on travelling associated costs. Our strategy has been to bring in-house routine services that we engage on daily whose cost was ballooning over the years. It is my reckoning that savings made from these undertakings will be ploughed back for the betterment of our people.
We also sought to take the spirit of COPE 17 into practice by implementing a town beautification initiation. The result of this project was a much greener and cleaner Pongola. The municipality addressed the long standing issue of potholes and resurfaced roads in town and several access roads in rural areas. This has totally changed the image of our town making it more attractive for investors.
The previous year the municipality failed to utilize the EPWP grant, I am proud to report to you that in this reporting year we managed not only to create over 70 casual jobs but we also got rewarded by the Department who almost doubled our normal grant to 1.8 million.
Other notable improvements were in IT, new website, Wi-Fi and new computers upgrading from 2007 windows to windows 8 to improve communication. Community consultations with ward councilor’s mayoral izimbozos in compliance with democratic constitution capacitated our audit and MPAC with the intention of improving oversight on administration.
The previous year Audit opinion was less gratifying than we had hoped. The qualification Audit opinion was a wakeup call, as it only inspired us to introduce a series of internal controls including the employment of a risk and performance manager to ensure that the next opinion will be more positive. The qualification itself was based on (leave days) lack of reconciliation; this was primarily caused by the fact that the pay day system we use had a different financial year to the one we use. This has since been rectified and all our leave days tally. The other issues raised were unauthorized expenditure and assets register. I would like to assure the community that the municipality created an audit action plan that closely followed all audit queries throughout the year to insure that the
10 | P a g e matters do not recur. We have also hired a new Asset Controller who was promoted from our intern system and is already making a huge difference in that department.
During the 2013 financial year cash from operating activities showed a positive improvement of R 38.9million (R29.9million in 2013). This means the municipality was able to generate sufficient cash through its normal operating activities to sustain its related commitments. Cash from investing activities continued a negative growth form R19million in 2013 to R50million this reporting year. The cash balance was R13.6 million in the year under review as compared to R23.4million in the prior year. This should not be interpreted negatively as the municipality had a healthy R41.5million in surplus in the reporting year. Further. Total liabilities were R36 million against a strong R317 million total assets meaning the municipality is more than able to meet its debtors demands.
The municipality borrowed a loan of R4.5 million to finance the vehicle fleet that should see a major reduction in maintenance and vehicle hiring related costs.
In this financial year we welcomed Mr. Msizane as the new Community Services Manager, replacing Ms. Boniwe Zulu who while still acting on the post left to pursue other interest. We are grateful to Council for his appointment and look forward to an improved contribution from his department. I also take this opportunity to bid farewell to Ms. Zulu and wish her all the best in her new endeavors. The interviews for the post of Corporate Services Manager were also conducted and a selection was made. In line with the legislation we have submitted all information required to the MEC of COCTA and await confirmation of the candidate by the MEC. Most operational problems we have had have mainly emanated from the corporate section as it is the engine that drives all personnel. We anticipate that the new era with a full HOD compliment will enable us to maximize our potential and fast track service delivery.
I would like to conclude by thanking you all for your valuable contributions towards unleashing a better life for all in by 2030.
_______________________________
MR. N. M MABASO
MUNICIPAL MANAGER
11 | P a g e
1.3. MUNICIPAL OVERVIEW
Figure 1.0
The uPhongolo Local Municipality is one of the five local municipalities’ located within the area of the Zululand District Municipality. The Municipality is governed by a Council consisting of 27 Councilors and an Executive Committee. The administrative functions are performed by the Municipal Manager, assisted by other S56 managers consisting of the Chief Financial Officer, Technical Services Manager, Corporate Services Manager (selected) and the Community services Manager.
The Municipality is located in KwaZulu-Natal in the Northern area of Zululand District Municipality (DC26). The Municipality consists of 14 wards and it has a geographical area of 3 239km².
COMPONENT A: DEMOGRAPHIC PROFILE
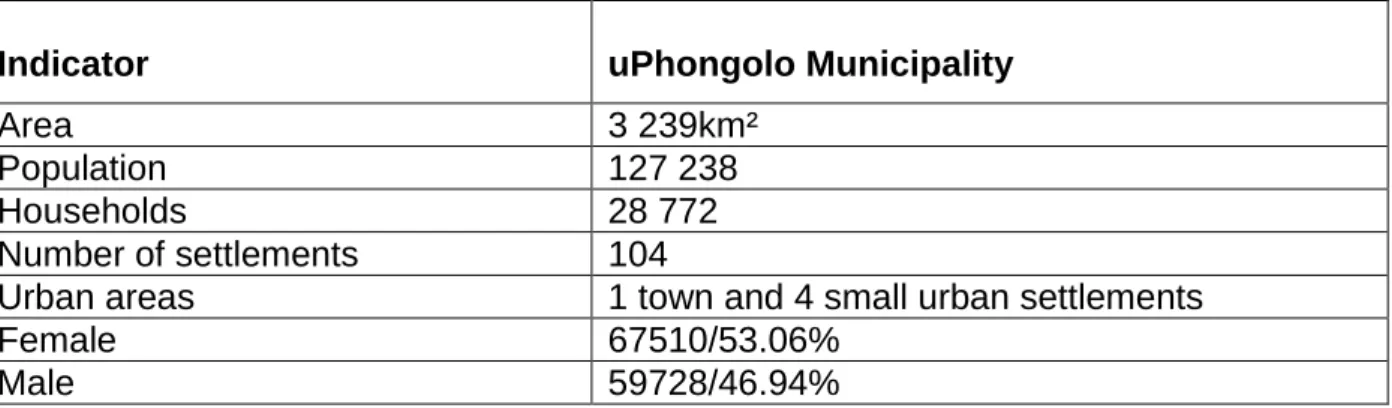
12 | P a g e Table 1.2: Area Statistics
Indicator uPhongolo Municipality
Area 3 239km²
Population 127 238
Households 28 772
Number of settlements 104
Urban areas 1 town and 4 small urban settlements
Female 67510/53.06%
Male 59728/46.94%
Source: SA Stats 2011
Most of uPhongolo citizens (82%) reside in the rural areas. It is interesting to note that population has decreased dramatically from 149 543 (ZDM household survey 2008) to the current official statistics 2011 showing 127 238. The population experienced a total decrease of 22 305 (14.9%) when compared with ZDM survey results OF 2008. The new administration has undertaken to prioritise the development of uPhongolo making full use of allocations and applying for rollovers for the unspent funds. Females are the dominant gender in Pongola.
Table 1.3: Life statistics
Indicator Description Value
Gender breakdown Males 46.94%
Females 53.1%
Age breakdown 0 -14 51.78%
15 -64 43.93%
65+ 4.29%
Life expectancy In 1998 65 years
In 2011 48 years
Age breakdown analysis shows a decrease of 12.47% in the 15 to 64 age group meaning that uPhongolo has become a breeding and training ground of the South African labor force were upon attaining qualifications and experience the working age group departs for greener pastures. As such major interventions through the provision of access roads, electricity and proper sanitation are required as our priority areas in the IDP will indicate.
This kind of investment will bring development that can lure our citizens to stay and develop with us instead of migrating.
13 | P a g e COMPONENT B: ECONOMY GROWTH
UPhongolo has 50 km² of sugarcane and subtropical fruit plantations surrounding it using drastic irrigation systems. The town of Pongola has thrived as a result of the canal system and a sugar mill that was built which together with the sugarcane plantations and government employment sustains the livelihood of the people of uPhongolo.
The N2 national road corridor passes through the uPhongolo area as a national link between Gauteng and Richards Bay then Durban in the south. It also connects with Swaziland just to the north of the uPhongolo Municipal area. This is the primary development corridor in uPhongolo.
The Pongola area also has many tourist attractions including Game Farms and Lodges, the Pongolapoort Dam, famed for its Tiger Fishing and surrounding wildlife, cultural history and much more. The town of Pongola is wedged between the Swaziland border and the Pongola River and has all the modern facilities, Supermarkets, Hospital, Small Airport, 9 (hole) Golf Course, Tennis and Bowls. Pongola has an unparalleled selection of excellent game camps and lodges in which to spend the night. Around Pongolapoort Dam there are 10 lodges in the Pongola Game Reserve which has four of the Big 5.
The two main rivers in the municipality are the Mkuze River in the south and the (Pongola) River in the north, the latter feeding the Pongolapoort Dam, located on the eastern boundary of the municipality. Agriculture and tourism form the basis for the municipality’s economy. Major development components consist of game and nature reserves, agricultural activities, traditional settlement areas and some urban nodes.
The public sector is the dominant provider of employment opportunities. However, the informal sector is expanding, primarily based on the taxi industry, informal financial services and taverns. Average income levels are low, with 66% of households receiving no income or less than R2 400.00 per month. The traditional and rural areas are the most poverty stricken.
Unemployment levels are relatively high; only 13.43% of the population is formally employed.
Close to half of the population are children, placing pressure on the need for educational and social facilities. Many of these children are orphaned as a result of HIV/AIDS.
There is a clear sign that more and more young people are getting educated. In 2001 a total of 6757 people had Matric while in 2011 it increased to 15 703(source-census 2011). This becomes a challenge for the municipality if there are limited places of work that will employ this
14 | P a g e generation. The district has since embarked on a journey to sensitise the business people on investment opportunities that the district offers. Further a database has been created registering all unemployed youths with the intention of providing them with internship positions to enhance their practical learning and increase their marketability. Further, we have started employing large numbers from all wards under the EPWP programme.
The Municipality has also embarked on several activities to speed up the growth of uPhongolo.
This has been achieved by the investment in a flea market complex which has just been completed. This market is expected to benefit from the free flow of tourists visiting the many game reserves in the area, as well as encourage locals to be productive as there is a selling place for their products. There has also been a newly developed mall at uPhongolo which has since seen the attraction of other major retail chains into this growing town. These opportunities have not only increased job opportunities but also have increased the quality of lifestyle for the local citizens as they can now shop at the best shops in South Africa.
Looking into the future, growth in the agricultural sector is predicted to be relatively stagnant at 1.6 % on average for the period 2010-2015. Be that as it may, uPhongolo will see major structural developments in the near future as more and more retailers are establishing their mark on our map. As a municipality we aim to ease and facilitate this development by providing state of the art infrastructure. Currently our roads are in a very bad state but we are correcting that scenario. Growth in the manufacturing sector is predicted to be relatively stagnant at 2.5 % on average for the period 2010-2015. The municipality hopes to speed this up through training of small informal sector business to provide building blocks services, so they can take advantage of the current boom in the building section that is buffered nationally by the current low interest rates.
15 | P a g e
Municipal
ManagerManager Corporate Services
Manager Community
Services Technical Director Chief Financial Officer
Chapter 2 - Governance
COMPONENT A: POLITICAL AND ADMINISTRATIVE GOVERNANCE
POLITICAL GOVERNANCE STRUCTURE
Figure 2.0
HIGH LEVEL ADMINISTRATIVE GOVERNANCE
Figure 2.1
Council
Councilors x
9 Councilors x
9 Councilors x 9
Speaker MPAC
Mayor
16 | P a g e COMPONENT B: INTERGOVERNMENTAL RELATIONS
INTERGOVERNMENTAL RELATIONS
Municipality maintains healthy relations with all government entities. Most Government structures are always ready to assist when required. It must be mentioned that COGTA provides the most valuable support to this Municipality through regular meetings; finance for certain projects, training of personnel and placements of critical personnel when necessary. It also engages with the district Municipality especially on sanitation and water services. It must be mentioned however, that we currently have a huge backlog in that particular department and we have initiated talks with the district municipality in order to resolve them.
The Municipality also works with different departments in co-ordinating izimbizo and service delivery. The Municipality looks forward to working with the department of education in its endeavours to build sport facilities that can be utilised towards racial integration, as well as the department of rural development to unlock the land potential for our growth in the near future.
COMPONENT C: PUBLIC ACCOUNTABILITY AND PARTICIPATION
PUBLIC MEETINGS
Despite the legislative imperative, local government is, by essence, obliged to maintain effective communication with the communities. Likewise, the communities have a responsibility to participate and be involved in the affairs of the municipality. At uPhongolo local Municipality, engagement with communities is ensured through the following structures and mechanisms:
IDP and budget road shows
Council meetings where we want to start including traditional leaders participation Mayoral Izimbizo
Print media newsletters, letters and notices for tendering and appointments Electronic media, notably the website and the municipal video system
Open door policy which allows communities that are disgruntled to walk in and lodge their complains with the relevant officials
Annual reports which are tabled before Council and copies are found on the website and distributed to communities
17 | P a g e 2.5 IDP PARTICIPATION AND ALIGNMENT
The Municipal Manager has a delegated responsibility from the Mayor, to prepare the IDP for the Municipality. During the IDP review, the following key elements were addressed within the confines of the approved IDP Process Plan and Framework Plan:
Comments were received from the various role-players in the assessment of the IDP Review documentation.
Certain elements of the IDP were reviewed in terms of Council’s new priorities, including the Spatial Development Framework.
New information was included.
The IDP was aligned with newly completed Sector Plans
The final IDP was tabled before Council in May 2012. There was consideration of community and stakeholder inputs, leading to the final IDP being approved by Council.
COMPONENT D: CORPORATE GOVERNANCE
2.6. RISK MANAGEMENT
Although all managers and employees are responsible for risk management in their own areas, the municipality has set up committees to address this important task. The risk identified earlier in the Municipal manager’s report compounded by community risks such as HIV and AIDS, poverty, illiteracy and unemployment as more and more companies close due to shrinking demand. The municipality’s community services department has set up a number of projects to cater for all the risks identified above. These include compiling a database of all the unemployed graduates in our municipality so as to offer them jobs through the maintenance projects as and when they arise.
2.7. ANTI-CORRUPTION AND FRAUD
The Municipality has developed a strategy to detect corrupt and fraudulent activities and has managed to implement this strategy effectively this financial year. It is thus interesting that even though the municipality got a qualified in the previous year, this was not due to incidence of corruption or fraud. The items of emphasis were fruitless expenditure, leave reconciliations and asset register. The municipality has developed an Audit Action Plan to address all issues raised by the AG Office.
MPAC is also meeting as required and carrying out an oversight role and assisting Council by investigating all cases referred to it. An Audit Committee is also in-place comprised 3 members who are highly qualified and all of them are external. The committee met 5 times in this financial year.
18 | P a g e The municipality has developed the Fraud prevention strategy that was approved by Council and is being implemented. We also have instituted an enterprise risk management framework which also includes the risk management policy.
The strategy involves;
Surprise audits by the internal audit unit Post transactions review
Forensic data analysis performed by the KZN forensic services were necessary Management Accounting report review
The challenges that the audit committee faced in this financial year as the late submission of the financial statements by the hired service providers as the municipality did not have most key personnel for the year. This led to non-auditing of the statements as they came in late. The committee subsequently has recommended that the service provider concerned, be not considered again for engagement by the municipality in any future projects.
2.8. SUPPLY CHAIN MANAGEMENT
The supply chain section performed its operations effectively in this financial year. Most contracts that were awarded followed the procedural route.
2.9. BY-LAWS
The Municipality conducted the review of the by-laws in this financial year and some workshops for public participation were conducted.
2.10. WEBSITES
Section 75 of the MFMA enlists the type of documents that should be posted on the municipal website, namely:
The annual and adjustments budgets, all budget-related documents and policies The annual report
All performance agreements for section 54A/56 managers All service delivery agreements;
All long-term borrowing contracts;
All supply chain management contracts above a prescribed value
An information statement containing a list of assets over a prescribed value that have been disposed of
Contracts having future budgetary implications
Public-private partnership agreements listed in section 120 of the MFMA
19 | P a g e All quarterly reports tabled in the council in terms of section 52 (d) of the MFMA
Any other documents that are prescribed to be placed on the website in terms of the MFMA or other applicable legislation
uPhongolo Municipality has drafted policies that will ensure full compliance with the requirement of section 75 of the MFMA. As such in this financial year this requirement was complied with fully.
2.11. PUBLIC SATISFACTION ON MUNICIPAL SERVICES
The Municipality is in the process of establishing a desk/book where members of the community will give us feedback by rating their experience with the municipality. Such a book will also provide insight on what other improvements we can work on. Once this is established the municipality will be able to establish public satisfaction with our services.
2.12. ALL MUNICIPAL OVERSIGHT COMMITTEES
All the oversight committees are in place and met regularly as per their scheduling. These are MPAC, Risk Committee, and Audit Committee.
20 | P a g e
Chapter 3: Service Delivery Performance (Performance Report Part I)
uPhongolo Local Municipality has five service departments namely the Municipal Manager’s office, Finance Department, Technical department, Community Services Department and the Corporate Services department. This chapter will focus on service delivered on a service-by- service basis. The Corporate services section will be dealt with in more detail in chapter 4 while more details on the financial performance will be attended to in chapter 5.
The methodology applied here will be tracing the IDP objectives by key performance areas (community needs and resource deployment) for 2013/14 from vote all the way through to current status highlighting performance attained on those objectives.
3.1 Executive Summary Municipal Performance
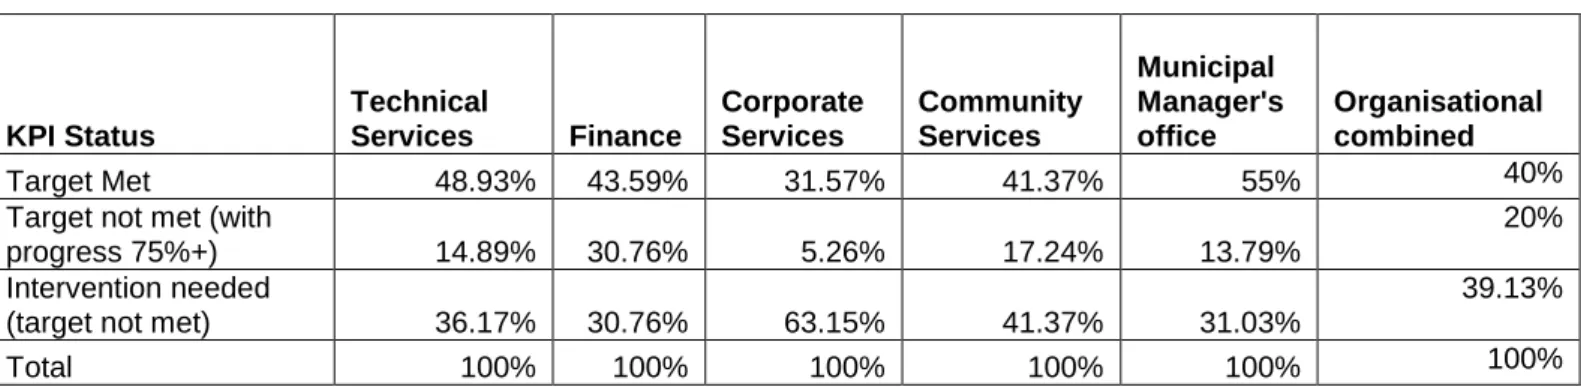
Table 1.3 below rates service provision by the Municipality in terms of the IDP translated to SDBIP. As the table below shows the departmental performances were below average with the exception of the Municipal manager’s office that achieved 55% of their targets for the year.
The least performing department was Community which only managed to fulfill 41.37% of their mandates as prescribed from the SDBIP. Corporate services underperformed with the highest intervention needed figure of 63.15%. The intervention needed figure represents target not met which is however a critical component of the department’s KPAs.
Overall the Municipality achieved a 40% achievement on the mandate with objectives in progress at 39.13% for the 2013/14 financial year for the Municipality as a whole.
3.2 The main challenges to performance were;
Shortage of staff about four middle managers are running their units alone
Funding challenges
Additional objectives (this financial year had revised targets which were not complimented by increased staff
Review of MIG projects from original IDP which resulted in delays in project registration and implementation
21 | P a g e
Inclement weather (rain was a consistent source of delay, raising the water table)
Underground Eskom, Telkom and Zululand district water lines that were not on the map.
This resulted in a redo of the whole plan to avoid the lines.
3.3 Management action to Improve performance;
Update of underground services on our GPS services
Plan a year ahead for projects and finalise SCM processes a year ahead
Filling of critical vacancies
Capacitate SCM staff and the hiring of SCM Manager Table 1.3: Performance Results 2013/14
KPI Status
Technical
Services Finance
Corporate Services
Community Services
Municipal Manager's office
Organisational combined
Target Met 48.93% 43.59% 31.57% 41.37% 55% 40%
Target not met (with
progress 75%+) 14.89% 30.76% 5.26% 17.24% 13.79%
20%
Intervention needed
(target not met) 36.17% 30.76% 63.15% 41.37% 31.03%
39.13%
Total 100% 100% 100% 100% 100% 100%
The performance has regressed as is below last year’s performance as evidenced by the Table 1.4 below but this may be due to additional objectives and lack of staff.
Table 1.4 Performance Results 2012/13
KPI Status
Technical
Services Finance
Corporate Services
Community Services
Municipal Manager's office
Organisational combined
Target Met 43% 79% 53% 67% 80% 56%
Target not met (with
progress less 75%) 57% 21% 47% 33% 20% 44%
Intervention needed
(target not met) 0% 0% 0% 0% 0% 0%
Total 100% 100% 100% 100% 100% 100%
22 | P a g e Graph 01: uPhongolo Municipality Annual Performance
Graphic illustration 02: uPhongolo Municipality Annual Performance 2012/13
0%
20%
40%
60%
80%
100%
120%
Technical Services Finance Corporate Services Community Services Municipal Manager's office
Uphongolo Municipality performance 2013/14
Target Met Target not met (with progress 75% +) Intervention needed (target not met) Total
0%
20%
40%
60%
80%
100%
120%
Technical Services Finance Corporate Services Community
Services Municipal
Manager's office Organisational combined uPhongolo Municipality Perfomance 2012/13
Target Met Target not met (with progress less 75%) Intervention needed (target not met) Total
23 | P a g e The illustration shows that the Municipality suffered an overall 16% drop in its execution of set targets, from a healthy 56% overall to 40% this year. Notable performance challenges were recorded in most departments including finance which dropped by 35% from fulfilling 79% of its targets in 2012/13 to only managing 44% in the 2013/14 financial year. This decline is also attributable to the high vacancy rate in the department, to illustrate the posts of Supply chain manager, budget officer amongst others remain vacant almost a year after being vacant. The technical department continued to toil under staff shortages only managing 49% of their given mandate which is a 5% achievement from the previous year. Community services have got a new head and are going through a normal teething period before performance can be greatly enhanced. It also had a big drop in performance from a healthy 67% to a lowly 41.37%
achievement.
24 | P a g e
3.4 Organisational Scorecard
Org. REF. NKPA Goal Strategic Link Org. REF. Strategi
c Objecti
ve Department Demand Baseline Outcome 9 Output
Key Performance
Indicator/Target/Budget/Actua
l 2013/2014
De scr .
Qu art er
1 Quar
ter 2 Quar
ter 3 Quart er 1
Annual
Planned measure to Improve Performa nce (1
Jul y- 30 Sep t)
(1 Oct- 31 Dec)
(1 Jan- 31 Marc h)
(1 April- 30
June) Targe
t Actu
al
O r g.
1
A. MUNICIPAL INSTITUTIONAL TRANSFORMATION & ORGANISATION DEVELOPMENT 1. To increase organization capacity by 10% each year A1 A1.1
To review and implem ent a credibl e third generat ion IDP.
TECH 100% 100% Implement a differential approach to Municipal Financing, planning and support
KP I
% of IDP review process plan activities completed according to the set time
100% 100
%
Target Achieved - All Phases of the process plan complete d
Ta rg et 10
0% 100
% 100
% 100%
Ac tu al
10 0%
100
%
100
% 100%
Bu dg et
Ori gin al
R 100,
000 Adju
sted 20000 0
O r g.
2 A2 A2.1 To implem ent a complia nt PMS cascade d down to all levels.
MM & COMM/CORP 2013/14 S56 Managers only
KP I
Date PMS implemented and cascaded down to top 3 post levels
30- Jun-
14 -
Standard template to be designed and used for assessing middle managem ent performa nce based on job descripti on.
Ta rg
et - - -
30- Jun- 14 Ac
tu
al - - - -
Bu dg et
Ori gin al
R 200,
000 Adju sted 0 O
r g.
3 A2 A2.2 To implem ent a
complia MM 6 5
KP I
No. of performance agreements signed and aligned for filled S54/56 posts
5 4
MEC approval received after year
25 | P a g e nt PMS
cascade d down to all levels.
Ta rg
et 5 5 5 5
end. HOD Corporat e Service to
formally start work in Quarter 1 of
2014/15 Ac
tu
al 4 3 4 4
Bu dg et
Ori gin al
R32 000 000
Adju sted
O r g.
4 A3 A3.1 To employ and develop a highly effectiv e workfo rce which is represe ntative of the Munici palities demogr aphic
profile. CORP 5 4
KP I
No of people from
Employment Equity target groups employed in top 5 posts (top 3 mng levels)
1 Black Femal e
-
Appoint ment of Black Female in the post of HOD Corporat e Service made but assumpti on of duties to be in Quarter 1 of
2014/14 Ta
rg
et - -
1 Blac k Fem ale - Ac
tu
al - - - -
Bu dg et
Ori gin al
R 30,4
28 Adju sted
O r g.
5 A3 A3.2 To employ and develop a highly effectiv e workfo rce which is represe ntative of the Munici palities demogr aphic
profile. CORP 100%
KP
I % of the skills
development budget spent
95%-
100% 106
% Target exceeded Ta
rg et
20
%- 25
%
45%- 50%
70%
- 75%
95%- 100%
Ac tu al
24
% 39% 110
% 106%
Bu dg et
Ori gin al
R 422,
400 Adju
sted 42240 0
26 | P a g e O
r g.
6 A3 A3.3 To employ and develop a highly effectiv e workfo rce which is represe ntative of the Munici palities demogr aphic
profile. CORP 30
KP I
No. of employees trained according to the skills development plan
40 60 Target exceeded Ta
rg
et 10 10 10 10 Ac
tu
al 7 7 34 12
Bu dg et
Ori gin al
R 422,
400 Adju
sted 42240 0
O r g.
7 A3 A3.4 To employ and develop a highly effectiv e workfo rce which is represe ntative of the Munici palities demogr aphic
profile. CORP 100%
KP I
No. of prioritized posts filled
32 9
Organogr am reviewed and prioritisa tion of post to be made for impleme ntation from Quarter 1 of
2014/15 Ta
rg
et 6 8 10 8
Ac tu
al 0 7 2 0
Bu dg et
Ori gin al
R 35,5 46,5
23 Adju
sted 37526 422
O r g.
A. MUNICIPAL INSTITUTIONAL TRANSFORMATION & 8 ORGANISATION DEVELOPMENT1. To increase organization capacity by 10% each year A4 A4.1
To provide sufficie nt and effectiv e
support service s for all
Munici CORP Implement a differential 2013/14 approach to Municipal NoneFinancing, planning and support KP
I Date access to information Strategy/Policy developed
30- Jun-
14 -
Appoint ment of HOD Corporat e
Services with improve review the policy Ta
rg
et - - - 30-
Jun Ac
tu
al - - - -
Bu
dg Ori R
100, Adju sted
27 | P a g e pal
operati ons.
et gin
al 000
O r g.
9 A4 A4.2 To provide sufficie nt and effectiv e
support service s for all Munici pal operati
ons. CORP 2013/14 None
KP I
Date Administration enhancement strategy developed
30- Jun-
14 -
Budget provision to be made for the develop ment of the strategy Ta
rg
et - - - 30-
Jun Ac
tu
al - - -
Bu dg et
Ori gin al
R 200,
000 Adju sted
O r g.
1
0 A4 A4.3 To provide sufficie nt and effectiv e
support service s for all Munici pal operati
ons. CORP 0
KP I
No. of standard operating manuals implemented for all support functions
8 0
Budget provision to be made for the develop ment of the operating manuals Ta
rg
et 2 2 2 2
Ac tu
al 0 0 0 0
Bu dg et
Ori gin
al Adju
sted
O r g.
1
1 A4 A4.4 To provide sufficie nt and effectiv e
support service s for all Munici pal operati
ons. CORP Complaint / compliment register None
KP I
Date
complaint/compliment register implemented
30-
Mar -
The designing of the book to be submitte d to SCM for quotation s
Ta rg
et - - 30-
Mar Ac
tu
al - - - -
Bu dg et
Ori gin
al Adju
sted O
r g.
1
2 A4 A4.5 To provide sufficie nt and
effectiv CORP 100% -
KP I
% of litigations attended to within 30 days of
correspondence 80% 100
% Target Achieved Ta
rg 80
% 80% 80% 80%
28 | P a g e e
support service s for all Munici pal operati ons.
et Ac tu al 10
0% 100
% N/A N/A
Bu dg et
Ori gin
al R304 28 Adju
sted
O r g.
1
3 A4 A4.6 To provide sufficie nt and effectiv e
support service s for all Munici pal operati ons.
CORP 4 4
KP I
No of reports sent to COGTA for municipal turnaround strategy implemented
4 3 Reportin
g to be monitore d and Reported to
Council &
EXCO Ta
rg
et 1 1 1 1
Ac tu
al 1 1 1 -
Bu dg et
Ori gin
al Adju
sted
Org. REF. NKPA Goal Strategic Link Org. REF. Strategi
c Objecti
ve Department Demand Baseline Outcome 9 Output
Key Performance
Indicator/Target/Budget 2013/2014
Planned measure to Improve Performa nce De
scr .
Qu art er
1 Quar
ter 2 Quar
ter 3 Quart er 1
Annual
(1 Jul y- 30 Sep t)
(1 Oct- 31 Dec)
(1 Jan- 31 Marc h)
(1 April- 30
June) Targe
t Actu
al
O r g.
1
4 B. NKPA 2: BASIC SERVICES DELIVERY1. To increase access to municipal services by 5% each year B1 B1.1 To increas e the number of househ olds with access to free and
basic TECH 4 0 Improved access to basic services KP I
Number of meetings held with District on the provision of water and Sanitation
4 0
Date of IGR meetings to be requeste d from the District in advance for planning Ta
rg
et 1 1 1 1
Ac tu
al 0 0 0 0
Bu dg Ori
gin Adju
sted
29 | P a g e Munici
pal service s.
et al purpose
O r g.
1
5 B1 B1.2 To increas e the number of househ olds with access to free and basic Munici pal service
s. TECH 1000 housing union built
KP
I Progress in construction of free housing units
Awar d bid
Bids awar ded
Target Achieved Ta
rg
et - -
Bid adve rtise d
Contr actor Bid award ed
Ac tu
al - -
Bid adve rtise d
Contr actor Bid award ed Bu
dg et
Ori gin
al Adju
sted
O r g.
1
6 B1 B1.3 To increas e the number of househ olds with access to free and basic Munici pal service s.
BTO 6600
KP I
Number of households with access to free basic services (electricity and Gel) – in total
6600 3214
A review of
Indigent policy to be done and verificati on and approval of new indigent register to be done in the next financial year Ta
rg et 61
00 6275 642
5 6600 Ac
tu al 32
14 3214 321
4 3214
Bu dg et
Ori gin al
R 2,39 9,97
1 Adju
sted
O r g.
1
7 B1 B1.4 To increas e the number of househ olds with access to free
and COMMUNITY
KP I
% of households with access to free basic services (electricity and Gel).
22.90
% 15%
A review of
Indigent policy to be done and verificati on and approval of new indigent Ta
rg et
21.
20
% 21.8
% 22.3
0% 22.90
% Ac
tu al 15
% 15% 15% 15%
Bu Ori Adju
30 | P a g e basic
Munici pal service s.
dg et gin
al sted register
to be done in the next financial year
O r g.
1
8 B1 B1.5 To increas e the number of househ olds with access to free and basic Munici pal service
s. TECH 100%
KP I
% of Infrastructure maintained according to plan
100% 73% Additiona l Grader to be procured for timely maintena nce of roads Ta
rg et 80
% 85% 90% 100%
Ac tu al
35
% 51% 63% 73%
Bu dg et
Ori gin al
R8 3 00
000 Adju sted
O r g.
1
9 B1 B1.6 To increas e the number of househ olds with access to free and basic Munici pal service
s. TECH 100%
KP I
% of households with access to electricity (basic and above level)
61% 60%
Procure ment of services of
Contracto r to be done before start of budget year.
Delays in construct ion to be fined per contract.
Ta rg et 58
% 59% 60% 61%
Ac tu al 58
% 59% 60% 60%
Bu dg et
Ori gin
al Adju
sted
O r g.
2
0 B1 B1.7 To increas e the number of househ olds with access to free
TECH 3386 810
KP I
Number of households electrified (new
connections)
810 336
Procure ment of services of
Contracto r to be done before start of budget Ta
rg
et 0 168 168 474 Ac
tu
al 0 168 168 0 Bu Ori R14 Adju
31 | P a g e and
basic Munici pal service s.
dg et gin
al 000
000 sted year.
Delays in construct ion to be fined per contract.
O r g.
2 1
1. To increase access to municipal services by 5% each year B1 B1.8
To increas e the number of househ olds with access to free and basic Munici pal service
s. TECH Improved access to basic services
KP
I Number (in Kilometers) of new gravel access road
16 Km 6.12 75 km
Target to be
aligned to
standard cost per KM and project impleme ntation to be
monitore d.
Ta rg
et - -
8
Km 8 Km Ac
tu
al - - 0
6.127 5 km
Bu dg et
Ori gin al
R 1,70 0,00
0 Adju
sted
O r g.
2
2 B1 B1.9 To increas e the number of househ olds with access to free and basic Munici pal service
s. COMM 22112 3500
KP I
Number of households with access to refuse removal at least once per week
4000 3602 New Compact or Truck to be used from Quarter 1 of
2014/15 Ta
rg et 36
25 3750 387
5 4000 Ac
tu al 39
18 3792 360
2 3602
Bu dg et
Ori gin al
Adju sted
O r g.
2
3 B1 B1.10 To increas e the number of househ olds with access
to free COMM 100%
KP I
% of households with access to refuse removal at least once per week
13.90
% 12.5
0%
New Compact or Truck to be used from Quarter 1 of
2014/15 Ta
rg et
12.
60
% 13% 13.5
0% 13.90
% Ac
tu al
13.
60
% 13% 12.5
0% 12.50
% Bu Ori Adju
32 | P a g e and
basic Munici pal service s.
dg et gin
al sted
O r g.
2
4 B1 B1.11 To increas e the number of househ olds with access to free and basic Munici pal service
s. COMM 100% 100%
KP
I % of indigent and pauper burial requests supported
100% 100% Target achieved Ta
rg et 10
0% 100
% 100
% 100%
Ac tu al 10
0% 100
% 100
% 100%
Bu dg et
Ori gin al
R 2 3 000
000 Adju sted
O r g.
2
5 B1 B1.12 To increas e the number of househ olds with access to free and basic Munici pal service
s. TECH 3.1 Km
KP I
Number (in Kilometers) of new tarred road
constructed
3.1
Km 0.5
km Sub- contracti ng to be done to improved project completi on roads.
Ta rg
et - - - 3.1
Km Ac
tu
al - - 0.5
km
Bu dg et
Ori gin
al Adju
sted
O r g.
2
6 B1 B1.13 To increas e the number of househ olds with access
to free TECH 100% 50%
KP I
% spent on capital infrastructure projects (MIG) against Budget
95%-
100% 75%
Project registrati on with MIG and procure ment of contracto rs to be done before Ta
rg et
10
%- 15
% 40%-
45%
70%
-
75% 95%- 100%
Ac tu
al 6% 23% 47% 75%
33 | P a g e and
basic Munici pal service s.
Bu dg et
Ori gin al
R 22 5 00
750 Adju sted
the start of budget year
O r g.
2
7 B2 B2.1 To maintai n and ensure full functio nality of all Munici pal infrastr ucture, facilitie s and ameniti
es. TECH 12 12
KP
I Monthly report on building maintained
12 12
Ta
rg
et 3 3 3 3
Ac tu
al 3 3 3 3 Target
achieved
Bu dg et
Ori gin al
R1 8 00
000 Adju
sted
O r g.
2
8 B2 B2.2 To maintai n and ensure full functio nality of all Munici pal infrastr ucture and facilitie
s. TECH 43km
KP
I Number (in Kilometers) of tarred road maintained
43km 19.9 2 km
Processin g of Material to be done in- house Ta
rg et
10.
75
km 10.7
5 km 10.7
5km 10.75 km Ac
tu al 7.5
km 5.92 km
3.5k
m 3 km
Bu dg et
Ori gin al
R1 1 00
000 Adju sted
Org. REF. NKPA Goal Strategic Link Org. REF. Strategi
c Objecti
ve Department Demand Baseline Outcome 9 Output
Key Performance
Indicator/Target/Budget 2013/2014
Planned measure to Improve Performa nce
Qu art er
1 Quar
ter 2 Quar
ter 3 Quart er 1
Annual
(1 Jul y- 30
(1 Oct- 31 Dec)
(1 Jan- 31 Marc
(1 April- 30
June) Targe
t Actu
al
34 | P a g e Sep
t) h)
O r g.
2 9
B. NKPA 2: BASIC SERVICES DELIVERY 1. To increase access to municipal services by 5% each year B2 B2.3
To maintai n and ensure full functio nality of all Munici pal infrastr ucture and facilitie
s. COMM 16 3 Improved access to basic services
KP
I Number of operational centers and libraries
4 4 Target
Achieved Ta
rg
et 4 4 4 4
Ac tu
al 4 4 4 4
Bu dg et
Ori gin al
R 12,0 00,0
00 Adju sted
O r g.
3
0 B3 B3.1 To support and develop the commu nity toward s reducti on of socio- econom ic challen
ges. COMM 400
KP I
Number of new library members
400 596 Target Achieved Ta
rg et 10
0 100 100 100 Ac
tu
al 97 88 291 120
Bu dg et
Ori gin
al Adju
sted
O r g.
3
1 B3 B3.2 To support and develop the commu nity toward s reducti on of socio- econom ic
challen COMM 48 4
KP I
Number of HIV/AIDS Programmes
implemented/Events held
16 13 A year plan will be develope d and aligned to the budget Ta
rg
et 4 4 4 4
Ac tu
al 1 4 3 5
Bu dg et
Ori gin al
R 700,
000 Adju sted
35 | P a g e ges.
O r g.
3
2 B3 B3.3 To support and develop the commu nity toward s reducti on of socio- econom ic challen
ges. COMM 16 4
KP I
Number of youth, sport and gender Programmes implemented/Events held
16 12 A year plan will be develope d and aligned to the budget Ta
rg
et 4 4 4 4
Ac tu
al 4 5 1 2
Bu dg et
Ori gin al
R1 1 00 000
Adju sted
O r g.
3
3 B3 B3.4 To support and develop the commu nity toward s reducti on of socio- econom ic challen
ges. COMM 16 4
KP I
Number of woman and children Programmes implemented/Events held
16 4 A year plan will be develope d and aligned to the budget Ta
rg
et 4 4 4 4
Ac tu
al 1 3 - -
Bu dg et
Ori gin al
R 750, 000
Adju sted
O r g.
3
4 B3 B3.5 To support and develop the commu nity toward s reducti on of socio- econom ic
challen COMM 16 4
KP I
Number of elderly and disabled persons Programmes
implemented/Events held
16 6 A year
plan will be develope d and aligned to the budget Ta
rg
et 4 4 4 4
Ac tu
al 1 3 1 1
Bu dg et
Ori gin al
R 500,
000 Adju sted
36 | P a g e ges.
O r g.
3
5 B4 B4.1 To ensure commu nity and environ mental safety and security
. TECH 300 -
KP
I Number of building inspections done
300 175
Additiona l
resources to be provided for effective building control activities Ta
rg
et 75 75 75 75 Ac
tu
al 52 24 17 82 Bu
dg et
Ori gin
al Adju
sted
O r g.
3
6 B4 B4.2 To ensure commu nity and environ mental safety and security .
CORP 100% 100%
KP I
% of fully functional traffic and COMM unity safety centers
100% 100
% Target Achieved Ta
rg et 10
0% 100
% 100
% 100%
Ac tu al 10
0% 100
% 100
% 100%
Bu dg et
Ori gin al
R6 6 00
000 Adju sted
Org. REF. NKPA Goal Strategic Link Org. REF. Strategi
c Objecti
ve Department Demand Baseline Outcome 9 Output
Key Performance
Indicator/Target/Budget 2013/2014
Planned measure to Improve Performa nce
Qu art er
1 Quar
ter 2 Quar
ter 3 Quart er 1
Annual
(1 Jul y- 30 Sep t)
(1 Oct- 31 Dec)
(1 Jan- 31 Marc h)
(1 April- 30
June) Targe
t Actu
al
O r g.
3
7 C. NKPA 3: LOCAL ECONOC 1. To boost the Local DEVELOPEMNTeconomy by 5 points each year C1 C1.1 To develop and implem ent the LED and tourism strategi
es. COMM & MM Investment strategy/ Implementation of COMM policy unity works Programme - and supported Cooperatives
KP I
Date investment attraction strategy/
incentive policy adopted and implemented
30-
Jun -
Advert to be re- issued for the develop ment of the Incentive policy Ta
rg
et - - - 30-
Jun Ac
tu
al - - -
37 | P a g e Bu
dg et
Ori gin
al Adju
sted
O r g.
3
8 C1 C1.2 To develop and implem ent the LED and tourism strategi es.
COMM & MM - 1
KP I
Number of new
investments to uPhongolo Municipality
8 2
To intensify the marketin g of Pongola to the investors Ta
rg
et 2 2 2 2
Ac tu
al - - - 2
Bu dg et
Ori gin al
Adju sted
O r g.
3
9 C1 C1.3 To develop and implem ent the LED and tourism strategi es.
COMM - -
KP I
Number of planned LED infrastructure projects completed – COGTA funded
4 1
Project to be
monitore d closely and issuing of penalty/
warning to
contracto r for any delays Ta
rg
et 0 1 1 2
Ac tu
al 0 0 0 1
Bu dg et
Ori gin al
R 14 7 00
000 Adju sted
O r g.
4
0 C1 C1.4 To develop and implem ent the LED and tourism strategi es.
COMM - -
KP I
Number of jobs created through LED initiatives including co-operatives
450 459 Ta
rg
et 70 100 120 160 Target
Achieved Ac
tu
al 79 134 146 100
Bu dg et
Ori gin al
R 1 00 0
000 Adju sted
O
r g.
4
1 C1 C1.5 To develop and implem
ent the COMM - -
KP
I Number of businesses organised/formalised
12 12
Ta
rg
et 3 3 3 3
Target Achieved
38 | P a g e LED
and tourism strategi es.
Ac tu
al 3 8 1 0
Bu dg et
Ori gin
al Adju
sted
O r g.
4
2 C1 C1.6 To develop and implem ent the LED and tourism strategi es.
COMM Tourism Strategy -
KP I
Date tourism and enhancement strategy developed and adopted
30- Jun
Draft
@ 30 June
Tourism Strategy to be submitte d to Council for approval in
Quarter 1 of
2014/15 Ta
rg
et - - - 30-
Jun Ac
tu
al - -
Draft
@ 30 June Bu
dg et
Ori gin al
R 1 39 1
881 Adju sted
O r g.
4
3 C2 C2.1 To increas e efforts of support ing the Busines ses, SMME’s and Cooper
atives. COMM - -
KP I
Number of Co-ops members and SMME’s employees/owners trained
370 507 Ta
rg et 10
0
150 70
50
Target Achieved Ac
tu al 10
4 258 77 68
Bu dg et
Ori gin al
R 544,
000 Adju sted
O r g.
4
4 C3 C3.1 To increas e LED capacit y and Govern ance.
COMM - -
KP I
Number of business seminars and summits coordinated
2 2 Target
Achieved Ta
rg
et 0 0 1 1
Ac tu
al - - 1 1
Bu dg et
Ori gin al
R 1 00 0
000 Adju sted
Or g. RE F.NK PAGo alStr ate gic Lin k Or g. RE F. StrategiDe pa rt me ntDe ma ndBa sel ineOu tco me 9 Ou tp ut Key Performance 2013/2014 Planned
39 | P a g e c
Objecti ve
Indicator/Target/Budget measure
to Improve Performa nce
Qu art er
1 Quar
ter 2 Quar
ter 3 Quart er 1
Annual
(1 Jul y- 30 Sep t)
(1 Oct- 31 Dec)
(1 Jan- 31 Marc h)
(1 April- 30
June) Targe
t Actu
al
O r g.
4 5
D. NKPA 4: FINANCIAL VIABILITY AND MANAGEMENT To Increas