IMBABAZANE LOCAL MUNICIPALITY
MEDIUM TERM REVENUE &
EXPENDITURE
FRAMEWORK 2013/14 FINANCIAL YEAR
Contact details:
Ilze Baron
National Treasury Tel: (012) 395-6742
Electronic submissions: [email protected] Version 2.5
Click for Instructions!
Copies of this document can be viewed:
1. In the foyers of all municipal buildings 2. All public libraries within the municipality
3. At www.imbabazane.gov.za
2020
MTREF Range:
Name Votes & Sub-Votes Preparation Instructions
Printing Instructions Municipality Name:
Budget for MTREF starting: Budget Year:
Does this municipality have Entities?
If YES: Identify type of report:
CFO Name:
Tel:
E-Mail:
Fax:
Showing / Hiding Columns
Showing / Clearing Highlights
S I DUBE 0363530691
[email protected]
0363536661
Hide Reference columns on all sheets Show Pre-audit columns on all sheets
Clear Highlights on all sheets
Important documents which provide essential assistance MFMA Budget Circulars
Dummy Budget Guide MBRR Budget Formats Guide
Funding Compliance Guide MFMA Return Forms
Click to view
Click to view Click to view Click to view
Click to view
1. Table of Contents
1. Table of Contents ... 2
2. Mayor’s Report………..7
3. Executive Summary………9
List of Tables Table 1 Consolidated Overview of the 2013/14 MTREF ... 8
Table 17 MBRR Table A1 - Budget Summary ... 11
Table 18 MBRR Table A2 - Budgeted Financial Performance (revenue and expenditure by standard classification) 13 Table 19 MBRR Table A3 - Budgeted Financial Performance (revenue and expenditure by municipal vote) .. 14
Table 21 MBRR Table A4 - Budgeted Financial Performance (revenue and expenditure) ... 15
Table 22 MBRR Table A5 - Budgeted Capital Expenditure by vote, standard classification and funding source18 Table 23 MBRR Table A6 - Budgeted Financial Position... 20
Table 24 MBRR Table A7 - Budgeted Cash Flow Statement ... 22
Table 25 MBRR Table A8 - Cash Backed Reserves/Accumulated Surplus Reconciliation ... 23
Table 26 MBRR Table A9 - Asset Management ... 24
Table 27 MBRR Table A10 - Basic Service Delivery Measurement ... 26
Abbreviations and Acronyms
ASGISA Accelerated and Shared Growth Initiative BPC Budget Planning Committee
CBD Central Business District CFO Chief Financial Officer CM Municipality Manager CPI Consumer Price Index
CRRF Capital Replacement Reserve Fund DBSA Development Bank of South Africa DoRA Division of Revenue Act
EE Employment Equity FBS Free basic services
GAMAP Generally Accepted Municipal Accounting Practice
GDP Gross domestic product
GFS Government Financial Statistics
GRAP General Recognised Accounting Practice HR Human Resources
HSRC Human Science Research Council IDP Integrated Development Strategy IT Information Technology
km kilometre
KPA Key Performance Area KPI Key Performance Indicator LED Local Economic Development MEC Member of the Executive Committee
MFMA Municipal Financial Management Act Programme
MIG Municipal Infrastructure Grant MMC Member of Mayoral Committee MPRA Municipal Properties Rates Act MSA Municipal Systems Act
MTEF Medium-term Expenditure Framework MTREF Medium-term Revenue and Expenditure
Framework
NGO Non-Governmental organisations NKPIs National Key Performance Indicators OHS Occupational Health and Safety OP Operational Plan
PBO Public Benefit Organisations PHC Provincial Health Care
PMS Performance Management System PPE Property Plant and Equipment PPP Public Private Partnership
PTIS Public Transport Infrastructure System RG Restructuring Grant
RSC Regional Services Council
SALGA South African Local Government Association SAPS South African Police Service
SDBIP Service Delivery Budget Implementation Plan
SMME Small Micro and Medium Enterprises
2 Part 1 – Annual Budget
Mayor’s Report PURPOSE
For honourable councillors to consider the approval of Imbabazane Local Municipality final budget for 2013-2014 financial year and two subsequent years.
Background
Honourable councillors will recall that, in August31, 2012, a budget process plan was
tabled and adopted by this council as per section 21(a) and (b) of the Municipal finance Management Act 56 of 2003.
On 28
thMarch, council tabled Draft budget 2013-2014 for public participation. Public participation meetings will be held; date and areas will be confirmed, an additional amount to the local government equitable share to meet the rising costs of providing municipal services and to help rural municipalities,
Local government allocations receive additional funds to address among others:
Compensate for the rising costs of providing free basic electricity to poor households;
Accelerate provision of access to electricity and improving the sustainability of access through the refurbishment of key infrastructure;
Expand the collection and use of data on the condition of municipal roads;
Increasing the number of interns with infrastructure-related skills working in municipalities
Greater need for social and economic interventions.
Enhanced communication channels with the community on service delivery,
Job creation and upliftment of skills within the municipality.
In order to address the above, changes were made to the initial budget to accommodate the above in spite of limited financial resources.
Section 24 of MFMA requires the Municipal Council to at least 90 days before the start of the financial year consider approval of the annual budget. Contents of the annual budget are clearly outlined on section (16) of the MFMA.
Budget assumptions
This budget was prepared with the assumption that CPI inflation headline will not exceed 5.6% estimate as
indicated in the national treasury budget circular 67, draft were made to accommodate various internal factors,
e.g. the rate of indigence.
3
The Salary and Wage Collective agreement 2012/13 to 2014/2015 has been taken into account. The in availability of other information from the South African Local Government Bargaining Council has led to us budgeting for 1.25% cost of living increase adjustment and will be implemented with effect from July 2012.
Budget policy principles
Budget has been compiled to align with the I.D.P. and the national government key objectives, viz, Protect the poor, Build capacity for long term growth, Sustained employment growth, maintenance of sustainable debt level and additionally, address some socio economic needs of our communities.
3. Other issues
This Municipal Budget has been prescribed by MFMA Circular 67 and specifically for 2013-2014 Medium Term Revenue and expenditure Framework.
The application of sound financial management principles for the compilation of the Municipality financial plan is essential and critical to ensure that the Municipality remains financially viable and that sustainable municipal services are provided economically and equitably to all communities.
Tariff-setting is a pivotal and strategic part of the compilation of any budget. When rates and tariffs were revised, local economic conditions, input costs and the affordability of services were taken into account to ensure the financial sustainability of the Municipality.
National Treasury continues to encourage municipalities to keep increases in rates and tariffs as low as possible.
Municipalities must justify in their budget documentation all increases in excess of the 6 per cent upper boundary of the South African Reserve Bank’s inflation target. Excessive increases are likely to be counterproductive, resulting in higher levels of non-payment.
It must also be appreciated that the consumer price index, as measured by CPI, is not a good measure of the cost increases of goods and services relevant to municipalities. Within this framework the Municipality has undertaken the tariff setting process relating to service charges as follows.
____________________________________
Honourable Mayor
Mrs P G Strydom
4 Executive Summary
The Municipality service delivery priorities were reviewed as part of this year’s planning and budget process. Where appropriate, funds were transferred from low- to high-priority programmes so as to maintain sound financial stewardship.
The Municipality has embarked on implementing a range of revenue collection strategies to optimize the collection of debt owed by consumers. Furthermore, the Municipality has undertaken various customer care initiatives to ensure the municipality truly involves all citizens in the process of ensuring a people lead government.
National Treasury’s MFMA Circular No. 67 has been used to guide the compilation of the 2013/14 MTREF.
The main challenges experienced during the compilation of the 2013/14 MTREF can be summarised as follows:
The need to reprioritise projects and expenditure within the existing resource envelope given the cash flow realities and declining cash position of the municipality;
Wage increases for municipal staff that continue to exceed consumer inflation, as well as the need to fill critical vacancies;
Affordability of capital projects – original allocations had been increase by R 560 thousand to speed up service delivery and the operational expenditure associated with prior year’s capital investments needed to be factored into the budget as part of the 2013/14 MTREF process; and
The following budget principles and guidelines directly informed the compilation of the 2013/14 MTREF:
The 2013/14 Adjustments Budget priorities and targets, as well as the base line allocations contained in that Adjustments Budget were adopted as the upper limits for the new baselines for the 2013/14 annual budget;
Intermediate service level standards were used to inform the measurable objectives, targets and backlog eradication goals;
Tariff and property rate increases should be affordable and should generally not exceed inflation as measured by the CPI. In addition, tariffs need to remain or move towards being cost reflective, and should take into account the need to address infrastructure backlogs;
There will be no budget allocated to national and provincial funded projects unless the necessary grants to the municipality are reflected in the national and provincial budget and have been gazetted as required by the annual Division of Revenue Act;
1.1 Zero-based Budgeting
The budget has been compiled from “Base-zero” that is, without reference to the previous year’s
budget. Priorities have been established as new.
5 1.2 Resource Support Services.
Salaries and Wages Provision
Provision of 6.85% for salaries and wages has been provided and a total amount of 24 307 820 has been allocated for staff. R6 600 075.00 for Councillor Allowances has been allocated in this draft budget. Refer to A1 table on the attached budget document.
1.3 Organogram
An organogram of the Council has been changed and vacant positions have also been catered for, in this budget.
1.4 Equitable Share
Provision has been made for an amount of R68 921 000 being Equitable Share funding and the income of R40 794 260.00 will be derived from the following sources.
Rates income R 7 050 000.00
Interest on Investment R 1 170 000.00
Housing roll over R 7 000 000.00
Rent Income R 104 260.00
Income on sale of tender documents R 50 000.00 Financial Management Grant R 1 650 000.00
MSIG R 890 000.00
MIG/ infrastructure grant R 21 523 000.00
Library grant R 777 000.00
Traffic Fines R 20 000.00
Interest Received R 150 000.00
Business Licence R 1 000.00 Interest on outstanding debt R 3 000.00 Library copies R 6 000.00 Gain on disposal of assets R 200 000.00
Cogta – IDP R 200 000.00
6
1.5 Expenditure
1.5.1 Salaries, Wages and Allowances
As previously stated, 6.85% increase has been allowed in the budget. An amount of R30 907 000.00 is budgeted for salaries for staff and includes councillor allowances. Provision has also been made for filling of vacant positions.
1.5.2. General Expenses
An average adjustment based on the “Zero-based” concept has been made with regard to general expenses.
An amount of R32 194 000 .00 is budgeted for general expenses.
1.5.3. Maintenance and Repairs
An average adjustment based on the “zero-base” concept has been made with regard to maintenance and repairs,
R3 486 200.00 is budgeted for maintenance and repairs.
1.5.4. Capital Projects
An amount of R26 163 000.00 has been budgeted for capital projects, the spending of these allocations in the old financial years has been excellent. Please refer to table A5 Capex.
7 2 Property rates Tariffs
Below are the Categories and their proposed tariffs percentages.
Agriculture 0.0017
Agricultural small holdings 0.0017
State owned 0.02000
Public service infrastructure 0.00500
Multi use Purpose 0.00350
Communal land 0.00350
Communal Land Association 0.00350
Commercial 0.00500
Industrial 0.00500
4. Other issues
This Municipal Budget has been prescribed by MFMA Circular 67 and specifically for 2013-2014 Medium Term Revenue and expenditure Framework.
Table A1 – Budget Summary.
Table A2 – Budget Financial Performance (standard Classifications).
Table A3 – Budget Financial Performance (Municipal Votes).
Table A4 – Budget Financial Performance (Revenue and Expenditure).
Table A5 –Capital Budget.
Table A6 –Financial Position.
Table A7 –Cash Flow Statement.
Table A8 –Cash Backed Reserves.
Table A9—Asset Management.
Table A10—Basic Service Delivery Measurement.
Table SA18 – Transfer and Grant
Table SA22—Summary Councillor and Staff benefits
Table SA23—Summary Councillors and Senior Managers
8 Consolidated overview
In view of the aforementioned, the following table is a consolidated overview of the proposed 2013/14 Medium- term Revenue and Expenditure Framework:
Table 1 Consolidated Overview of the 2013/14 MTREF
R thousand Adjustment Budget
2013/14
Budget Year 2013/14
Budget Year +1 2014/2015
Budget Year + 2 2015/16 Total operating Revenue
75,861
88,193
91,513
103,446 Total operating expenditure
71,488
80,005
80,031
83,910 Surplus / (Deficit) for the year before
capital allocation
4,373 8,188 11,482 19,536
Capital allocation
20,963 21,523 22,800 24,181
Surplus/(Deficit) for the year after capital allocation
25,336 29,711 34,282 43,717
Total Capital expenditure
27,972 26,163 26,662 30,248
Total Surplus / (Deficit) for the year
(2,636) 3,548 7,620 13,469
Total operating revenue has grown by 16.25 per cent for the 2013/14 financial year when compared to the 2012/13 Adjustments Budget. For the two outer years, operational revenue will increase by 3.76 and 13.03 per cent respectively, equating to a total revenue growth of R 27 million over the MTREF.
Total operating expenditure for the 2013/14 financial year has been appropriated at R80 million and translates into a budgeted surplus of R8.2 million. When compared to the 2013/14 Adjustments Budget, operational expenditure has grown by 11.9 per cent in the 2013/14 budget and by 0.03 and 4.8 per cent for each of the respective outer years of the MTREF. The operating surplus for the two outer years steadily increases to R31 million. These surpluses will be used to fund capital expenditure and to further ensure cash backing of reserves and funds.
The capital budget of R26.1 million for 2013/14 is 6.5 per cent decrease when compared to the 2013/14 Adjustment Budget. The capital programme is funded by R 21.5 million from Municipal infrastructural Grant and internal generated fund of R 4.6 million. The capital programme budget of 2014/15 is R 26.6 million and 2015/16 is R 30.2 million.
The total surplus of 3,5 million for 2013/14 coming from a deficit of 2,6 million from adjustment budget and further
surplus of two outer years steadily increase to 21 million.
9
Operating Revenue Framework
For Imbabazane local Municipality to continue improving the quality of services provided to its citizens it needs to generate the required revenue. In these tough economic times strong revenue management is fundamental to the financial sustainability of our municipality. The reality is that we are faced with development backlogs and poverty. The expenditure required to address these challenges will inevitably always exceed available funding; hence difficult choices have to be made in relation to tariff increases and balancing expenditures against realistically anticipated revenues.
The municipality’s revenue strategy is built around the following key components:
National Treasury’s guidelines and macroeconomic policy;
Growth in the Municipality and continued economic development;
Efficient revenue management, which aims to ensure a 95 per cent annual collection rate for property rates.
The municipality’s Property Rates Policy approved in terms of the Municipal Property Rates Act, 2004 (Act 6 of 2004) (MPRA);
The municipality’s Indigent Policy and rendering of free basic services; and
Tariff policy of the Municipality.
Operating Expenditure Framework
The Municipality expenditure framework for the 2013/14 budget and MTREF is informed by the following:
The asset renewal strategy and the repairs and maintenance plan;
Balanced budget constraint (operating expenditure should not exceed operating revenue) unless there are existing uncommitted cash-backed reserves to fund any deficit;
Funding of the budget over the medium-term as informed by Section 18 and 19 of the MFMA;
The capital programme is aligned to the asset renewal strategy and backlog eradication plan;
Operational gains and efficiencies will be directed to funding the capital budget and other core services; and
Strict adherence to the principle of no project plans no budget. If there is no business plan no funding
allocation can be made.
10 Annual Budget Tables
The following eighteen pages present the ten main budget tables as required in terms of section 8 of the Municipal Budget
and Reporting Regulations. These tables set out the municipality’s 2013/14 budget and MTREF as approved by the
Council. Each table is accompanied by explanatory notes on the facing page.
11 Table 2 MBRR Table A1 - Budget Summary
Description 2009/10 2010/11 2011/12
R thousands Audited
Outcome
Audited Outcome
Audited Outcome
Original Budget
Adjusted Budget
Full Year Forecast
Budget Year 2013/14
Budget Year +1 2014/15
Budget Year +2 2015/16 Financial Performance
Property rates 1,504 2,851 4,792 6,645 6,596 6,596 7,050 7,436 7,843 Serv ice charges – – – – – – – – – Inv estment rev enue 1,117 1,052 990 815 1,015 1,015 1,170 1,232 1,297 Transfers recognised - operational 37,946 49,694 66,003 69,201 67,765 67,765 79,438 82,498 93,945 Other ow n rev enue 446 205 547 295 485 485 535 347 361 Total Revenue (excluding capital transfers
and contributions)
41,013
53,802 72,331 76,956 75,861 75,861 88,193 91,513 103,446
Employ ee costs 10,756 12,896 13,692 19,833 20,841 20,841 24,307 25,705 27,197 Remuneration of councillors 4,123 4,246 5,563 6,168 6,168 6,168 6,600 6,958 7,340 Depreciation & asset impairment 3,427 4,405 4,891 7,000 6,500 6,500 6,585 6,834 7,159 Finance charges 64 31 29 – 46 46 70 74 78 Materials and bulk purchases 2,947 2,307 2,647 5,730 4,120 4,120 3,486 3,750 3,907 Transfers and grants 4,134 5,034 2,156 – 3,000 3,000 3,500 3,689 3,888 Other ex penditure 23,774 18,977 28,539 26,475 30,813 30,813 35,458 33,021 34,340 Total Expenditure 49,226 47,896 57,517 65,206 71,488 71,488 80,005 80,031 83,910 Surplus/(Deficit) (8,213) 5,906 14,814 11,750 4,373 4,373 8,188 11,483 19,536 Transfers recognised - capital 8,360 10,477 17,180 – 20,963 20,963 21,523 22,800 24,181 Contributions recognised - capital & contributed assets – – – – – – – – – Surplus/(Deficit) after capital transfers &
contributions
147
16,384 31,994 11,750 25,336 25,336 29,711 34,283 43,717
Share of surplus/ (deficit) of associate – – – – – – – – – Surplus/(Deficit) for the year 147 16,384 31,994 11,750 25,336 25,336 29,711 34,283 43,717 Capital expenditure & funds sources
Capital expenditure 10,368 12,865 18,479 41,468 27,972 27,972 26,163 26,662 30,248 Transfers recognised - capital 8,360 11,065 15,585 30,963 20,963 20,963 21,523 22,800 24,181 Public contributions & donations – – 236 – – – – – – Borrow ing – – – – – – – – – Internally generated funds 2,008 1,800 2,658 10,505 7,009 7,009 4,640 3,862 6,067 Total sources of capital funds 10,368 12,865 18,479 41,468 27,972 27,972 26,163 26,662 30,248 Financial position
Total current assets 33,217 30,291 47,737 32,741 38,457 38,457 45,583 54,612 69,825 Total non current assets 36,559 52,339 65,929 86,678 87,236 87,236 106,814 126,741 149,729 Total current liabilities 29,321 22,846 21,954 7,609 17,609 17,609 10,520 5,430 400 Total non current liabilities 1,118 1,082 1,686 2,302 2,302 2,302 1,666 1,697 1,730 Community w ealth/Equity 39,337 58,703 90,026 109,509 105,783 105,783 140,210 174,226 217,424 Cash flows
Net cash from (used) operating 11,598 16,205 35,193 32,092 30,672 30,672 30,137 36,338 45,607 Net cash from (used) inv esting 2,494 (29,686) (13,299) (41,468) (52,822) (52,822) (25,963) (26,662) (30,248) Net cash from (used) financing 1,631 (119) (48) – – – (96) (96) (96) Cash/cash equivalents at the year end 23,687 10,088 31,935 12,249 9,785 9,785 13,863 23,442 38,705 Cash backing/surplus reconciliation
Cash and inv estments av ailable 28,687 25,088 41,935 27,249 34,785 34,785 43,863 53,442 68,705 Application of cash and inv estments 26,140 18,763 21,014 2,888 14,474 14,474 9,964 5,242 301 Balance - surplus (shortfall) 2,547 6,325 20,921 24,361 20,312 20,312 33,899 48,200 68,404 Asset management
Asset register summary (WDV) 37,197 52,339 65,873 86,678 86,678 86,678 106,814 126,741 149,729 Depreciation & asset impairment 3,427 4,405 4,891 7,000 6,500 6,500 6,585 6,834 7,159 Renew al of Ex isting Assets – – – 19,403 13,103 13,103 11,782 12,061 13,039 Repairs and Maintenance 2,947 2,307 2,647 5,730 4,120 4,120 3,486 3,750 3,906 Free services
Cost of Free Basic Serv ices prov ided 4,134 5,034 2,156 – 3,000 3,000 3,500 3,689 3,888 Rev enue cost of free serv ices prov ided 4,134 5,034 2,156 – 3,000 3,000 3,500 3,689 3,888 Households below minimum service level
Water: – – – – – – – – – Sanitation/sew erage: – – – – – – – – – Energy : – – – – – – – – – Refuse: – – – – – – – – – 2013/14 Medium Term Revenue &
Expenditure Framework Current Year 2012/13
KZN236 Imbabazane - Table A1 Budget Summary
12 Explanatory notes to MBRR Table A1 - Budget Summary
Table A1 is a budget summary and provides a concise overview of the Municipality budget from all of the major financial perspectives (operating, capital expenditure, financial position, cash flow, and MFMA funding compliance).
The table provides an overview of the amounts approved by Council for operating performance, resources deployed to capital expenditure, financial position, cash and funding compliance, as well as the municipality’s commitment to eliminating basic service delivery backlogs.
Financial management reforms emphasises the importance of the municipal budget being funded. This requires the simultaneous assessment of the Financial Performance, Financial Position and Cash Flow Budgets, along with the Capital Budget. The Budget Summary provides the key information in this regard:
1. The operating surplus/deficit (after Total Expenditure) is positive over the MTREF 2. Capital expenditure is balanced by capital funding sources, of which
1. Transfers recognised is reflected on the Financial Performance Budget;
2. Internally generated funds are financed from a combination of the current operating surplus and accumulated cash-backed surpluses from previous years. The amount is incorporated in the Net cash from investing on the Cash Flow Budget. The fact that the municipality’s cash flow remains positive, and is improving indicates that the necessary cash resources are available to fund the Capital Budget.
The section of Free Services shows that the amount spent on Free Basic Services and the revenue cost of free
services provided by the municipality continues to increase. In addition, the municipality continues to make
progress in addressing service delivery backlogs.
13
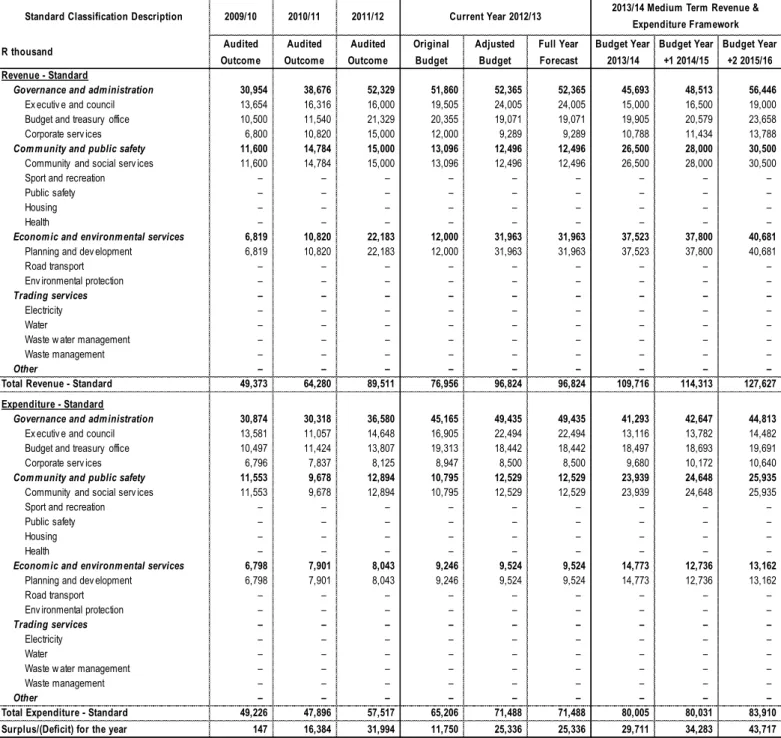
Table 3 MBRR Table A2 - Budgeted Financial Performance (revenue and expenditure by standard classification)
Explanatory notes to MBRR Table A2 - Budgeted Financial Performance (revenue and expenditure by standard classification)
Table A2 is a view of the budgeted financial performance in relation to revenue and expenditure per standard classification. The modified GFS standard classification divides the municipal services into 15 functional areas.
Municipal operating revenue and operating expenditure are then classified in terms if each of these functional areas which enables the National Treasury to compile ‘whole of government’ reports.
KZN236 Imbabazane - Table A2 Budgeted Financial Performance (revenue and expenditure by standard classification)
Standard Classification Description 2009/10 2010/11 2011/12
R thousand Audited
Outcome
Audited Outcome
Audited Outcome
Original Budget
Adjusted Budget
Full Year Forecast
Budget Year 2013/14
Budget Year +1 2014/15
Budget Year +2 2015/16 Revenue - Standard
Governance and administration 30,954 38,676 52,329 51,860 52,365 52,365 45,693 48,513 56,446 Ex ecutiv e and council 13,654 16,316 16,000 19,505 24,005 24,005 15,000 16,500 19,000 Budget and treasury office 10,500 11,540 21,329 20,355 19,071 19,071 19,905 20,579 23,658 Corporate serv ices 6,800 10,820 15,000 12,000 9,289 9,289 10,788 11,434 13,788 Community and public safety 11,600 14,784 15,000 13,096 12,496 12,496 26,500 28,000 30,500 Community and social serv ices 11,600 14,784 15,000 13,096 12,496 12,496 26,500 28,000 30,500 Sport and recreation – – – – – – – – – Public safety – – – – – – – – – Housing – – – – – – – – – Health – – – – – – – – – Economic and environmental services 6,819 10,820 22,183 12,000 31,963 31,963 37,523 37,800 40,681
Planning and dev elopment 6,819 10,820 22,183 12,000 31,963 31,963 37,523 37,800 40,681 Road transport – – – – – – – – – Env ironmental protection – – – – – – – – – Trading services – – – – – – – – – Electricity – – – – – – – – – Water – – – – – – – – – Waste w ater management – – – – – – – – – Waste management – – – – – – – – – Other – – – – – – – – – Total Revenue - Standard 49,373 64,280 89,511 76,956 96,824 96,824 109,716 114,313 127,627 Expenditure - Standard
Governance and administration 30,874 30,318 36,580 45,165 49,435 49,435 41,293 42,647 44,813 Ex ecutiv e and council 13,581 11,057 14,648 16,905 22,494 22,494 13,116 13,782 14,482 Budget and treasury office 10,497 11,424 13,807 19,313 18,442 18,442 18,497 18,693 19,691 Corporate serv ices 6,796 7,837 8,125 8,947 8,500 8,500 9,680 10,172 10,640 Community and public safety 11,553 9,678 12,894 10,795 12,529 12,529 23,939 24,648 25,935 Community and social serv ices 11,553 9,678 12,894 10,795 12,529 12,529 23,939 24,648 25,935 Sport and recreation – – – – – – – – – Public safety – – – – – – – – – Housing – – – – – – – – – Health – – – – – – – – – Economic and environmental services 6,798 7,901 8,043 9,246 9,524 9,524 14,773 12,736 13,162
Planning and dev elopment 6,798 7,901 8,043 9,246 9,524 9,524 14,773 12,736 13,162 Road transport – – – – – – – – – Env ironmental protection – – – – – – – – – Trading services – – – – – – – – – Electricity – – – – – – – – – Water – – – – – – – – – Waste w ater management – – – – – – – – – Waste management – – – – – – – – – Other – – – – – – – – – Total Expenditure - Standard 49,226 47,896 57,517 65,206 71,488 71,488 80,005 80,031 83,910 Surplus/(Deficit) for the year 147 16,384 31,994 11,750 25,336 25,336 29,711 34,283 43,717
Current Year 2012/13 2013/14 Medium Term Revenue &
Expenditure Framework
14 Table 4 MBRR Table A3 - Budgeted Financial Performance (revenue and expenditure by municipal vote)
Explanatory notes to MBRR Table A3 - Budgeted Financial Performance (revenue and expenditure by municipal vote)
Table A3 is a view of the budgeted financial performance in relation to the revenue and expenditure per municipal vote. This table facilitates the view of the budgeted operating performance in relation to the organisational structure of the Municipality. This means it is possible to present the operating surplus or deficit of a vote.
KZN236 Imbabazane - Table A3 Budgeted Financial Performance (revenue and expenditure by municipal vote)
Vote Description 2009/10 2010/11 2011/12
R thousand Audited
Outcome
Audited Outcome
Audited Outcome
Original Budget
Adjusted Budget
Full Year Forecast
Budget Year 2013/14
Budget Year +1 2014/15
Budget Year +2 2015/16 Revenue by Vote
Vote 1 - Municipal Manager 13,654 16,316 16,000 19,505 24,005 24,005 15,000 16,500 19,000 Vote 2 - Admin and Corporate Serv ices 6,800 10,820 15,000 12,000 9,289 9,289 10,788 11,434 13,788 Vote 3 - Budget and Treasury officer 10,500 11,540 21,329 20,355 19,071 19,071 19,905 20,579 23,658 Vote 4 - Technical Serv ices 6,819 10,820 22,183 12,000 31,963 31,963 37,523 37,800 40,681 Vote 5 - Community Serv ices 11,600 14,784 15,000 13,096 12,496 12,496 26,500 28,000 30,500 Vote 6 - Community LED Projects – – – – – – – – – 0 – – – – – – – – – Vote 8 - Low Cost Housing – – – – – – – – – Vote 9 - Electrification – – – – – – – – – Vote 10 - – – – – – – – – – Vote 11 - – – – – – – – – – Vote 12 - – – – – – – – – – Vote 13 - – – – – – – – – – Vote 14 - – – – – – – – – – Vote 15 - – – – – – – – – – Total Revenue by Vote 49,373 64,280 89,511 76,956 96,824 96,824 109,716 114,313 127,627 Expenditure by Vote to be appropriated
Vote 1 - Municipal Manager 13,581 11,057 14,648 16,905 22,494 22,494 13,116 13,782 14,482 Vote 2 - Admin and Corporate Serv ices 6,796 7,837 8,125 8,947 8,500 8,500 9,680 10,172 10,640 Vote 3 - Budget and Treasury officer 10,497 11,424 13,807 19,313 18,442 18,442 18,497 18,693 19,691 Vote 4 - Technical Serv ices 6,798 7,901 8,043 9,246 9,524 9,524 14,773 12,736 13,162 Vote 5 - Community Serv ices 11,553 9,678 12,894 10,795 12,529 12,529 23,939 24,648 25,935 Vote 6 - Community LED Projects – – – – – – – – – 0 – – – – – – – – – Vote 8 - Low Cost Housing – – – – – – – – – Vote 9 - Electrification – – – – – – – – – Vote 10 - – – – – – – – – – Vote 11 - – – – – – – – – – Vote 12 - – – – – – – – – – Vote 13 - – – – – – – – – – Vote 14 - – – – – – – – – – Vote 15 - – – – – – – – – – Total Expenditure by Vote 49,226 47,896 57,517 65,206 71,488 71,488 80,005 80,031 83,910 Surplus/(Deficit) for the year 147 16,384 31,994 11,750 25,336 25,336 29,711 34,283 43,717
Current Year 2012/13 2013/14 Medium Term Revenue &
Expenditure Framework
15 Table 5 MBRR Table A4 - Budgeted Financial Performance (revenue and expenditure)
KZN236 Imbabazane - Table A4 Budgeted Financial Performance (revenue and expenditure)
Description Ref 2009/10 2010/11 2011/12
R thousand 1 Audited
Outcome
Audited Outcome
Audited Outcome
Original Budget
Adjusted Budget
Full Year Forecast
Budget Year 2013/14
Budget Year +1 2014/15
Budget Year +2 2015/16 Revenue By Source
Property rates 2 1,504 2,851 4,792 6,645 6,596 6,596 7,050 7,436 7,843
Property rates - penalties & collection charges – – –
Serv ice charges - electricity rev enue 2 – – – – – – – – – Serv ice charges - w ater rev enue 2 – – – – – – – – – Serv ice charges - sanitation rev enue 2 – – – – – – – – – Serv ice charges - refuse rev enue 2 – – – – – – – – – Serv ice charges - other
Rental of facilities and equipment 74 36 51 113 113 113 104 115 126 Interest earned - ex ternal inv estments 1,117 1,052 990 815 1,015 1,015 1,170 1,232 1,297
Interest earned - outstanding debtors 1 8 3 3 6
Div idends receiv ed
Fines 2 35 20 20 20 21 22
Licences and permits – 1 1 1 1 1
Agency serv ices
Transfers recognised - operational 37,946 49,694 66,003 69,201 67,765 67,765 79,438 82,498 93,945 Other rev enue 2 372 170 285 139 201 201 207 207 205
Gains on disposal of PPE 209 150 150 200
Total Revenue (excluding capital transfers and contributions)
41,013
53,802 72,331 76,956 75,861 75,861 88,193 91,513 103,446
Expenditure By Type
Employ ee related costs 2 10,756 12,896 13,692 19,833 20,841 20,841 24,307 25,705 27,197 Remuneration of councillors 4,123 4,246 5,563 6,168 6,168 6,168 6,600 6,958 7,340
Debt impairment 3 100 100 100
Depreciation & asset impairment 2 3,427 4,405 4,891 7,000 6,500 6,500 6,585 6,834 7,159 Finance charges 64 31 29 46 46 70 74 78 Bulk purchases 2 – – – – – – – – – Other materials 8 2,947 2,307 2,647 5,730 4,120 4,120 3,486 3,750 3,907 Contracted serv ices 2,274 2,973 3,383 3,630 2,630 2,630 3,164 3,423 3,705 Transfers and grants 4,134 5,034 2,156 – 3,000 3,000 3,500 3,689 3,888 Other ex penditure 4, 5 21,500 16,004 25,156 22,845 28,183 28,183 32,194 29,497 30,536 Loss on disposal of PPE
Total Expenditure 49,226 47,896 57,517 65,206 71,488 71,488 80,005 80,031 83,910 Surplus/(Deficit) (8,213) 5,906 14,814 11,750 4,373 4,373 8,188 11,483 19,536 Transfers recognised - capital 8,360 10,477 17,180 – 20,963 20,963 21,523 22,800 24,181 Contributions recognised - capital 6 – – – – – – – – – Contributed assets
Surplus/(Deficit) after capital transfers &
contributions
147
16,384 31,994 11,750 25,336 25,336 29,711 34,283 43,717
Tax ation
Surplus/(Deficit) after taxation 147 16,384 31,994 11,750 25,336 25,336 29,711 34,283 43,717 Attributable to minorities
Surplus/(Deficit) attributable to municipality 147 16,384 31,994 11,750 25,336 25,336 29,711 34,283 43,717 Share of surplus/ (deficit) of associate 7
Surplus/(Deficit) for the year 147 16,384 31,994 11,750 25,336 25,336 29,711 34,283 43,717 2013/14 Medium Term Revenue &
Expenditure Framework Current Year 2012/13
16 Explanatory notes to Table A4 - Budgeted Financial Performance (revenue and expenditure)
Revenue by type
Property rates are the third largest revenue source totalling 7.9 per cent or R7.1 million of the total operation revenue. An increase of 6.9 per cent or R 454 thousand for 2013/14 financial year when compared to the 2013/14 Adjustment budget, as municipality will levy the full amount on property rates, the phasing in period has lapse.
The budget amount of R7.4 million by 2014/15 and R7.8 million 2015/16 financial year. The other source of revenue is rental of facilities and equipment, interest on investment, fines, interest on outstanding debtor, library copies and tender income. Departments have been urged to review the tariffs of these items on an annual basis to ensure they are cost reflective and market related.
Operating grants and transfers forms a first largest revenue source totalling R71,5 million in the 2013/14 financial year and steadily increases to R76.6 million by 2014/15 and R 88.1 million by 2015/16. Note that the operating grants and transfers from national government consist of equitable share, financial management, municipal system improvement and provincial government are department of art and culture and department of cooperative governance and traditional affairs. The following table gives a breakdown of the various operating grants and subsidies allocated to the municipality over the medium term:
Expenditure by type
The budgeted allocation for employee related costs for the 2013/14 financial year totals R24.3 million, which equals 30.4 per cent of the total operating expenditure. A significant increase of employees cost of 16.6 per cent or R3.5 million when compared to the adjustment budget derive from vacancies that need to be filled.
Municipalities must take into account the multi-year Salary and Wage Collective Agreement for the period 1 July 2012 to 30 June 2015. The agreement provides for a wage increase based on the average CPI for the period 1 February 2012 until 31 January 2013, plus 1.25 per cent for the 2013/14 financial year. In this regard municipalities are advised that average CPI for this period is 5.6 per cent. Municipalities are therefore advised to provide for increases related to salaries and wages for the 2013/14 budget year of 6.85 per cent (5.6 per cent plus 1.25 per cent). The agreement also provides for a 1 per cent increase for the 2014/15 financial year. In this regard, municipalities may provide for a 6.4 per cent (5.4 per cent plus 1 per cent) increase for the 2014/15 budget year.
Municipalities are once again reminded to accurately budget for actual positions and vacancies as per the organisational structure of the municipality and notch increments where applicable.
The cost associated with the remuneration of councillors is determined by the Minister of Co-operative
Governance and Traditional Affairs in accordance with the Remuneration of Public Office Bearers Act, 1998 (Act
20 of 1998). The most recent proclamation in this regard has been taken into account in compiling the
Municipality budget R 6.1 million.
17
Provision for depreciation and asset impairment has been informed by the Municipality’s Asset Management Policy. Depreciation is widely considered a proxy for the measurement of the rate asset consumption. Budget appropriations in this regard total R6.6 million for the 2013/14 financial and equates to 8.2 per cent of the total operating expenditure.
In line with the Municipality repairs and maintenance plan this group of expenditure has been prioritised to ensure sustainability of the Municipality infrastructure. For 2013/14 the appropriation against this group of expenditure has been 4.4 per cent which means we under provision of 7 % threshold where necessary will make correction.
Contracted service, as part of the compilation of the 2013/14 MTREF this group of expenditure was critically evaluated and operational efficiencies were enforced. In the 2013/14 financial year, this group of expenditure totals R3.2 million and has been increase by 20.3 per cent.
The social package assists households that are poor or face other circumstances that limit their ability to pay for services. To receive these free services the households are required to register in terms of the Municipality Indigent Policy. The target is to register 27 000 or more indigent households during the 2013/14 financial year, a process will be reviewed annually. Detail relating to free services, cost of free basis services, revenue lost owing to free basic services as well as basic service delivery measurement is contained in Table MBRR A10 (Basic Service Delivery Measurement). The cost of the social package of the registered indigent households is largely financed by national government through the local government equitable share received in terms of the annual Division of Revenue Act.
Other expenditure comprises of various line items relating to the daily operations of the municipality. This group
of expenditure has also been identified as an area in which cost savings and efficiencies can be achieved. Growth
has been 14.2 per cent for 2013/14 and decrease of R2.7 million and slightly increase 0f R1 million for the two
outer years, indicating that significant cost savings have been already realised.
18
Table 6 MBRR Table A5 - Budgeted Capital Expenditure by vote, standard classification and funding source
KZN236 Imbabazane - Table A5 Budgeted Capital Expenditure by vote, standard classification and funding
Vote Description Ref 2009/10 2010/11 2011/12
R thousand 1 Audited
Outcome
Audited Outcome
Audited Outcome
Original Budget
Adjusted Budget
Full Year Forecast
Budget Year 2013/14
Budget Year +1 2014/15
Budget Year +2 2015/16 Capital expenditure - Vote
Multi-year expenditure to be appropriated 2
Vote 1 - Municipal Manager – – – – – – – – – Vote 2 - Admin and Corporate Serv ices – – – – – – – – – Vote 3 - Budget and Treasury officer – – – – – – – – – Vote 4 - Technical Serv ices – – – – – – – – – Vote 5 - Community Serv ices – – – – – – – – – Vote 6 - Community LED Projects – – – – – – – – – Vote 7 - Capital Projects 8,360 11,065 15,584 20,963 20,963 20,963 21,523 22,800 24,181 Vote 8 - Low Cost Housing – – – 10,000 – – – – – Vote 9 - Electrification – – – – – – – – – Vote 10 - – – – – – – – – – Vote 11 - – – – – – – – – – Vote 12 - – – – – – – – – – Vote 13 - – – – – – – – – – Vote 14 - – – – – – – – – – Vote 15 - – – – – – – – – – Capital multi-year expenditure sub-total 7 8,360 11,065 15,584 30,963 20,963 20,963 21,523 22,800 24,181 Single-year expenditure to be appropriated 2
Vote 1 - Municipal Manager – – – – – – – – – Vote 2 - Admin and Corporate Serv ices 195 60 912 1,515 650 650 2,100 832 517 Vote 3 - Budget and Treasury officer – – 743 300 20 20 200 – 1,500 Vote 4 - Technical Serv ices 1,814 1,740 1,239 5,000 6,100 6,100 2,000 3,000 4,000 Vote 5 - Community Serv ices – – – 340 239 239 340 30 50 Vote 6 - Community LED Projects – – – 3,350 – – – – – Vote 7 - Capital Projects – – – – – – – – – Vote 8 - Low Cost Housing – – – – – – – – – Vote 9 - Electrification – – – – – – – – – Vote 10 - – – – – – – – – – Vote 11 - – – – – – – – – – Vote 12 - – – – – – – – – – Vote 13 - – – – – – – – – – Vote 14 - – – – – – – – – – Vote 15 - – – – – – – – – – Capital single-year expenditure sub-total 2,008 1,800 2,894 10,505 7,009 7,009 4,640 3,862 6,067 Total Capital Expenditure - Vote 10,368 12,865 18,479 41,468 27,972 27,972 26,163 26,662 30,248 Capital Expenditure - Standard
Governance and administration 195 60 1,656 5,165 670 670 2,300 832 2,017
Ex ecutiv e and council 3,350
Budget and treasury office – – 743 300 20 20 200 – 1,500 Corporate serv ices 195 60 912 1,515 650 650 2,100 832 517 Community and public safety – 1,347 – 16,537 6,436 6,436 7,185 8,347 9,559 Community and social serv ices – 1,347 – 6,537 6,436 6,436 7,185 5,030 6,050 Sport and recreation – – – – – – – 3,317 3,509 Public safety
Housing 10,000
Health
Economic and environmental services 10,174 11,458 16,823 19,766 20,866 20,866 16,678 17,483 18,672 Planning and dev elopment 1,814 1,740 1,239 5,000 6,100 6,100 2,000 3,000 4,000 Road transport 8,360 9,718 15,584 14,766 14,766 14,766 14,678 14,483 14,672 Env ironmental protection
Trading services – – – – – – – – – Electricity
Water
Waste w ater management Waste management Other
Total Capital Expenditure - Standard 3 10,368 12,865 18,479 41,468 27,972 27,972 26,163 26,662 30,248 Funded by:
National Gov ernment 8,360 11,065 15,585 20,963 20,963 20,963 21,523 22,800 24,181 Prov incial Gov ernment
District Municipality
Other transfers and grants 10,000 – –
Transfers recognised - capital 4 8,360 11,065 15,585 30,963 20,963 20,963 21,523 22,800 24,181
Public contributions & donations 5 236
Borrowing 6
Internally generated funds 2,008 1,800 2,658 10,505 7,009 7,009 4,640 3,862 6,067 Total Capital Funding 7 10,368 12,865 18,479 41,468 27,972 27,972 26,163 26,662 30,248
2013/14 Medium Term Revenue &
Expenditure Framework Current Year 2012/13
19
Explanatory notes to Table A5 - Budgeted Capital Expenditure by vote, standard classification and funding source
Table A5 is a breakdown of the capital programme in relation to capital expenditure by municipal vote (multi- year and single-year appropriations); capital expenditure by standard classification; and the funding sources necessary to fund the capital budget, including information on capital transfers from national and provincial departments.
The MFMA provides that a municipality may approve multi-year or single-year capital budget appropriations.
In relation to multi-year appropriations, for 2013/14 R21.5 million has been allocated of the total R26.2 million capital budget, which totals 82.4 per cent. This allocation escalates to R26.7 million in 2014/15 and to R30.2 million in 2015/16 owing primarily to the fact that various projects reach completion in 2013/14 hence the spike in expenditure in year two.
Single-year capital expenditure has been appropriated at R4.6 million for the 2013/14 financial year and remains relatively constant over the MTREF at levels of R3.9 million and R6.1 million respectively for the two outer years.
Unlike multi-year capital appropriations, single-year appropriations relate to expenditure that will be incurred in the specific budget year such as the procurement of vehicles and specialized tools and equipment.
The budget appropriations for the two outer years are indicative allocations based on the departmental business plans as informed by the IDP and will be reviewed on an annual basis to assess the relevance of the expenditure in relation to the strategic objectives and service delivery imperatives of the Municipality. For the purpose of funding assessment of the MTREF, these appropriations have been included but no commitments will be incurred against single-year appropriations for the two outer-years.
The capital programme is funded from National government and internally generated funds from current year
surpluses. For 2013/14, capital transfers totals R21.5 million (50 per cent) and escalates to R22.8 million and
R24.1 million 2015/16 financial year. Internally generated funding totalling R4.6 million, R3,9 million and
R6,1 million for each of the respective financial years of the MTREF.
20 Table 7 MBRR Table A6 - Budgeted Financial Position
KZN236 Imbabazane - Table A6 Budgeted Financial Position
Description Ref 2009/10 2010/11 2011/12
R thousand Audited
Outcome
Audited Outcome
Audited Outcome
Original Budget
Adjusted Budget
Full Year Forecast
Budget Year 2013/14
Budget Year +1 2014/15
Budget Year +2 2015/16 ASSETS
Current assets
Cash 23,687 10,088 31,935 12,249 9,785 9,785 13,863 23,442 38,705 Call inv estment deposits 1 5,000 15,000 10,000 15,000 25,000 25,000 30,000 30,000 30,000 Consumer debtors 1 1,092 1,080 2,765 2,185 365 365 220 170 150 Other debtors 3,438 4,123 3,037 3,307 3,307 3,307 1,500 1,000 970 Current portion of long-term receiv ables
Inv entory 2
Total current assets 33,217 30,291 47,737 32,741 38,457 38,457 45,583 54,612 69,825 Non current assets
Long-term receiv ables Inv estments
Inv estment property 1,868 1,788 1,708 1,628 1,628 1,628 1,468 1,388 1,308 Inv estment in Associate
Property , plant and equipment 3 34,673 50,538 64,143 85,001 85,559 85,559 105,137 124,966 148,054 Agricultural
Biological
Intangible 18 14 78 50 50 50 209 388 367 Other non-current assets
Total non current assets 36,559 52,339 65,929 86,678 87,236 87,236 106,814 126,741 149,729 TOTAL ASSETS 69,776 82,630 113,666 119,419 125,693 125,693 152,397 181,353 219,554 LIABILITIES
Current liabilities
Bank ov erdraft 1
Borrow ing 4 – – – – – – – – – Consumer deposits
Trade and other pay ables 4 29,202 22,846 21,954 7,609 17,609 17,609 10,520 5,430 400
Prov isions 119
Total current liabilities 29,321 22,846 21,954 7,609 17,609 17,609 10,520 5,430 400 Non current liabilities
Borrow ing – – 532 – – – – – – Prov isions 1,118 1,082 1,154 2,302 2,302 2,302 1,666 1,697 1,730 Total non current liabilities 1,118 1,082 1,686 2,302 2,302 2,302 1,666 1,697 1,730 TOTAL LIABILITIES 30,439 23,928 23,640 9,910 19,910 19,910 12,186 7,127 2,130 NET ASSETS 5 39,337 58,703 90,026 109,509 105,783 105,783 140,210 174,226 217,424 COMMUNITY WEALTH/EQUITY
Accumulated Surplus/(Deficit) 39,337 58,703 90,026 109,509 105,783 105,783 140,210 174,226 217,424 Reserv es 4 – – – – – – – – – Minorities' interests
TOTAL COMMUNITY WEALTH/EQUITY 5 39,337 58,703 90,026 109,509 105,783 105,783 140,210 174,226 217,424 2013/14 Medium Term Revenue &
Expenditure Framework Current Year 2012/13