2018‐2019
2018-2019 TO 2020-2021
MEDIUM TERM REVENUE AND
EXPENDITURE FRAMEWORK
Table of Contents
... 6
PART 1 – ANNUAL DRAFT BUDGET ... 7
1.1 Mayor’s Report ... 7
1.2 Council Resolution ... 12
1.3 EXECUTIVE SUMMARY ... 12
1.3.1 Introduction ... 12
1.3.2 Strategic priorities for 2018‐2019 ... 12
1.3.3 Challenges ... 17
1.3.4 Budget principles and guidelines that directly informed the compilation of the 2018‐2019 draft MTREF ... 18
1.4 Operating Revenue Framework ... 19
1.4.1 Sale of water and impact on tariff increases ... 25
1.4.2 Sale of electricity and impact on tariff increases ... 26
1.4.2 Sanitation and impact on tariff increases ... 26
1.5 Operating Expenditure Framework ... 26
1.6 Capital expenditure ... 30
1.7 Annual Budget tables ... 32
PART 2 – Supporting Documentation ... 42
2.1 Overview of the annual budget process ... 42
2.1.1 Budget Process overview ... 42
2.1.2 Key IDP Processes and Deliverables ... 44
2.1.3 Financial Modeling and Key Planning Drivers ... 44
2.1.4 Community Consultation ... 45
2.2 Overview of alignment of annual budget with Integrated Development Plan... 45
2.2.1 Strategic objectives ... 47
2.3 Measurable performance objectives and indicators ... 52
2.3.1 Performance indicators and benchmarks ... 57
2.3.2 Free Basic Services: basic social services package for indigent households ... 59
2.4 Overview of budget related‐policies ... 60
2.4.2 Supply Chain Management Policy ... 61
2.4.3 Expenditure management policy ... 61
2.4.4 Risk management framework and risk management policy ... 62
2.4.5 Indigent policy ... 62
2.5 Overview of budget assumptions ... 63
2.6 Overview of budget funding ... 65
2.6 Expenditure on grants and reconciliations of unspent funds ... 80
2.7 Councillor and employee benefits 2.9 .. Monthly targets for revenue, expenditure and cash flow... 86
2.10 Annual budgets and SDBIPs – internal departments ... 89
2.11 Contracts having future budgetary implications ... 91
2.12 Capital expenditure details ... 91
2.13 Legislation compliance status ... 99
2.14 Other supporting documents ... 99 2.18 Municipal manager’s quality certificate ... Error! Bookmark not defined.
List of Tables
Table 1: Consolidated Overview of the 2013/14 MTREF ... 18
Table 2: Summary of revenue classified by main revenue source ... 20
Table 3: Operating Transfers and Grant Receipts ... 21
Table 4: Proposed Water Tariffs ... 23
Table 5: Comparison between current sanitation charges and increases ... Error! Bookmark not defined. Table 6: Comparison between water charges and increases (domestic) ... Error! Bookmark not defined. Table 7: Summary of operating expenditure by standard classification item ... 27
Table 8: Capital budget per vote ... 31
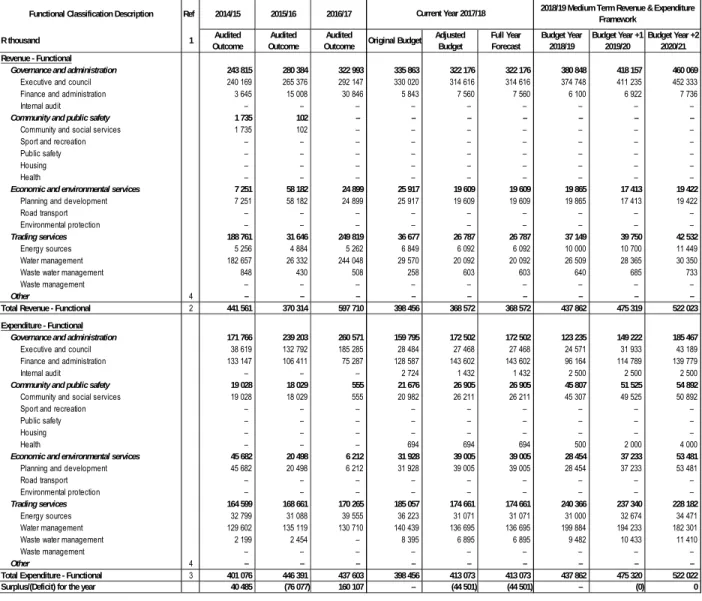
Table 9: Consolidated Annual Budget Summary ... 32
Table 10: Consolidated budget financial performance (Revenue and expenditure by standard classification)... 33
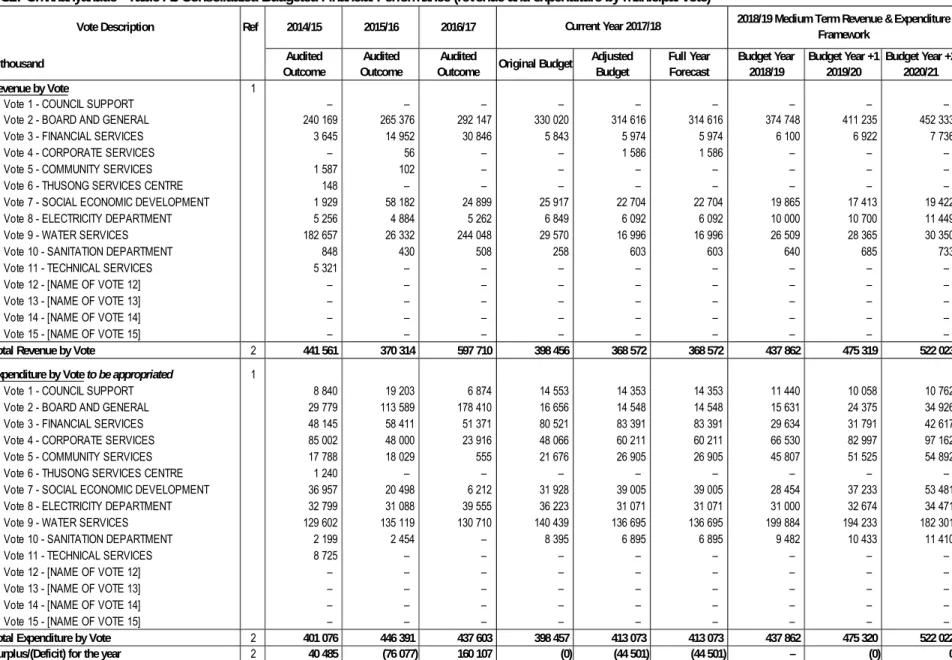
Table 11: Consolidated Budget Financial Performance (revenue and expenditure by municipal vote) .... 34
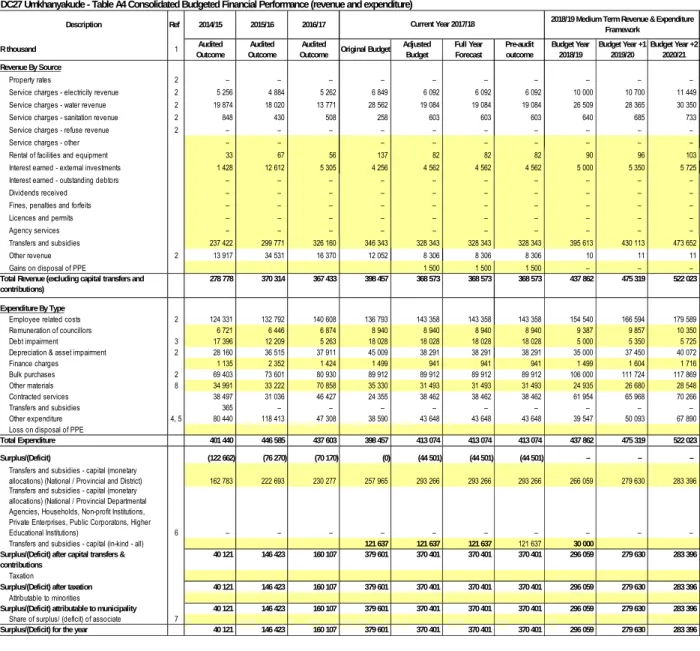
Table 12: Consolidated budgeted financial performance and revenue expenditure ... 35
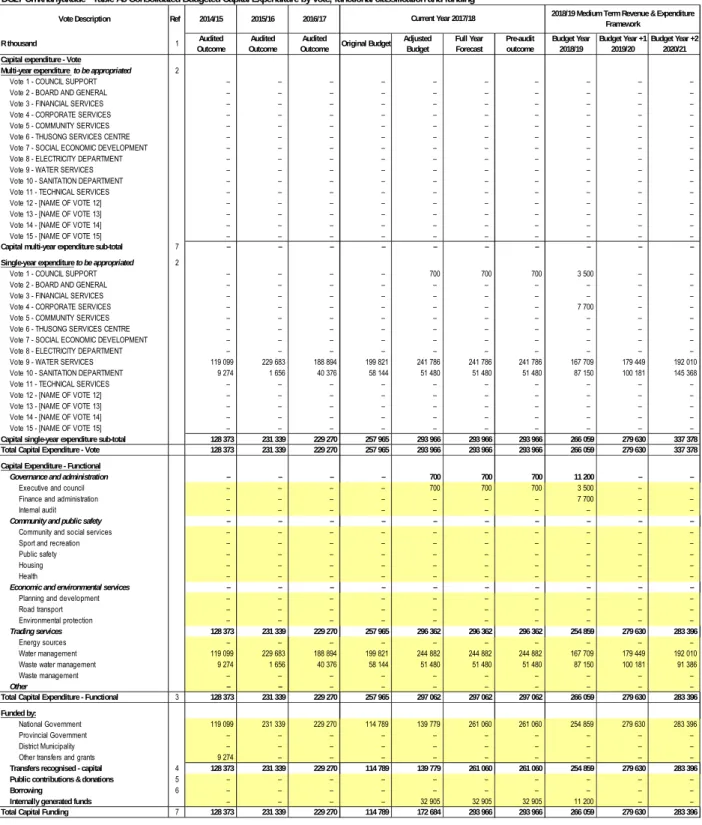
Table 13: Consolidated capital expenditure by vote standard classification and funding ... 36
Table 14: Consolidated budgeted financial position ... 37
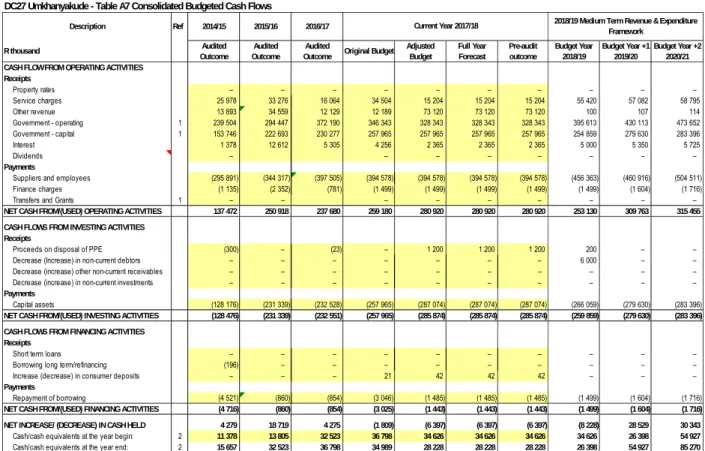
Table 15: Consolidated budgeted cash flow ... 38
Table 16: Consolidated cash backed reserves/accumulated surplus reconciliation ... 38
Table 17: Consolidated assets management ... 38
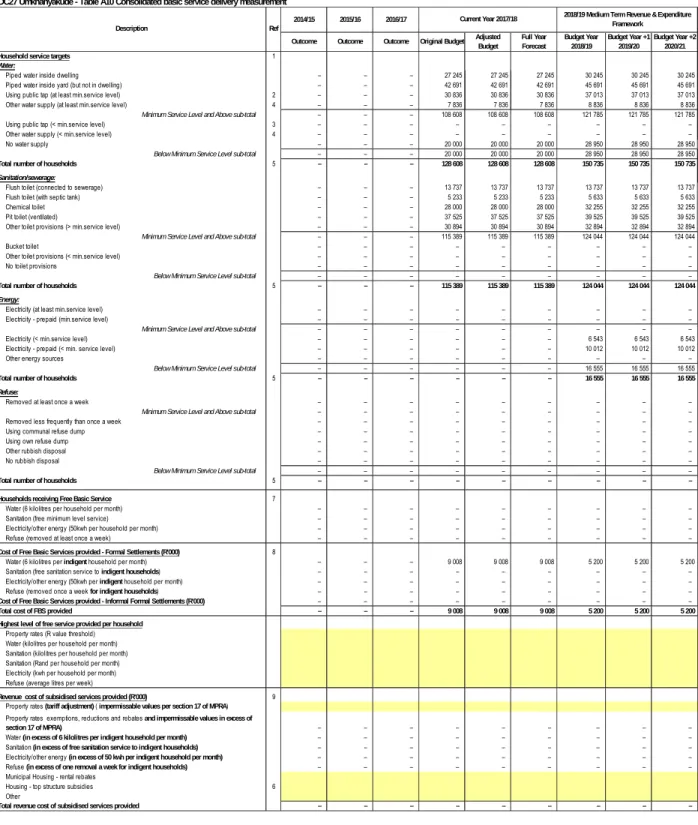
Table 18: Consolidated basic service delivery measurement ... 40
Table 19: Schedule of key deadline for budget ... 43
Table 20:MBRR Table SA4 ‐ Reconciliation between the IDP strategic objectives and budgeted revenue 49 Table 21: MBRR Table SA5 ‐ Reconciliation between the IDP strategic objectives and budgeted operating expenditure ... 50
Table 22: MBRR Table SA6 ‐ Reconciliation between the IDP strategic objectives and budgeted capital expenditure ... 51
Table 23: MBRR Table SA7 ‐ Measurable performance objectives ... 56
Table 24:MBRR Table SA8 ‐ Performance indicators and benchmarks ... 57
Table 25: Medium‐term outlook: operating revenue ... 65
Table 26: Proposed tariff increases over the medium‐term ... 67
Table 27: MBRR SA 15 Investment particular by type ... 68
Table 28: MBRR SA16 Investment particular maturity ... 69
Table 29: Medium‐term outlook: capital revenue ... 69
Table 30: MBRR SA 17 ‐ Detail of borrowings ... 70
Table 31: MBRR SA 18 ‐ Capital transfers and grant receipt ... 72
Table 32: MBRR A7 ‐ Budget cash flow statement ... 72
Table 33: MBRR A8 ‐ Cash backed reserves/accumulated surplus reconciliation ... 74
Table 34: MBRR SA10 – Funding compliance measurement ... 76
Table 39: MBRR SA24 – Summary of personnel numbers ... 85
Table 40: MBRR SA25 ‐ Budgeted monthly revenue and expenditure ... 86
Table 41: MBRR SA26 ‐ Budgeted monthly revenue and expenditure (municipal vote) ... 87
Table 42: MBRR SA27 ‐ Budgeted monthly revenue and expenditure (standard classification) ... 87
Table 43: MBRR SA28 ‐ Budgeted monthly capital expenditure (municipal vote) ... 88
Table 44: MBRR SA29 ‐ Budgeted monthly capital expenditure (standard classification) ... 88
Table 45: MBRR SA30 ‐ Budgeted monthly cash flow ... 89
Table 46: Water Services Department ‐ operating revenue by source, expenditure by type and total capital expenditure ... Error! Bookmark not defined. Table 47: MBRR SA34a – Capital expenditure on new assets by assets class ... 92
Table 48 MBRR SA34b ‐ Capital expenditure on the renewal of existing assets by asset class ... 93
Table 49: MBRR SA35 ‐ Future financial implications of the capital budget ... 96
Table 50: MBRR SA36 ‐ Detailed capital budget per municipal vote ... 98
Table 51: MBRR SA37 ‐ Projects delayed from previous financial year ... 98
Table 52: MBRR Table SA1 ‐ Supporting detail to budgeted financial performance .... Error! Bookmark not defined. Table 53: MBRR Table SA2 – Matrix financial performance budget (revenue source/expenditure type and department) ... 101
Table 54: MBRR Table SA3 – Supporting detail to Statement of Financial Position ... 102
Table 55: MBRR SA9 – Social, economic and demographic statistics and assumptions ... 103
Table 56: MBRR SA32 – List of external mechanisms ... 104
List of Figures Figure 1: Main operational expenditure categories for the 2013/14 financial year ... 30
Figure 2: Planning, budgeting and reporting cycle ... 53
Figure 3: Definition of performance information concepts ... 55
Figure 4: Breakdown of operating revenue over the 2013/14 MTREF ... 66
Figure 5: Medium‐term outlook: capital revenue ... 70
Figure 6: Growth in outstanding borrowings (long‐term liabilities) ... 71
Figure 7: Cash and cash equivalents/cash backed reserves and accumulated funds ... 75
Abbreviations and Acronyms AMR Automated Meter Reading BPC Budget Planning Committee CBD Central Business District CFO Chief Financial Officer CPI Consumer Price Index
CRRF Capital Replacement Reserve Fund DBSA Development Bank of South Africa DoRA Division of Revenue Act
DWA Department of Water Affairs
EE Employment Equity
EM Executive Mayor FBS Free basic services
GAMAP Generally Accepted Municipal Accounting Practice GDP Gross domestic product
GFS Government Financial Statistics
GRAP General Recognised Accounting Practice
HR Human Resources
IDP Integrated Development Plan IT Information Technology kℓ kilolitre
km kilometre
KPA Key Performance Area KPI Key Performance Indicator kWh kilowatt
ℓ litre
LED Local Economic Development
MEC Member of the Executive Committee MFMA Municipal Financial Management Act MIG Municipal Infrastructure Grant
MPRA Municipal Properties Rates Act MSA Municipal Systems Act
MTEF Medium‐term Expenditure Framework
MTREF Medium‐term Revenue and Expenditure Framework NERSA National Electricity Regulator South Africa
PMS Performance Management System PPE Property Plant and Equipment PPP Public Private Partnership RG Restructuring Grant RSC Regional Services Council
SALGA South African Local Government Association SAPS South African Police Service
SDBIP Service Delivery Budget Implementation Plan
UMKHANYAKUDE DISTRICT MUNICIPALITY MAYOR’S REPORT
DRAFT BUDGET 2018-2019
PART 1 – ANNUAL DRAFT BUDGET 1.1 Mayor’s Report
UMkhanyakude District Municipality have limited financial resources to satisfy the unlimited needs of the people. Therefore, we need to use our financial resources wisely by eliminating non-priority items in our budget.
This Council have the responsibility to eradicate the high volume of service delivery backlogs particularly in the infrastructure (water and sanitation) in the whole area of UMkhanyakude District. The more attention should be focused on an outdated and aging infrastructure that end up instigating huge losses of water and interrupt the services delivery to the community.
The municipality is faced with challenge of high unemployment rate with the high rate of indigent households, and this affect the debt collection of the municipality. Based on that from the portion of the equitable share the municipality will allocate the funds to free basic services to cater for the poor.
The District Municipality developed a DGDP through the assistance by KZN COGTA and the DGDP is zooming in into the strategic direction up to year 2035 which focusses on linking the IDP with the National and Provincial planning imperatives. In order for the District Municipality to deliver meaningfully on its mandate it have focused on the alignment of the PGDS and UMkhanyakude DGDP, which is summarised as following:
PGDS Strategic Goals DGDP Strategic Goals
1. Inclusive Economic Growth 1. Expanded District Economic output and increased quantity and quality of employment opportunities
2. Human Resource Development 2. Enhanced quality of district human
resources
3.Human and Community Development 3. Improved quality of life and life expectancy
4. Strategic Infrastructure 4. High quality infrastructure network to support improved quality of life and economic growth
5. Environmental Sustainability 5. District characterised by integrity and quality of its physical environment and underpinned by a coherent spatial development
6. Governance and Policy 6. Excellence in governance and leadership
7. Spatial Equity 7. District characterised by integrity and quality of its physical environment and underpinned by a coherent spatial development
This budget is more focused on the services delivery strategic priorities that were approved by Council. Furthermore, the Strategic Agenda of the IDP and the budget is guided by the six KPA’s which are:
• Municipal Transformation and Institutional Development
• Basic Service Delivery and Infrastructure development
• Local Economic Development
• Municipal Financial Viability and Management
• Good Governance and Public Participation
• Cross Cutting Interventions
In order for the municipality to ensure the smooth implementation of the above mentioned
strategic priority we need to device good communication techniques between the
municipality, community and other stakeholders. This should include communicating the
IDP, Budget, SDBIP, Performance reports/Annual Reports, setting of targets etc., to ensure that we are all striving for the same achievements.
UMkhanyakude District will ensure that all employees of the municipality are subscribed to Batho Pele principles. The 2018-2019 draft budget will be published and communicated to the community for their inputs for the adoption of the final annual budget by the 30 May 2018.
The total consolidated operating revenue budget and capital contribution budget for uMkhanyakude District Municipality is R 703 million below is the summary, the consolidated for operating expenditure and capital expenditure is R 703 million.
The summarised consolidated draft budget 2018-2019 for UMkhanyakude District Municipality:
Description
2018/19 Medium Term Revenue &
Expenditure Framework
Rands
Budget Year 2018/19
Budget Year +1 2019/20
Budget Year +2 2020/21 Total Revenue (excluding capital transfers and
contributions) 437 862 004 475 319 491 522 022 549
Transfers and subsidies ‐ capital (monetary
allocations) (National / Provincial and District) 254 859 100 279 630 050 283 396 450
Internally generated funds 11 200 000 ‐ ‐
Total Revenue 703 921 104 754 949 541 805 418 999
Expenditure
Total Expenditure‐ operational 437 862 004 475 319 491 522 022 549
Total Expenditure‐ capital 266 059 100 279 630 050 283 396 450
703 921 104 754 949 541 805 418 999
Surplus/(Deficit) ‐ ‐ ‐
The following are the allocation-in-kind for UMkhanyakude as per Division of Revenue Act
Consolidated Operating draft budget 2018-2019
Schedule 6B Grant In‐kind Description
Budget Year 2018/19
Budget Year +1 2019/20
Budget Year +2 2020/21
Pongolapoort Bulk Water Scheme (Jozini) 30 000 000
2018/19 Medium Term Revenue & Expenditure Framework
DC27 Umkhanyakude ‐ Table A1 Consolidated Budget Summary Description
Budget Year 2018/19
Budget Year +1 2019/20
Budget Year +2 2020/21 Rands
Revenue By Source ‐ ‐ ‐ Service charges ‐ electricity revenue 10 000 000 10 700 000 11 449 000 Service charges ‐ water revenue 26 509 104 28 364 741 30 350 273 Service charges ‐ sanitation revenue 640 000 684 800 732 736 Rental of facilities and equipment 90 000 96 300 103 041 Interest earned ‐ external investments 5 000 000 5 350 000 5 724 500
Transfers and subsidies 395 612 900 430 112 950 473 651 550
Other revenue 10 000 10 700 11 449
Total Revenue (excluding capital transfers and contributions) 437 862 004 475 319 491 522 022 549 Expenditure By Type
Employee related costs 154 540 072 166 594 197 179 588 545
Remuneration of councillors 9 387 321 9 856 687 10 349 522
Debt impairment 5 000 000 5 350 000 5 724 500
Depreciation & asset impairment 35 000 000 37 450 000 40 071 500
Finance charges 1 498 863 1 603 784 1 716 048
Bulk purchases 106 000 000 111 724 000 117 868 820
Other materials 24 935 000 26 680 450 28 548 082
Contracted services 61 954 000 65 967 580 70 265 949
Transfers and subsidies ‐ ‐ ‐
Other expenditure 39 546 748 50 092 793 67 889 584
Loss on disposal of PPE
Total Expenditure 437 862 004 475 319 491 522 022 549 Surplus/(Deficit) ‐ ‐ ‐
2018/19 Medium Term Revenue & Expenditure
Framework
Capital Budget 2018-2019
_______________________________________
Cllr T.S Mkhombo
The Mayor: UMkhanyakude District Municipality
Capital Grants Budget 2018‐2019 Account
Draft Budget 2018‐2019
Draft Budget 2019‐2020
Draft Budget 2020‐2021 Municipal Infrastructure Grant (excluding PMU) 199 859 100 199 630 050 198 996 450 Water Service Infrastructure Grant 55 000 000 80 000 000 84 400 000
Total capital grants 254 859 100 279 630 050 283 396 450
1.2 Council Resolution
1.3 EXECUTIVE SUMMARY
1.3.1 Introduction
For the 2018/2019 and the MTREF the Municipality is budgeting for a no surplus or no deficit. This is characterised by cash backing of Depreciation and other non-cash flow provisions. The intention for a no deficit nor surplus budgeting is to target establishment of positive reserves for the municipality which can in future years be utilised to fund capital replacements.
The draft budget for the 2018-2019 proposed a total consolidated amount of R703 million which has been developed with an overall planning framework and includes programme and projects to achieve the municipality’s strategic objectives. An amount of R437 million has been allocated to the operational budget and the capital budget for the infrastructure is R 254 million. The projection for the service charges and other income included is R 37 million. The overall budget for UMkhanyakude District Municipality is 703 million.
The draft Medium-Term Revenue and Expenditure Frame Work is released for the consultation of the community, business, internal and external stakeholders, so they can have the influence in the area of UMkhanyakude. The budget enables the implementation of our goals as set out on the Integrated Development Plan.
1.3.2 Strategic priorities for 2018-2019
The following are the Nine (9) key priority areas of uMkhanyakude District Municipality:
Water
Sanitation/Sewerage;
Environmental Health;
Economics, Social or Community and Skills Development
Poverty eradication and Food Security;
Revenue enhancement;
Spatial planning and development;
Communication and Information Technology (IT); and
Good Governance and Clean Administration.
The municipality has identified all of the above priorities and also the municipality’s objectives and strategies that need to be addressed:
OBJECTIVES AND STRATEGIES FOR 2018/2019 FINANCIAL YEAR
KPA 1: MUNICIPAL TRANSFORMATION AND INSTITUTIONAL DEVELOPMENT OBJECTIVES
To ensure effective Organizational Performance Management System (PMS) To ensure effective integrated development planning (IDP)
To provide effective and efficient human resource management aimed at achieving a skilled workforce that is responsive to service delivery and change
To provide effective and efficient human resource management aimed at achieving a skilled workforce that is responsive to service delivery and change
To provide an effective and efficient system of managing records for preservation of institutional memory
Adherence to evolving technology
To ensure adherence to Occupational Health and Safety Act
To ensure effective and efficient administrative services
To ensure effective and efficient legal services
STRATEGIES
Council adoption of PMS Council adoption of IDP
Council adoption of Human Resources Development Strategy Council Adoption of Workplace Skills Plan
Council adoption of Employment Equity Plan
Conducting assessment on effectiveness of Records Management System Conduct an assessment on effectiveness of provision of ICT services Conduct Health and Safety Risk assessments
Conduct an assessment on provision of administrative support services Conduct an assessment on provision of legal services
KPA 2: BASIC SERVICE DELIVERY OBJECTIVE
To provide high quality infrastructure network to support improved quality of life and economic growth
STRATEGIES
Implementation of projects for all households to access basic water services supported by high quality infrastructure
Implementation of projects for all households to access basic sanitation services supported by high quality infrastructure
Ensure functional electricity services for Ingwavuma and KwaMsane areas
Planning and implementation of support programmes aimed at Improving coverage and quality of infrastructure within the District
KPA 3: LOCAL ECONOMIC DEVELOPMENT OBJECTIVE
To expand district economic output and increase quantity and quality of employment opportunities
STRATEGIES
Conduct an assessment on the role of agricultural and forestry sector in district economic growth and employment creation
Conduct an assessment on the role of conservation and a diversified tourism sector in District economic growth
Increase in business skills levels of the district labour force
Conduct an assessment on improved quality of employment opportunities and income levels of employed population
Monitoring of UMDA’s performance as per the Business Plan for operational budget
KPA 4: FINANCIAL VIABILITY AND MANAGEMENT OBJECTIVE
To Implement Revenue Collection Strategy To improve expenditure management To Improve Financial Management
To Effectively Implement Supply Chain Management Regulations
STRATEGIES
Develop and implement cash flow management plans Develop and implement cash and credit management plans
Develop a credible budget and report in accordance with the provisions of the MFMA Development of a Procurement Plan
Assessment of service providers’ performance
KPA 5: GOOD GOVERNANCE AND PUBLIC PARTICIPATION OBJECTIVES
To improve the quality of life and life expectancy for people living within UMkhanyakude District
To ensure excellence in governance and leadership STRATEGIES
Implementation of Special Programmes
Implementation of Environmental Health Management Programmes Functionality assessment of Risk management programmes
Functionality assessment of committees responsible for oversight in the Municipality Regular public participation in municipal businesses
Functionality assessment of IGR programmes
Functionality assessment of Council committees and structures KPA 6: CROSS CUTTING INTERVENTIONS
OBJECTIVES
To ensure integrity and quality of physical environment underpinned by a coherent spatial development pattern
To ensure functional and responsive Disaster Management Unit
National Treasury’s MFMA Circular No. 85 and 86 was used to guide the compilation of the 2018-2019 draft MTREF.
STRATEGIES
Conduct an assessment of environmental integrity of the District and its resources
Implement a functionally structured spatial development pattern guided by identified nodes and corridors through an effective land use management system
Conduct an assessment on effectiveness of prevention, mitigation and response to Disasters within the District
1.3.3 Challenges
The main challenges experienced during the compilation of the 2018-2019 draft MTREF can be summarised as follows:
Aging and poorly maintained water, roads and electricity infrastructure;
The need to reprioritise projects and expenditure within the existing resource envelope given the cash flow realities and declining cash position of the municipality;
The on-going difficulties in the national and local economy;
The high rate of unemployment within UMkhanyakude
The high rate of indigent within UMkhanyakude
The increased cost of bulk water and electricity (due to tariff increases from Water and Eskom), which is placing upward pressure on service tariffs to residents. Continuous high tariff increases are not sustainable - as there will be point where services will no-longer be affordable;
Wage increases for municipal staff that continue to exceed consumer inflation, as well as
Affordability of capital projects – original allocations had to be reduced and the operational expenditure associated with prior year’s capital investments needed to be factored into the budget as part of the 2018-2019 MTREF process
1.3.4 Budget principles and guidelines that directly informed the compilation of the 2018-2019 draft MTREF
The 2017-2018 Adjustments Budget priorities and targets, as well as the base line allocations contained in that Adjustments Budget were adopted as the upper limits for the new baselines for the 2018-2019 annual budget;
Intermediate service level standards were used to inform the measurable objectives, targets and backlog eradication goals;
Tariff increases should be affordable and should generally not exceed inflation as measured by the CPI, except where there are price increases in the inputs of services that are beyond the control of the municipality, for instance the cost of bulk water and electricity. In addition, tariffs need to remain or move towards being cost reflective, and should take into account the need to address infrastructure backlogs;
There will be no budget allocated to national and provincial funded projects unless the necessary grants to the municipality are reflected in the national and provincial budget and have been gazetted as required by the annual Division of Revenue Act;
The following table is a consolidated overview of the proposed 2018-2019 Medium-term Revenue and Expenditure Framework:
Consolidated Overview of the 2018-2019 MTREF
The consolidated operating revenue for both parent municipality and the entity of the
municipality is R437 million, 5.4 per cent compared to the adjustment budget for 2017-
2018. For the two outer years, operational revenue will increase 8 per cent and 9 per cent
respectively, equating to a total revenue growth of R 38 million and R47 respectively over
the MTREF consolidated.
Total consolidated operating expenditure for the 2018-2019 financial year has been appropriated at 1 per cent increase when compared to the 2017/18 Adjustments Budget and by 9 per cent and 9 per cent for each of the respective outer years of the MTREF.
The capital budget decreased with R27-million when compared to adjustment budget for 2017/18 financial year, and an increase of R13-million in the 2019/20 financial year, and a R4-million increase in the 2020/21 financial year.
1.4 Operating Revenue Framework
In order the Municipality to continue improving the quality of services provided to the citizens it needs to generate required revenue. In these tough economic times strong revenue management is fundamental to the financial sustainability of every municipality.
The reality is that we are faced with development backlogs and poverty. The expenditure required to address these challenges will inevitably always exceed available funding;
hence difficult choices have to be made in relation to tariff increases and balancing expenditures against realistically anticipated revenues.
The municipality’s revenue strategy is built around the following key components:
National Treasury’s guidelines and macroeconomic policy;
Growth in the municipality and continued economic development;
Efficient revenue management
Achievement of full cost recovery of specific user charges especially in relation to trading services;
Determining the tariff escalation rate by establishing/calculating the revenue requirement of each service;
Increase ability to extend new services and recover costs;
The municipality’s Indigent Policy and rendering of free basic services; and
Tariff policies of the municipality.
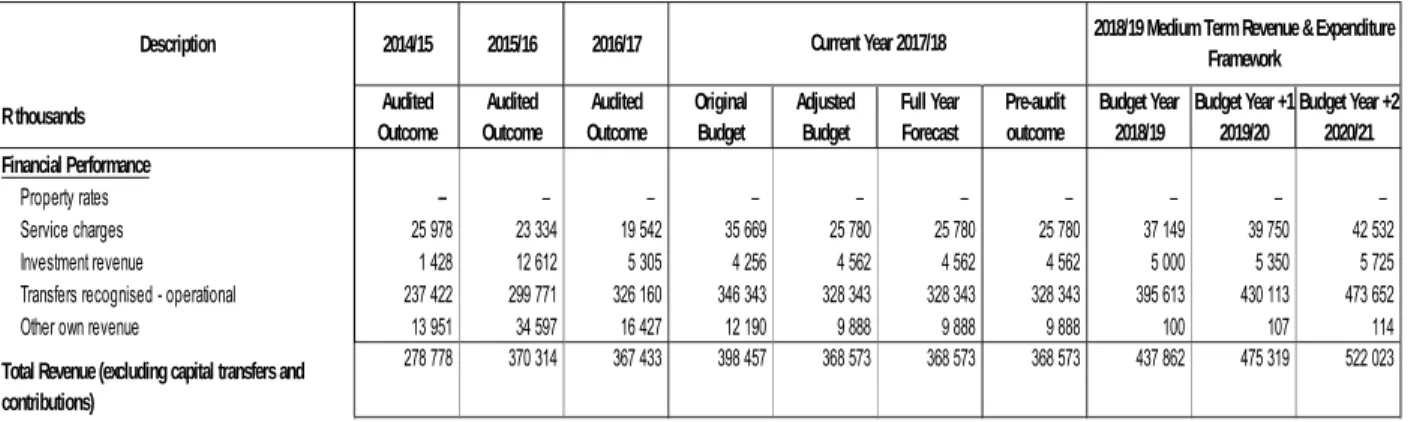
The following table is a consolidated summary of the 2018-2019 MTREF (classified by
Table 1: Summary of revenue classified by main revenue source
In line with the formats prescribed by the Municipal Budget and Reporting Regulations, capital transfers and contributions are excluded from the operating statement, as inclusion of these revenue sources would distort the calculation of the operating surplus/deficit.
Revenue generated from service charges results to a significant percentage of revenue basket for the municipality. 8.7 per cent of the consolidated total revenue mix for 2018/19 is from Service Charges. For the 2018/19 financial year, consolidated budget for service charges will increases from R25.8-million to R37.1-million (2018/190, R39.8-million (2019/20) and R42,5-million (2020/21) respectively in the MTREF. A notable increase in the revenue generated from services charges which increases with 8 per cent in 2017/18 after the adjustment budget is due to the adjustment budget that is calculated based on the actual during that period. Now the municipality has increased its actual revenue and conventional revenue budget increased with 4 per cent of the total revenue. This growth can be mainly attributed to the increased share that the sale of electricity contributes to the total revenue mix, which in turn is due to rapid increases in the Eskom tariffs for bulk electricity.
Excluded from other revenue is Interest charges from arrear debtors. The council has decided to re-instate the interest from non-paying service providers with effect from 01 July 2018 The Council and Administration will embark on a strong customer education aimed at instilling the good culture of paying for services. A large number of Communities
Description 2014/15 2015/16 2016/17
R thousands Audited
Outcome
Audited Outcome
Audited Outcome
Original Budget
Adjusted Budget
Full Year Forecast
Pre-audit outcome
Budget Year 2018/19
Budget Year +1 2019/20
Budget Year +2 2020/21 Financial Performance
Property rates – – – – – – – – – – Service charges 25 978 23 334 19 542 35 669 25 780 25 780 25 780 37 149 39 750 42 532 Investment revenue 1 428 12 612 5 305 4 256 4 562 4 562 4 562 5 000 5 350 5 725 Transfers recognised - operational 237 422 299 771 326 160 346 343 328 343 328 343 328 343 395 613 430 113 473 652 Other own revenue 13 951 34 597 16 427 12 190 9 888 9 888 9 888 100 107 114 Total Revenue (excluding capital transfers and
contributions)
278 778
370 314 367 433 398 457 368 573 368 573 368 573 437 862 475 319 522 023 2018/19 Medium Term Revenue & Expenditure
Framework Current Year 2017/18
DC27 Umkhanyakude - Table A1 Consolidated Budget Summary
which in the past were not receiving clean water will in 2018/2019 start to receive water and hence the education is proposed.
Operating grants and transfers totals to R395-million in the 2018-2019 financial year as gazetted for UMkhanyakude District Municipality, excluding the Provincial Grants of the entity (UMhlosinga Development Agency). Note that the year-on-year growth for the 2018/19 financial year is R67 million and then R35 million 2019/20 years. The following table gives a breakdown of the various operating grants and subsidies allocated to the municipality over the medium term as gazetted in Division of Revenue Act bill:
Table 2: Operating Transfers and Capital grants
Tariffs
Tariff-setting is an essential and strategic part of the compilation of any budget. When charges will be revised, local economic conditions, input costs and the affordability of services will be taken into account to ensure the financial sustainability of the
Account Draft Budget
2018-2019
Draft Budget 2019-2020
Draft Budget 2020-2021
Equitable Share 329 739 000 362 257 000 399 094 000
RSC Levies Replacement 45 009 000 48 978 000 53 239 000
Total Equitable Share 374 748 000 411 235 000 452 333 000
Finance Management Grant 1 000 000 1 465 000 1 897 000
Municipal Infrastructure Grant (excluding PMU) 199 859 100 199 630 050 198 996 450
Water Service Infrastructure Grant 55 000 000 80 000 000 84 400 000
Rural Assets Management Grant 2 624 000 2 780 000 2 941 000
Expanded Public Works Programme 3 022 000
PMU 10 518 900 10 747 950 11 381 550
Dukuduku Forest Environmental Management Framework 1 000 000 1 050 000 1 108 000
Mkuze Airport 2 000 000 2 100 000 2 216 000
Tourism Strategy 700 000 735 000 775 000
Spatial Development Framework Support 1 000 000
650 472 000
709 743 000 757 048 000
UMKHANYAKUDE DISTRICT MUNICIPALITY DRAFT BUDGET 2018-2019
CAPITAL AND OPERATIONAL GRANTS
UMkhanyakude. The municipality is under the review of current tariffs, based on that only the tariffs for commercial as well as departments will increase with 10 per cent rates.
National Treasury continues to encourage municipalities to keep increases in tariffs and other charges as low as possible.
It must also be appreciated that the consumer price index, as measured by CPI, is a good
measure of the cost increases of goods and services relevant to municipalities. The
basket of goods and services utilised for the calculation of the CPI consist of items such
as food, petrol and medical services, whereas the cost drivers of a municipality are
informed by items such as the cost of remuneration, bulk purchases of electricity and
water, petrol, diesel, chemicals, cement etc.
Table 3: Proposed Water Tariffs
PROPOSED CONSUMPTION CHARGES AND TARIFFS FOR THE 2018/2019 FINANCIAL YEAR
UMkhanyakude District Municipality
Water Tariffs for 2017/18
2016/2017
PROPOSED 2017/2018
Area Description Rate Description 10% increase
Water Water
All area in DC27 Residential Residential
0‐6 Free 0‐6 Free
7‐20 6.69 7‐20 7.36
21‐30 10.37 21‐30 11.41
31‐40 12.55 31‐40 13.81
40‐50 15.38 40‐50 16.20
50> 19.87 50> 21.86
Commercial Commercial
0‐20 13.10 0‐20 14.41
0‐30 15.94 21‐30 17.54
0‐40 16.89 31‐40 18.59
0‐50 18.76 41‐50 20.64
51> 22.51 51> 24.76
Government Government
0‐20 13.10 0‐20 14.41
0‐30 15.94 21‐30 17.54
0‐40 16.89 31‐40 18.59
0‐50 18.76 41‐50 20.64
51> 22.51 51> 24.76
Consumer deposit
Domestic 2x ave consumption
minimum R 650.00
Commercial 2x Ave consumption
minimum R 1210.00
UMkhanyakude District Municipality Water Related Tariffs for 2017/2018
Area Description Rates 2016/2017 Rates 2017/2018
water connection up to 25m domestic 0.00 R 1,500
all connection above 25mm domestic actual cost + 10% actual cost + 10%
water connection up to 25m Commercial/other R 2 000.00 R 2 200.00
special meter reading R 225.00 R 247.50
prepaid meter cost of meter + 10% cost of meter + 10%
final reading disconnection R 23.45 R 25.80
testing of a meter R 508.91 R 559.80
tampering fee R 1 407.12 R 1 547.82
Water Tanker service R25/kl + cost per km
Water tanker cost per km R19.45 R21.40
Reconnection for non‐
payment R193.48 R 121.83
water in unmetered area per household R35.76 R0.00
all other work cost + 10%
administration costs cost+10%
dishonored cheques R126.50
Sanitation tariffs for 2017/2018
Area Description Rates 2016/2017 Rates 2017/2018
All Area on sewer mains per flat/Dwelling R1.78/kl consumed R1.96/kl consumed
Conservancy tanks where service
available 422.19 R 464.41
Conservancy tanks weekends/PH R 636.51 R 700.16
Discharges of sewer by tanker Per kl R26.01
R28.61 Other tariffs for letting municipal property
Area Description Rates 2016/2017 Rates 2017/2018
Guest house Rate per person per night R 300.00 R 700.00
Park homes Per month R 700.00 R 1 400.00
Thusong Centre offices Rate per square meter R 80.00 R 88.00
The Bulk water tariff has been eradicated and single property will be metered individually. With the unmetered tariff charge eradicated for the 2018/2019 financial year.
1.4.1 Sale of water and impact on tariff increases
South Africa faces similar challenges with regard to water supply as it did with electricity, since demand growth outstrips supply. Consequently, National Treasury is encouraging all municipalities to carefully review the level and structure of their water tariffs to ensure:
Water tariffs are fully cost-reflective – including the cost of maintenance and renewal of purification plants, water networks and the cost associated with reticulation expansion; The full calculation is being performed to fully reflect on cost coverage.
Water tariffs are structured to protect basic levels of service and ensure the provision of free water to the poorest of the poor (indigent); and
Water tariffs are designed to encourage efficient and sustainable consumption.
1.4.2 Sale of electricity and impact on tariff increases
NERSA has announced the revised bulk electricity pricing structure. A 6.84 percent increase in the Eskom bulk electricity tariff to municipalities will be effective from 1 July 2018.
It should be noted that given the magnitude of the tariff increase, it is expected to depress growth in electricity consumption, which will have a negative impact on the municipality’s revenue from electricity.
1.4.2 Sanitation and impact on tariff increases
A tariff increases of 10 per cent for sanitation from 1 July 2018 is proposed. This is based on the input cost assumptions related to water. It should be noted that electricity costs contribute approximately 20 per cent of waste water treatment input costs, therefore the 10 per cent for sanitation tariffs. The following factors also contribute to the proposed tariff increase:
Sanitation charges are calculated according to the percentage water discharged as indicated in the table below;
The total revenue expected to be generated from rendering this service amounts to R640 000.00 for the 2018-2019, R685 000.00 for the 2019/2020 and R733 000.00 for the 2020/21 financial years respectively.
1.5 Operating Expenditure Framework
The municipality’s expenditure framework for the 2018-2019 budget and MTREF is informed by the following:
The asset replacement strategy and the repairs and maintenance plan;
Balanced budget constraint (operating expenditure should not exceed operating revenue) unless there are existing uncommitted cash-backed reserves to fund any deficit;
Funding of the budget over the medium-term as informed by Section 18 and 19 of the MFMA;
The capital programme is aligned to the asset management strategy
Operational gains and efficiencies will be directed to funding the capital budget
and other core services; and
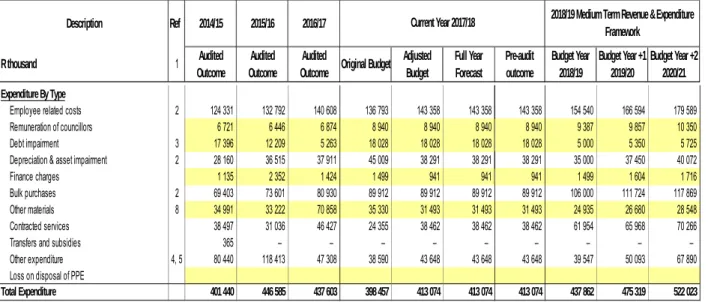
The following table is a high-level summary of the 2018-2019 budget and MTREF (classified per main type of operating expenditure):
Table 4: Summary of operating expenditure by standard classification item
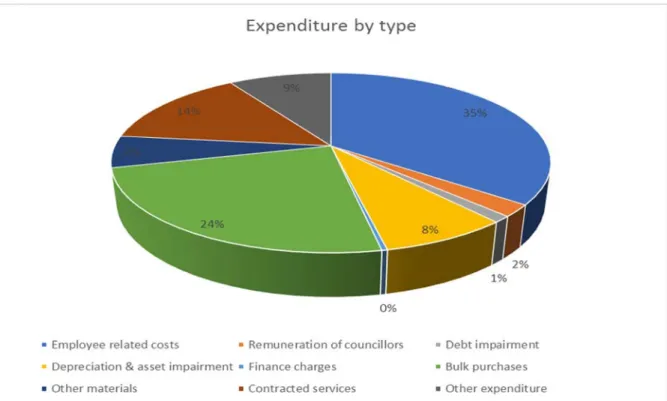
The budgeted allocation for employee related costs for the 2018-2019 financial year totals R154 million, which equals 35 per cent of the total operating expenditure the parent municipality. Based on MFMA circular number 86 guidelines the parent municipality increased the employees related cost with CPI rate plus 1 per cent. The total consolidated of employees related costs is R154 million for the parent and the entity of the municipality which is equal to 35 per cent of the consolidated operational expenditure budget. As part of the UMkhanyakude cost reprioritization and cash management strategy vacancies have been significantly rationalized downwards.
The cost associated with the remuneration of councillors is determined by the Minister of Co-operative Governance and Traditional Affairs in accordance with the
Remuneration of Public Office Bearers Act, 1998 (Act 20 of 1998) published in December 2017. The most recent proclamation in this regard has been taken into account in compiling the UMkhanyakude District budget.
DC27 Umkhanyakude - Table A4 Consolidated Budgeted Financial Performance (revenue and expenditure)
Description Ref 2014/15 2015/16 2016/17
R thousand 1 Audited
Outcome
Audited Outcome
Audited
Outcome Original Budget Adjusted Budget
Full Year Forecast
Pre-audit outcome
Budget Year 2018/19
Budget Year +1 2019/20
Budget Year +2 2020/21 2018/19 Medium Term Revenue & Expenditure
Framework Current Year 2017/18
Expenditure By Type
Employee related costs 2 124 331 132 792 140 608 136 793 143 358 143 358 143 358 154 540 166 594 179 589 Remuneration of councillors 6 721 6 446 6 874 8 940 8 940 8 940 8 940 9 387 9 857 10 350 Debt impairment 3 17 396 12 209 5 263 18 028 18 028 18 028 18 028 5 000 5 350 5 725 Depreciation & asset impairment 2 28 160 36 515 37 911 45 009 38 291 38 291 38 291 35 000 37 450 40 072 Finance charges 1 135 2 352 1 424 1 499 941 941 941 1 499 1 604 1 716 Bulk purchases 2 69 403 73 601 80 930 89 912 89 912 89 912 89 912 106 000 111 724 117 869 Other materials 8 34 991 33 222 70 858 35 330 31 493 31 493 31 493 24 935 26 680 28 548 Contracted services 38 497 31 036 46 427 24 355 38 462 38 462 38 462 61 954 65 968 70 266 Transfers and subsidies 365 – – – – – – – – – Other expenditure 4, 5 80 440 118 413 47 308 38 590 43 648 43 648 43 648 39 547 50 093 67 890 Loss on disposal of PPE
Total Expenditure 401 440 446 585 437 603 398 457 413 074 413 074 413 074 437 862 475 319 522 023
The provision of debt impairment, at present we are compiling a full report on debtor profiling which will assist projecting the debtor impairment for the 2018/2019 financial year. This exercise will be completed by 31 May 2018 and will be factored in the calculation of debtor impairment provision. The figure included in the draft budget as the provision for debt impairment is based on the audited actual debtor impairment for the 2016/2017 and is not based on full calculation or assumptions. The R5 million is set of against the billing provision on our revenue from receivables. The 7 per cent increase for outer years is based on the assumption of the increase of the receivables between comparative prior years. While this expenditure is considered to be a non-cash flow item, it informed the total cost associated with rendering the services of the municipality, as well as the municipality’s realistically anticipated revenues. We have cash backed this provision.
Councillors Remuneration calculation 2018-2019 UMkhanyakude District Municipality: Grade 4
Allocation of number of points for uMkhanyakude District Municipality
The number of points allocated for the total municipal income of a municipality
DC 27 Total income range between R10million and R50 million, number of point allocated as per Gazettee No.: 38608 is 16.67 points
Allocation of number of points for total population
The number of points allocated for the total population within uMkhanyakude municipality is 41.67 points as the total population for Umkhanyakude District is 625 847
Determination of grade of municipal council Points Grade
Total income points 16.67
Total population points 41.67
58.34
4
According to the Remuneration of Public Office Bearers Act, 1998 (Act No. 20 of 1998), Gazettee No. 38608 section 4(a),
uMkhanyakude District Municipality is Grade 4 as it ranges between 50.01 to 66.67
Council Remuneration Workings 2017-2018 2018-2019
Council Remunaration Rands
calculation including 5%
3400/3410/01/0101 (Councillors Allowances - Councillors - Council Support) 4 663 103.00 4 896 258.15 3400/3420/01/0101 (Councillors Allowances - Exco Members - Council Support) 1 221 439.00 1 282 510.95 3400/3430/01/0101 (Councillors Allowance - Mayor - Council Support) 826 414.00 867 734.70 3400/3440/01/0101 (Councillors Allowances - Cellphone Allowance - Council Support) 98 280.00 103 194.00 3400/3450/01/0101 (Councillors Allowances - S&T- Council Support) 189 000.00 198 450.00
1 942 070.00
2 039 173.50
8 940 306.009 387 321.30
Depreciation is widely considered a proxy for the measurement of the rate asset consumption. Budget appropriations in this regard total R35 million for the 2018-2019 financial and equates to 8 per cent of the total operating expenditure. It is 8 per cent of the increase of the comparative prior years assets increase. Note that the implementation of GRAP 17 accounting standard has meant bringing a range of assets previously not included in the assets register. This has resulted in a significant increase in depreciation relative to previous years. While this expenditure is considered to be a non-cash flow item, it informed the total cost associated with rendering the services of the municipality.
We have cash backed this provision.
Finance charges consist primarily of the repayment of interest on long-term borrowing (cost of capital). The municipality was in a process of settling the long-term loan in 2017- 2018 and is not intending to have a long-term borrowing in 2018-2019, but since it is not finalised an amount of R2 million has been provided for interest charges and interest on bank accounts for the municipality.
Bulk purchases are directly informed by the purchase of electricity from Eskom and water for water purification and reticulation. The annual price increases have been factored into the budget appropriations and directly inform the revenue provisions. The expenditures include distribution losses.
Other materials comprise of amongst others the purchase of fuel, diesel, materials for maintenance, repairs, cleaning materials and chemicals. In line with the municipality repairs and maintenance plan this group of expenditure has been prioritised to ensure sustainability of the UMkhanyakude’s infrastructure.
Contracted services have been identified as a cost saving area for the municipality. As
part of the compilation of the 2018-2019 MTREF this group of expenditure was critically
evaluated and operational efficiencies were enforced. In the 2018-2019 financial year,
this group of expenditure totals R61 million which equates 13 per cent, clearly
demonstrating the application of cost efficiencies.
Other expenditure comprises of various line items relating to the daily operations of the municipality. This group of expenditure has also been identified as an area in which cost savings and efficiencies can be achieved. Growth has been limited to 8 per cent for 2018- 2019 including the other expenditure of the entity.
Figure 1: Main operational expenditure categories for the 2018-2019 financial year
1.6 Capital expenditure
The following table provides a breakdown of budgeted capital expenditure by vote:
Table 5: Capital budget per vote
Vote Description Ref 2016/17 Current Year 2017/18 2018/19 Medium Term Revenue & Expenditure
Framework
R thousand 1 Audited
Outcome Original
Budget Full Year
Forecast Budget Year
2018/19 Budget Year
+1 2019/20 Budget Year +2 2020/21
Capital expenditure - Vote
Multi-year expenditure to be appropriated 2
Single-year expenditure to be appropriated 2
Vote 1 - COUNCIL SUPPORT – –
700 3 500 – – Vote 4 - CORPORATE SERVICES – – – 7 700 – – Vote 9 - WATER SERVICES 188 894 199 821 241 786 167 709 179 449 192 010 Vote 10 - SANITATION DEPARTMENT 40 376 58 144 51 480 87 150 100 181 145 368 Capital single-year expenditure sub-total 229 270 257 965 293 966 266 059 279 630 337 378 Total Capital Expenditure - Vote 229 270 257 965 293 966 266 059 279 630 337 378
Capital Expenditure - Functional
Governance and administration – –
700 11 200 – –
Executive and council – –
700 3 500 – – Finance and administration – – – 7 700 – – Trading services 229 270 257 965 296 362 254 859 279 630 283 396 Energy sources – – – – – – Water management 188 894 199 821 244 882 167 709 179 449 192 010 Waste water management 40 376 58 144 51 480 87 150 100 181 91 386 Waste management – – – – – – Other – – – – – – Total Capital Expenditure - Functional 3 229 270 257 965 297 062 266 059 279 630 283 396
Funded by:
National Government 229 270 114 789 261 060 254 859 279 630 283 396 Other transfers and grants – – – – – – Transfers recognised - capital 4 229 270 114 789 261 060 254 859 279 630 283 396 Public contributions & donations 5 – – – – – – Borrowing 6 – – – – – – Internally generated funds – – 32 905 11 200 – – Total Capital Funding 7 229 270 114 789 293 966 266 059 279 630 283 396
For 2018-2019 an amount of R254.8 million has been appropriated for the development
of infrastructure which is the total capital budget. R11.2 million has been allocated for
movable assets of the municipality. In the outer years this amount totals R279 million,
and R313 million respectively for each of the financial years. Water service infrastructure
receives the highest allocation of R167 million and R87 million for waste water
management infrastructure.
1.7 Annual Budget tables
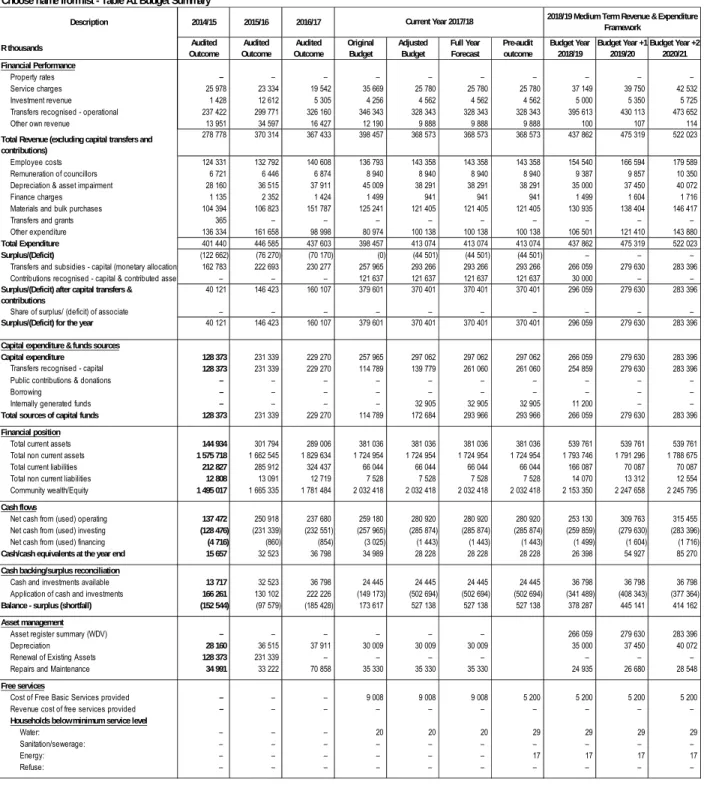
Table 6: Consolidated Annual Budget Summary
Description 2014/15 2015/16 2016/17
R thousands Audited
Outcome
Audited Outcome
Audited Outcome
Original Budget
Adjusted Budget
Full Year Forecast
Pre-audit outcome
Budget Year 2018/19
Budget Year +1 2019/20
Budget Year +2 2020/21 Financial Performance
Property rates – – – – – – – – – – Service charges 25 978 23 334 19 542 35 669 25 780 25 780 25 780 37 149 39 750 42 532 Investment revenue 1 428 12 612 5 305 4 256 4 562 4 562 4 562 5 000 5 350 5 725 Transfers recognised - operational 237 422 299 771 326 160 346 343 328 343 328 343 328 343 395 613 430 113 473 652 Other own revenue 13 951 34 597 16 427 12 190 9 888 9 888 9 888 100 107 114 Total Revenue (excluding capital transfers and
contributions)
278 778
370 314 367 433 398 457 368 573 368 573 368 573 437 862 475 319 522 023
Employee costs 124 331 132 792 140 608 136 793 143 358 143 358 143 358 154 540 166 594 179 589 Remuneration of councillors 6 721 6 446 6 874 8 940 8 940 8 940 8 940 9 387 9 857 10 350 Depreciation & asset impairment 28 160 36 515 37 911 45 009 38 291 38 291 38 291 35 000 37 450 40 072 Finance charges 1 135 2 352 1 424 1 499 941 941 941 1 499 1 604 1 716 Materials and bulk purchases 104 394 106 823 151 787 125 241 121 405 121 405 121 405 130 935 138 404 146 417 Transfers and grants 365 – – – – – – – – – Other expenditure 136 334 161 658 98 998 80 974 100 138 100 138 100 138 106 501 121 410 143 880 Total Expenditure 401 440 446 585 437 603 398 457 413 074 413 074 413 074 437 862 475 319 522 023 Surplus/(Deficit) (122 662) (76 270) (70 170) (0) (44 501) (44 501) (44 501) – – –
Transfers and subsidies - capital (monetary allocations 162 783 222 693 230 277 257 965 293 266 293 266 293 266 266 059 279 630 283 396 Contributions recognised - capital & contributed asset – – – 121 637 121 637 121 637 121 637 30 000 – – Surplus/(Deficit) after capital transfers &
contributions
40 121
146 423 160 107 379 601 370 401 370 401 370 401 296 059 279 630 283 396 Share of surplus/ (deficit) of associate – – – – – – – – – – Surplus/(Deficit) for the year 40 121 146 423 160 107 379 601 370 401 370 401 370 401 296 059 279 630 283 396 Capital expenditure & funds sources
Capital expenditure 128 373 231 339 229 270 257 965 297 062 297 062 297 062 266 059 279 630 283 396 Transfers recognised - capital 128 373 231 339 229 270 114 789 139 779 261 060 261 060 254 859 279 630 283 396 Public contributions & donations – – – – – – – – – – Borrowing – – – – – – – – – – Internally generated funds – – – – 32 905 32 905 32 905 11 200 – – Total sources of capital funds 128 373 231 339 229 270 114 789 172 684 293 966 293 966 266 059 279 630 283 396 Financial position
Total current assets 144 934 301 794 289 006 381 036 381 036 381 036 381 036 539 761 539 761 539 761 Total non current assets 1 575 718 1 662 545 1 829 634 1 724 954 1 724 954 1 724 954 1 724 954 1 793 746 1 791 296 1 788 675 Total current liabilities 212 827 285 912 324 437 66 044 66 044 66 044 66 044 166 087 70 087 70 087 Total non current liabilities 12 808 13 091 12 719 7 528 7 528 7 528 7 528 14 070 13 312 12 554 Community wealth/Equity 1 495 017 1 665 335 1 781 484 2 032 418 2 032 418 2 032 418 2 032 418 2 153 350 2 247 658 2 245 795 Cash flows
Net cash from (used) operating 137 472 250 918 237 680 259 180 280 920 280 920 280 920 253 130 309 763 315 455 Net cash from (used) investing (128 476) (231 339) (232 551) (257 965) (285 874) (285 874) (285 874) (259 859) (279 630) (283 396) Net cash from (used) financing (4 716) (860) (854) (3 025) (1 443) (1 443) (1 443) (1 499) (1 604) (1 716) Cash/cash equivalents at the year end 15 657 32 523 36 798 34 989 28 228 28 228 28 228 26 398 54 927 85 270 Cash backing/surplus reconciliation
Cash and investments available 13 717 32 523 36 798 24 445 24 445 24 445 24 445 36 798 36 798 36 798 Application of cash and investments 166 261 130 102 222 226 (149 173) (502 694) (502 694) (502 694) (341 489) (408 343) (377 364) Balance - surplus (shortfall) (152 544) (97 579) (185 428) 173 617 527 138 527 138 527 138 378 287 445 141 414 162 Asset management
Asset register summary (WDV) – – – – – – 266 059 279 630 283 396 Depreciation 28 160 36 515 37 911 30 009 30 009 30 009 35 000 37 450 40 072 Renewal of Existing Assets 128 373 231 339 – – – – – – – Repairs and Maintenance 34 991 33 222 70 858 35 330 35 330 35 330 24 935 26 680 28 548 Free services
Cost of Free Basic Services provided – – – 9 008 9 008 9 008 5 200 5 200 5 200 5 200 Revenue cost of free services provided – – – – – – – – – – Households below minimum service level
Water: – – – 20 20 20 29 29 29 29 Sanitation/sewerage: – – – – – – – – – – Energy: – – – – – – 17 17 17 17 Refuse: – – – – – – – – – –
2018/19 Medium Term Revenue & Expenditure Framework
Current Year 2017/18 Choose name from list - Table A1 Budget Summary