2017‐2018
2017-2018 TO 2019-2020
MEDIUM TERM REVENUE AND
EXPENDITURE FRAMEWORK
Table of Contents
... 6
PART 1 – ANNUAL DRAFT BUDGET ... 7
1.1 Mayor’s Report ... 7
1.2 Council Resolution ... 11
1.3 EXECUTIVE SUMMARY ... 12
1.3.1 Introduction ... 12
1.3.2 Strategic priorities for 2017‐2018 ... 13
1.3.3 Challenges ... 17
1.3.4 Budget principles and guidelines that directly informed the compilation of the 2017‐2018 draft MTREF ... 18
1.4 Operating Revenue Framework ... 19
1.4.1 Sale of water and impact on tariff increases ... 23
1.4.2 Sale of electricity and impact on tariff increases ... 24
1.4.2 Sanitation and impact on tariff increases ... 25
1.5 Operating Expenditure Framework ... 26
1.6 Capital expenditure ... 29
1.7 Annual Budget tables ... 32
2.2.1 Strategic objectives ... 47
2.3 Measurable performance objectives and indicators ... 52
2.3.1 Performance indicators and benchmarks ... 58
2.3.2 Free Basic Services: basic social services package for indigent households ... 59
2.4 Overview of budget related‐policies ... 60
2.4.1 Asset Management Policy ... 60
2.4.2 Supply Chain Management Policy ... 61
2.4.3 Expenditure management policy ... 62
2.4.4 Risk management framework and risk management policy ... 62
2.4.5 Indigent policy ... 62
2.5 Overview of budget assumptions ... 63
2.6 Overview of budget funding ... 66
2.6 Expenditure on grants and reconciliations of unspent funds ... 83
2.7 Councillor and employee benefits Table 37: MBRR SA22 ‐ Summary of councilor and staff benefits ... 85
2.9 Monthly targets for revenue, expenditure and cash flow ... 89
2.10 Annual budgets and SDBIPs – internal departments ... 95
2.11 Contracts having future budgetary implications ... 96
2.12 Capital expenditure details ... 96
2.13 Legislation compliance status ... 107
2.14 Other supporting documents ... 108
2.18 Municipal manager’s quality certificate ... 116
List of Tables
Table 1: Consolidated Overview of the 2013/14 MTREF ... 19
Table 2: Summary of revenue classified by main revenue source ... 20
Table 3: Operating Transfers and Grant Receipts ... 22
Table 4: Proposed Water Tariffs ... 23
Table 5: Comparison between current sanitation charges and increases ... 25
Table 6: Comparison between water charges and increases (domestic) ... 26
Table 7: Summary of operating expenditure by standard classification item ... 27
Table 8: Capital budget per vote ... 29
Table 9: Consolidated Annual Budget Summary ... 32
Table 10: Consolidated budget financial performance (Revenue and expenditure by standard classification)... 33
Table 11: Consolidated Budget Financial Performance (revenue and expenditure by municipal vote) .... 34
Table 12: Consolidated budgeted financial performance and revenue expenditure ... 35
Table 13: Consolidated capital expenditure by vote standard classification and funding ... 36
Table 14: Consolidated budgeted financial position ... 37
Table 15: Consolidated budgeted cash flow ... 38
Table 16: Consolidated cash backed reserves/accumulated surplus reconciliation ... 38
Table 17: Consolidated assets management ... 38
Table 18: Consolidated basic service delivery measurement ... 40
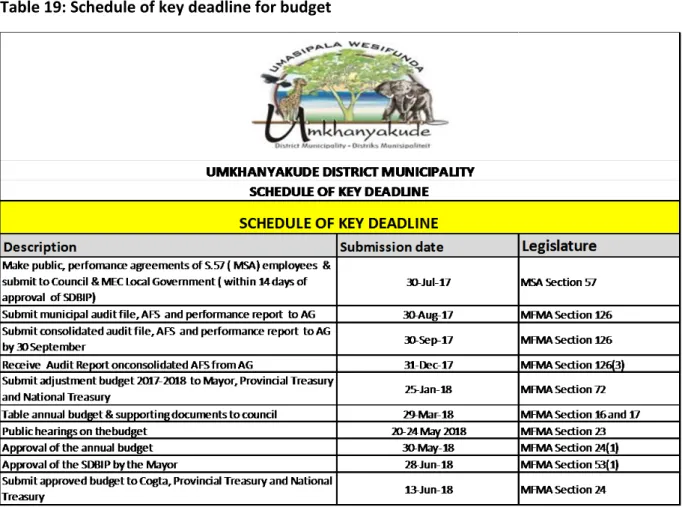
Table 19: Schedule of key deadline for budget ... 43
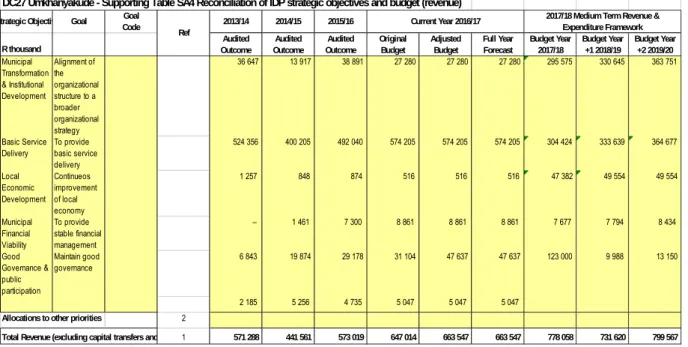
Table 20:MBRR Table SA4 ‐ Reconciliation between the IDP strategic objectives and budgeted revenue 49 Table 21: MBRR Table SA5 ‐ Reconciliation between the IDP strategic objectives and budgeted operating expenditure ... 50
Table 22: MBRR Table SA6 ‐ Reconciliation between the IDP strategic objectives and budgeted capital expenditure ... 51
Table 23: MBRR Table SA7 ‐ Measurable performance objectives ... 56
Table 24:MBRR Table SA8 ‐ Performance indicators and benchmarks ... 57
Table 25: Medium‐term outlook: operating revenue ... 66
Table 26: Proposed tariff increases over the medium‐term ... 68
Table 27: MBRR SA 15 Investment particular by type ... 69
Table 39: MBRR SA24 – Summary of personnel numbers ... 88
Table 40: MBRR SA25 ‐ Budgeted monthly revenue and expenditure ... 89
Table 41: MBRR SA26 ‐ Budgeted monthly revenue and expenditure (municipal vote) ... 91
Table 42: MBRR SA27 ‐ Budgeted monthly revenue and expenditure (standard classification) ... 92
Table 43: MBRR SA28 ‐ Budgeted monthly capital expenditure (municipal vote) ... 92
Table 44: MBRR SA29 ‐ Budgeted monthly capital expenditure (standard classification) ... 93
Table 45: MBRR SA30 ‐ Budgeted monthly cash flow ... 94
Table 46: Water Services Department ‐ operating revenue by source, expenditure by type and total capital expenditure ... 95
Table 47: MBRR SA34a – Capital expenditure on new assets by assets class ... 97
Table 48 MBRR SA34b ‐ Capital expenditure on the renewal of existing assets by asset class ... 98
Table 49: MBRR SA35 ‐ Future financial implications of the capital budget ... 101
Table 50: MBRR SA36 ‐ Detailed capital budget per municipal vote ... 103
Table 51: MBRR SA37 ‐ Projects delayed from previous financial year ... 105
Table 52: MBRR Table SA1 ‐ Supporting detail to budgeted financial performance ... 109
Table 53: MBRR Table SA2 – Matrix financial performance budget (revenue source/expenditure type and department) ... 111
Table 54: MBRR Table SA3 – Supporting detail to Statement of Financial Position ... 112
Table 55: MBRR SA9 – Social, economic and demographic statistics and assumptions ... 113
Table 56: MBRR SA32 – List of external mechanisms ... 115
List of Figures Figure 1: Main operational expenditure categories for the 2013/14 financial year ... 29
Figure 2: Planning, budgeting and reporting cycle ... 53
Figure 3: Definition of performance information concepts ... 55
Figure 4: Breakdown of operating revenue over the 2013/14 MTREF ... 66
Figure 5: Medium‐term outlook: capital revenue ... 71
Figure 6: Growth in outstanding borrowings (long‐term liabilities) ... 73
Figure 7: Cash and cash equivalents/cash backed reserves and accumulated funds ... 77
Abbreviations and Acronyms AMR Automated Meter Reading BPC Budget Planning Committee CBD Central Business District CFO Chief Financial Officer CPI Consumer Price Index
CRRF Capital Replacement Reserve Fund DBSA Development Bank of South Africa DoRA Division of Revenue Act
DWA Department of Water Affairs EE Employment Equity
EM Executive Mayor FBS Free basic services
GAMAP Generally Accepted Municipal Accounting Practice GDP Gross domestic product
GFS Government Financial Statistics
GRAP General Recognised Accounting Practice
HR Human Resources
IDP Integrated Development Plan IT Information Technology kℓ kilolitre
km kilometre
KPA Key Performance Area KPI Key Performance Indicator kWh kilowatt
ℓ litre
LED Local Economic Development MEC Member of the Executive Committee MFMA Municipal Financial Management Act MIG Municipal Infrastructure Grant
MPRA Municipal Properties Rates Act MSA Municipal Systems Act
MTEF Medium‐term Expenditure Framework
MTREF Medium‐term Revenue and Expenditure Framework NERSA National Electricity Regulator South Africa
PMS Performance Management System
PPE Property Plant and Equipment
PPP Public Private Partnership
UMKHANYAKUDE DISTRICT MUNICIPALITY MAYOR’S REPORT
FINAL BUDGET 2017-2018
PART 1 – ANNUAL BUDGET
1.1 Mayor’s Report
UMkhanyakude District Municipality have limited financial resources to satisfy the unlimited needs of the people. Therefore as the municipality we need to use our financial resources wisely by eliminating non-priority items in our budget.
The council of the municipality have the responsibility to eradicate the high volume of the service delivery backlogs particularly in the infrastructure of the water and sanitation in the whole area of UMkhanyakude District. The more attention should be focused on an outdated and aging infrastructure that end up instigating huge losses of water and interrupt the services delivery to the community.
The municipality is faced with challenge of high unemployment rate with the high rate of indigent households, and this affect the debt collection of the municipality. Based on that from the portion of the equitable share the municipality will allocate the funds to free basic services to cater for the poor.
The budget for UMkhanyakude District is more focused on the services delivery strategic priorities that were approved by the council of the municipality, which are as following:
Sanitation/sewerage
Water crisis
Environmental health
Economic, Social or Community and Skill Development
Revenue enhancement
In order for the municipality to ensure the smooth implementation of the above mentioned strategic priority we need to device good communication techniques between the municipality, community and other stakeholders. This should include communicating the IDP, Budget, SDBIP, Performance reports/Annual Reports, setting of targets etc., to ensure that we are all striving for the same achievements.
UMkhanyakude District will ensure that all employees of the municipality are subscribed to Batho Pele principles. The 2017-2018 final budget will be published and communicated to the community after the adoption by the council on the 31 May 2017.
_______________________________________
Cllr T.S Mkhombo
The Mayor: UMkhanyakude District Municipality
The total consolidated operating revenue budget and capital budget for uMkhanyakude District Municipality is R656 million below is the summary.
The summarised consolidated final budget 2017-2018 for UMkhanyakude District Municipality:
The following are the allocation-in-kind for UMkhanyakude as per Division of Revenue Act
Summary of Allocation‐ in ‐kind
Allocations‐In‐Kind Project name Benefiting municipality
Draft Budget 2017‐
2018 Regional Bulk Infrastructure Grant
Pongolapoort Bulk
Water Scheme Jozini Local Municipality 119 000 000
Dukuduku
Consolidated Operating Final budget 2017-2018
Consolidated Capital Budget 2017-2018
DC27 Umkhanyakude - Table A4 Consolidated Budgeted Financial Performance (revenue and expenditure)
Description Ref
R thousand 1 Budget Year 2017/18 Budget Year +1
2018/19
Budget Year +2 2019/20 Revenue By Source
Property rates 2 – – – Service charges - electricity revenue 2 6 849 7 239 7 645 Service charges - water revenue 2 28 562 30 190 30 259 Service charges - sanitation revenue 2 258 272 288 Rental of facilities and equipment 137 145 153 Interest earned - external investments 4 256 4 499 4 751 Transfers and subsidies 346 343 390 975 429 164
Other revenue 2 12 052 12 738 13 452
Total Revenue (excluding capital transfers and contributions)
398 457
446 059 485 712
Expenditure By Type
Employee related costs 2 136 793 144 560 152 625 Remuneration of councillors 8 940 9 387 9 857 Debt impairment 3 18 028 39 055 20 122 Depreciation & asset impairment 2 45 009 56 354 58 549 Finance charges 1 499 1 584 1 673
Bulk purchases 2 89 912 86 787 105 831
Other materials 8 35 330 38 631 62 392 Contracted services 24 355 25 971 28 649 Transfers and subsidies – – – Other expenditure 4, 5 38 590 43 730 46 013 Loss on disposal of PPE – – – Total Expenditure 398 457 446 059 485 712 Surplus/(Deficit) (0) (0) –
2017/18 Medium Term Revenue & Expenditure Framework
Capital Grants
Description Draft Budget 2017‐2018 Draft Budget year+1 2018‐2019
Draft Budget year+2 2019‐
2020
Capital Grants
MIG (excluding PMU) 207 964 500 220 560 550 233 854 850
Water Services Infrastructure Grant 50 000 000 65 000 000 80 000 000
Total capital grants 257 964 500 285 560 550 313 854 850
1.2 Council Resolution
Signed and attached
1.3 EXECUTIVE SUMMARY
1.3.1 Introduction
The final budget 2017-2018 proposed a total consolidated amount of R656 million which has been developed with an overall planning framework and includes programme and projects to achieve the municipality’s strategic objectives. This final budget is working towards appearing to the reality of the need of water in the community, addressing issues of unemployment, poverty, inequality and ensuring of rendering the sustainable services delivery to UMkhanyakude District.
An amount of R398 million has been allocated to the operational budget and the capital budget for the infrastructure is R 257 million. The projection for the service charges and other income included is R 48 million. The overall budget for UMkhanyakude District Municipality is R656 million.
The entity (UMhlosinga Development) of UMkhanyakude has a budget of R11 million, when consolidating the parent municipality’s budget it adds up to R656 million.
The Final Medium-Term Revenue and Expenditure Frame Work is released for the
consultation of the community, business, internal and external stakeholders, so they can
have the influence in the area of UMkhanyakude. The budget enables the
implementation of our goals as set out on the Integrated Development Plan.
1.3.2 Strategic priorities for 2017-2018
The following are the Nine (9) key priority areas of uMkhanyakude District Municipality:
Water
Sanitation/Sewerage;
Environmental Health;
Economics, Social or Community and Skills Development
Poverty eradication and Food Security;
Revenue enhancement;
Spatial planning and development;
Communication and Information Technology (IT); and
Good Governance and Clean Administration.
The municipality has identified all of the above priorities and also the municipality’s objectives and strategies that need to be addressed:
OBJECTIVES AND STRATEGIES FOR 2017/2018 FINANCIAL YEAR
KPA 1: MUNICIPAL TRANSFORMATION AND INSTITUTIONAL DEVELOPMENT OBJECTIVES
To ensure effective Organizational Performance Management System (PMS)
To ensure effective integrated development planning (IDP)
Adherence to evolving technology
To ensure adherence to Occupational Health and Safety Act To ensure effective and efficient administrative services To ensure effective and efficient legal services
STRATEGIES
Council adoption of PMS Council adoption of IDP
Council adoption of Human Resources Development Strategy Council Adoption of Workplace Skills Plan
Council adoption of Employment Equity Plan
Conducting assessment on effectiveness of Records Management System Conduct an assessment on effectiveness of provision of ICT services Conduct Health and Safety Risk assessments
Conduct an assessment on provision of administrative support services Conduct an assessment on provision of legal services
KPA 2: BASIC SERVICE DELIVERY OBJECTIVE
To provide high quality infrastructure network to support improved quality of life and economic growth
STRATEGIES
Implementation of projects for all households to access basic water services supported by high quality infrastructure.
Implementation of projects for all households to access basic sanitation services supported by high quality infrastructure.
Ensure functional electricity services for Ingwavuma and KwaMsane areas.
Planning and implementation of support programmes aimed at Improving coverage and quality of infrastructure within the District.
KPA 3: LOCAL ECONOMIC DEVELOPMENT OBJECTIVE
To expand district economic output and increase quantity and quality of employment opportunities
STRATEGIES
Conduct an assessment on the role of agricultural and forestry sector in district economic growth and employment creation
Conduct an assessment on the role of conservation and a diversified tourism sector in District economic growth
Increase in business skills levels of the district labour force
Conduct an assessment on improved quality of employment opportunities and income
levels of employed population
To Implement Revenue Collection Strategy To improve expenditure management To Improve Financial Management
To Effectively Implement Supply Chain Management Regulations STRATEGIES
Develop and implement cash flow management plans Develop and implement cash and credit management plans
Develop a credible budget and report in accordance with the provisions of the MFMA Development of a Procurement Plan
Assessment of service providers’ performance
KPA 5: GOOD GOVERNANCE AND PUBLIC PARTICIPATION OBJECTIVES
To improve the quality of life and life expectancy for people living within UMkhanyakude District
To ensure excellence in governance and leadership STRATEGIES
Implementation of Special Programmes
Implementation of Environmental Health Management Programmes Functionality assessment of Risk management programmes
Functionality assessment of committees responsible for oversight in the Municipality
Regular public participation in municipal businesses
Functionality assessment of IGR programmes
Functionality assessment of Council committees and structures KPA 6: CROSS CUTTING INTERVENTIONS
OBJECTIVES
To ensure integrity and quality of physical environment underpinned by a coherent spatial development pattern
To ensure functional and responsive Disaster Management Unit
National Treasury’s MFMA Circular No. 85 and 86 was used to guide the compilation of the 2017-2018 draft MTREF.
STRATEGIES
Conduct an assessment of environmental integrity of the District and its resources
Implement a functionally structured spatial development pattern guided by identified nodes and corridors through an effective land use management system
Conduct an assessment on effectiveness of prevention, mitigation and response to Disasters within the District
1.3.3 Challenges
The main challenges experienced during the compilation of the 2017-2018 draft MTREF can be summarised as follows:
Aging and poorly maintained water, roads and electricity infrastructure;
The increased cost of bulk water and electricity (due to tariff increases from Water and Eskom), which is placing upward pressure on service tariffs to residents. Continuous high tariff increases are not sustainable - as there will be point where services will no- longer be affordable;
Wage increases for municipal staff that continue to exceed consumer inflation, as well as the need to fill critical vacancies; and
Affordability of capital projects – original allocations had to be reduced and the operational expenditure associated with prior year’s capital investments needed to be factored into the budget as part of the 2017-2018 MTREF process
1.3.4 Budget principles and guidelines that directly informed the compilation of the 2017-2018 final MTREF
The 2016-2017 Adjustments Budget priorities and targets, as well as the base line allocations contained in that Adjustments Budget were adopted as the upper limits for the new baselines for the 2017-2018 annual budget;
Intermediate service level standards were used to inform the measurable objectives, targets and backlog eradication goals;
Tariff increases should be affordable and should generally not exceed inflation as measured by the CPI, except where there are price increases in the inputs of services that are beyond the control of the municipality, for instance the cost of bulk water and electricity. In addition, tariffs need to remain or move towards being cost reflective, and should take into account the need to address infrastructure backlogs;
There will be no budget allocated to national and provincial funded projects unless the necessary grants to the municipality are reflected in the national and provincial budget and have been gazetted as required by the annual Division of Revenue Act;
The following table is a consolidated overview of the proposed 2017-2018 Medium-term Revenue and Expenditure Framework:
Table 1: Consolidated Overview of the 2017‐2018 MTREF
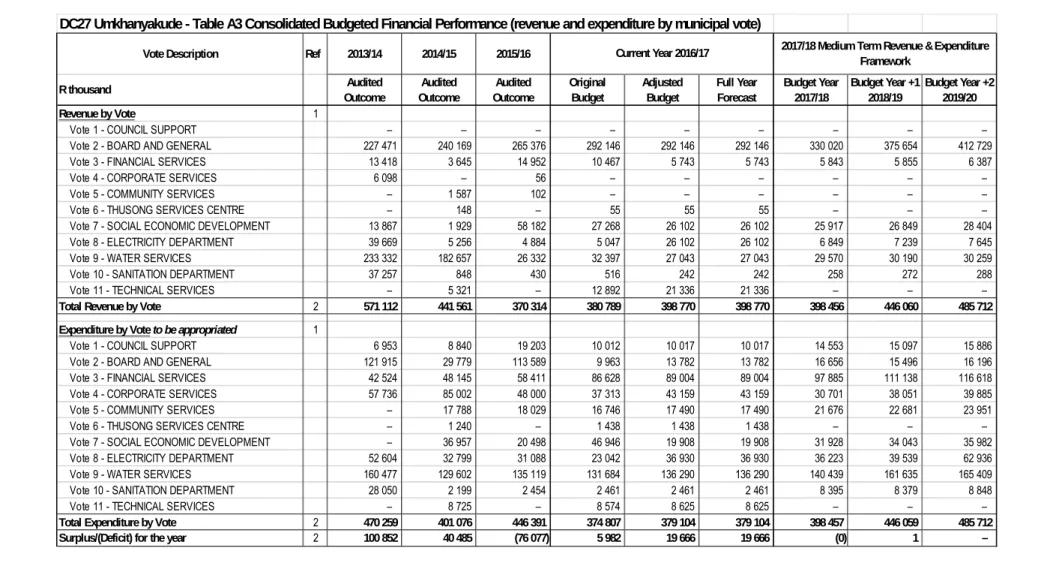
The consolidated operating revenue for both parent municipality and the entity of the municipality is R398 million, 4.7 per cent compared to adjustment budget for 2016-2017.
For the two outer years, operational revenue will increase by 11 per cent and 9 per cent respectively, equating to a total revenue growth of R 32 million and R44 respectively over the MTREF consolidated.
Total consolidated operating expenditure for the 2017-2018 financial year has been appropriated at 1 per cent increase when compared to the 2016/17 Adjustments Budget and by 9 per cent and 9 per cent for each of the respective outer years of the MTREF.
The capital budget decrease with R26 million in the compared to adjustment budget 2016/17 financial year, then increased in 2017/18 with R 27 million and 2018/19 increased with R28 million
1.4 Operating Revenue Framework
DC27 Umkhanyakude - Table A4 Consolidated Budgeted Financial Performance (revenue and expenditure)
Description Ref
R thousand 1 Budget Year
2017/18
Budget Year +1 2018/19
Budget Year +2 2019/20 Total Revenue (excluding capital transfers and
contributions)
398 457
446 059 485 712
Total Expenditure 398 457 446 059 485 712 Surplus/(Deficit) (0) (0) –
2017/18 Medium Term Revenue & Expenditure
Framework
relation to tariff increases and balancing expenditures against realistically anticipated revenues.
The municipality’s revenue strategy is built around the following key components:
National Treasury’s guidelines and macroeconomic policy;
Growth in the municipality and continued economic development;
Efficient revenue management
Achievement of full cost recovery of specific user charges especially in relation to trading services;
Determining the tariff escalation rate by establishing/calculating the revenue requirement of each service;
Increase ability to extend new services and recover costs;
The municipality’s Indigent Policy and rendering of free basic services; and
Tariff policies of the municipality.
The following table is a consolidated summary of the 2017-2018 MTREF (classified by main revenue source):
Table 2: Summary of revenue classified by main revenue source
Description
R thousands Budget Year
2017/18
Budget Year +1 2018/19
Budget Year +2 2019/20 Financial Performance
Property rates – – –
Service charges 35 669 37 702 38 191
Investment revenue 4 256 4 499 4 751
Transfers recognised - operational 346 343 390 975 429 164
Other own revenue 12 190 12 883 13 606
Total Revenue (excluding capital transfers and contributions)
398 457
446 059 485 712
DC27 Umkhanyakude - Table A1 Consolidated Budget Summary
2017/18 Medium Term Revenue & Expenditure
Framework
In line with the formats prescribed by the Municipal Budget and Reporting Regulations, capital transfers and contributions are excluded from the operating statement, as inclusion of these revenue sources would distort the calculation of the operating surplus/deficit.
Revenue generated from services charges forms a significant percentage of the revenue basket for the municipality. Service charge revenues comprise of 8.7 per cent of the consolidated total revenue mix 2017/18. In the 2016/17 financial year, revenue from services charges totalled R35 million after the adjustment budget. In 2017/18 consolidated budget for service charges will increases to R35 million, R37 million and R38 million in the respective financial years of the MTREF. A notable trend is the increase in the total percentage revenue generated from services charges which increases with 8 per cent in 2016/17 after the adjustment budget that was because during the adjustment budget the municipality calculated the adjustment figure based on the actual during that period. Now the municipality has increased it actual revenue and conventional revenue budget increased with 8 per cent of the total revenue. The outer year’s percentage is 8 per cent in 2018/19. This growth can be mainly attributed to the increased share that the sale of electricity contributes to the total revenue mix, which in turn is due to rapid increases in the Eskom tariffs for bulk electricity.
Operating grants and transfers totals R346 million in the 2017-2018 financial year
gazetted for UMkhanyakude District municipality, including the Provincial Grants of the
entity (UMhlosinga Development Agency). Note that the year-on-year growth for the
2018/19 financial year is R44 million and then R33 million 2018/19 years. The following
table gives a breakdown of the various operating grants and subsidies allocated to the
municipality over the medium term as gazetted in Division of Revenue Act bill:
Table 3: Operating Transfers and Grant Receipts
Tariffs
Tariff-setting is an essential and strategic part of the compilation of any budget. When charges will be revised, local economic conditions, input costs and the affordability of services will be taken into account to ensure the financial sustainability of the UMkhanyakude. The municipality is under the review of current tariffs, based on that only the tariffs for commercial as well as departments will increase with 10 per cent rates.
National Treasury continues to encourage municipalities to keep increases in tariffs and other charges as low as possible.
It must also be appreciated that the consumer price index, as measured by CPI, is a good measure of the cost increases of goods and services relevant to municipalities.
The basket of goods and services utilised for the calculation of the CPI consist of items such as food, petrol and medical services, whereas the cost drivers of a municipality are informed by items such as the cost of remuneration, bulk purchases of electricity and water, petrol, diesel, chemicals, cement etc.
UMKHANYAKUDE DISTRICT MUNICIPALITY FINAL BUDGET 2017‐2018
Operating grants
Description Final Budget 2017‐2018 Final Budget year +1 2018‐2019 Final Budget year+2 2019‐2020 Equitable Share 295,575,000.00 330,645,000.00 363,751,000.00 RCS Levies Replacement 34,445,000.00 45,009,000.00 48,978,000.00
FMG 1,250,000.00 1,000,000.00 1,260,000.00
Expanded Public Works Programme 1,008,000.00 ‐ ‐
PMU 10,945,500.00 11,608,450.00 12,308,150.00
Rural Road Assets Management System 2,619,000.00 2,713,000.00 2,867,000.00
Ingodini Study Grant 500,000.00 ‐ ‐
TOTAL OPERATING GRANTS 346,342,500.00 390,975,450.00 429,164,150.00
Table 4: Proposed Water Tariffs
PROPOSED CHARGES AND TARIFFS 2017-2018
ANNEXURE B: Consumptions charge s and tariffs
Des cri pti on Ra te Des cri pti on 10% i ncrea s e
Wa ter Wa ter
Res i denti a l Res i denti a l
0‐6 Free 0‐6 Free
0‐20 6.69 0‐20 7.36
21‐30 10.37 21‐30 11.41
31‐40 12.55 31‐40 13.81
40‐50 15.38 40‐50 16.2
50> 19.87 50> 21.86
Commerci a l Commerci a l
0‐20 13.1 0‐20 14.41
0‐30 15.94 21‐30 17.54
0‐40 16.89 31‐40 18.59
0‐50 18.76 41‐50 20.64
51> 22.51 51> 24.76
Government Government
0‐20 13.1 0‐20 14.41
0‐30 15.94 21‐30 17.54
0‐40 16.89 31‐40 18.59
0‐50 18.76 41‐50 20.64
51> 22.51 51> 24.76
Bul k 11.86
R 650.00
Cons umer depos i t Domes ti c 2x a ve cons umpti on mi ni mum
Area
Al l a rea i n DC27
UMkhanyakude District Municipality Water Tariffs for 2017/18 2016/2017
Proposed 2017/2018
Water tariffs are fully cost-reflective – including the cost of maintenance and renewal of purification plants, water networks and the cost associated with reticulation expansion;
Water tariffs are structured to protect basic levels of service and ensure the provision of free water to the poorest of the poor (indigent); and
Water tariffs are designed to encourage efficient and sustainable consumption.
In addition National Treasury has urged all municipalities to ensure that water tariff structures are cost reflective by 2017. Better maintenance of infrastructure will ensure that the supply challenges are managed in future to ensure sustainability. A tariff increase of 10 per cent from 1 July 2017 for water is proposed for the commercials. In addition 6 kℓ water per 30-day period will again be granted free of charge to all residents. The total number of household who receive the free basic services is 18702, and total kilolitres is 112212. The number of household without water will decrease, as the municipality will ensure that the water reaches the community target to reach 2017- 2018.
A summary of the proposed tariffs for households (residential) and non-residential are as follows:
1.4.2 Sale of electricity and impact on tariff increases
NERSA has announced the revised bulk electricity pricing structure. A 2.2 per cent
increase in the Eskom bulk electricity tariff to municipalities will be effective from 1 July
2017. This is in line with the approved ESKOM tariff increase of 2.2 percent approved
by the National Energy Regulatory of South Africa (NERSA) for the 2017/2018 as stated
in MFMA Circular 86. The billing amount will increase with 6.4 per cent in all, due to the
increase in the electricity demand in the area of Ingwavuma and kwaMsane. The
municipality considered the prior year trend and considered that during the mid-year
assessment the electricity billing was behind as a result the municipality during the mid-
year assessment was sitting at 36.1 percent instead of at least 50 percent.
It should be noted that given the magnitude of the tariff increase with 2.2 percent, it is expected to increase growth in electricity consumption, which will have a positive impact on the municipality’s revenue from electricity.
1.4.2 Sanitation and impact on tariff increases
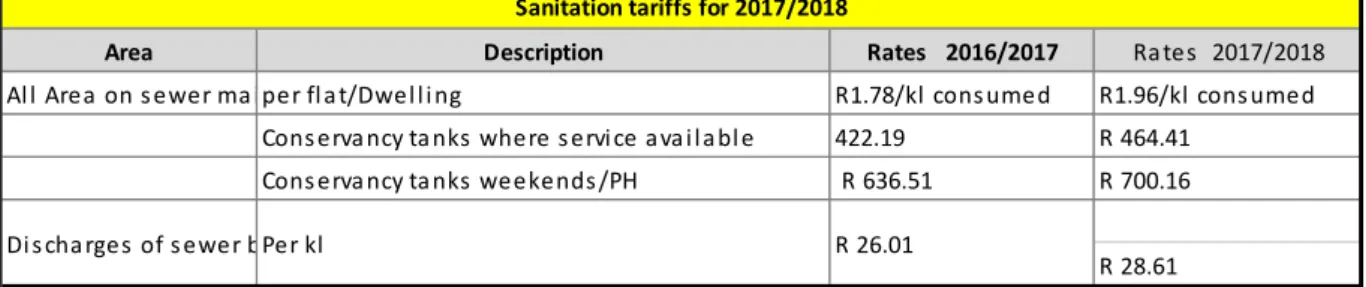
A tariff increase of 6.6 per cent for sanitation from 1 July 2017 is proposed. This is based on the input cost assumptions related to water. It should be noted that electricity costs contributes approximately 20 per cent of waste water treatment input costs, therefore the higher than 10 per cent for sanitation tariffs. The following factors also contribute to the proposed tariff increase:
Sanitation charges are calculated according to the percentage water discharged as indicated in the table below;
The total revenue expected to be generated from rendering this service amounts to R1.5 million for the 2017-2018 financial year.
The following table compares the current and proposed tariffs:
Table 5: Comparison between current sanitation charges and increases
Area Description Rates 2016/2017 Ra tes 2017/2018
Al l Area on s ewer ma i per fl a t/Dwel l i ng R1.78/kl cons umed R1.96/kl cons umed Cons erva ncy ta nks where s ervi ce ava i l a bl e 422.19 R 464.41
Cons erva ncy ta nks weekends /PH R 636.51 R 700.16
R 28.61 Sanitation tariffs for 2017/2018
Di s cha rges of s ewer bPer kl R 26.01
1.4.5 Overall impact tariff increases on the household
The following table shows the overall expected impact of the tariff increases on a large and small household, as well as an indigent household receiving free basic services.
Table 6: Comparison between water charges and increases (domestic)
1.4.5 Other Revenue
The other revenue has decrease as the municipality will be no longer receive the refund from Department of Water Affairs. The other revenue consist of the UMhlosinga Development Agent revenue as per Service Level Agreement from departments that will fund the entity.
1.5 Operating Expenditure Framework
The municipality’s expenditure framework for the 2017-2018 budget and MTREF is informed by the following:
The asset replacement strategy and the repairs and maintenance plan;
Balanced budget constraint (operating expenditure should not exceed operating revenue) unless there are existing uncommitted cash-backed reserves to fund any deficit;
Funding of the budget over the medium-term as informed by Section 18 and 19 of the MFMA;
The capital programme is aligned to the asset management strategy
Operational gains and efficiencies will be directed to funding the capital budget and other core services; and
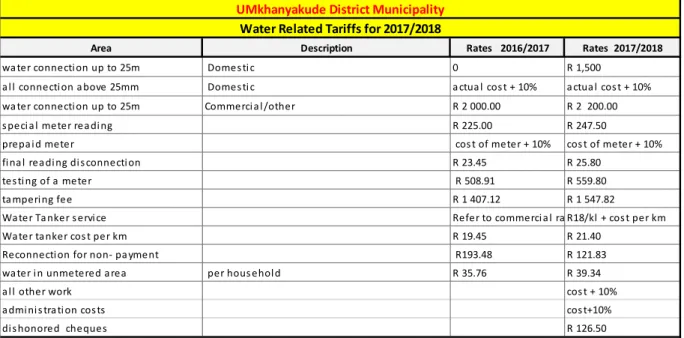
Area Description Rates 2016/2017 Rates 2017/2018
wa ter connecti on up to 25m Domes ti c 0 R 1,500
a l l connecti on a bove 25mm Domes ti c a ctua l cos t + 10% a ctua l cos t + 10%
wa ter connecti on up to 25m Commerci a l /other R 2 000.00 R 2 200.00
s peci a l meter rea di ng R 225.00 R 247.50
prepa i d meter cos t of meter + 10% cos t of meter + 10%
fi na l readi ng di s connecti on R 23.45 R 25.80
tes ti ng of a meter R 508.91 R 559.80
ta mperi ng fee R 1 407.12 R 1 547.82
Water Ta nker s ervi ce Refer to commerci a l ra R18/kl + cos t per km
Water tanker cos t per km R 19.45 R 21.40
Reconnecti on for non‐ pa yment R193.48 R 121.83
wa ter i n unmetered a rea per hous ehol d R 35.76 R 39.34
a l l other work cos t + 10%
a dmi ni s tra ti on cos ts cos t+10%
di s honored cheques R 126.50
UMkhanyakude District Municipality
Water Related Tariffs for 2017/2018
The following table is a high level summary of the 2017-2018 budget and MTREF (classified per main type of operating expenditure):
Table 7: Summary of operating expenditure by standard classification item
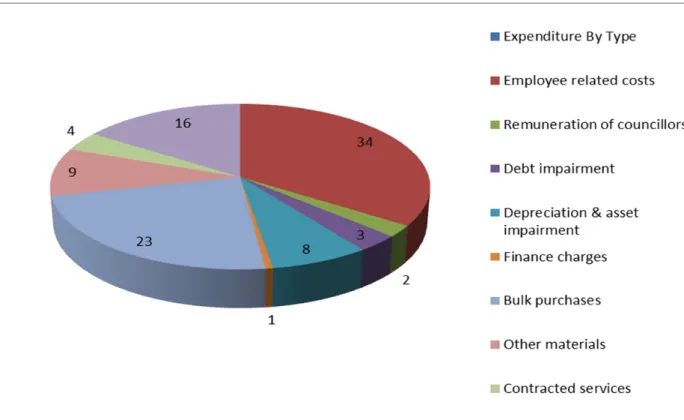
The budgeted allocation for employee related costs for the 2017-2018 financial year totals R136 million, which equals 34 per cent of the total operating expenditure the parent municipality. Based on MFMA circular number 86 guidelines the parent municipality increased the employees related cost with CPI rate plus 1 per cent. The total consolidated of employees related costs is R134 million for the parent and the entity of the municipality which is equal to 34 per cent of the consolidated operational expenditure budget. As part of the UMkhanyakude cost reprioritization and cash
DC27 Umkhanyakude - Table A4 Consolidated Budgeted Financial Performance (revenue and expenditure)
Description Ref
R thousand 1 Budget Year
2017/18
Budget Year +1 2018/19
Budget Year +2 2019/20 Expenditure By Type
Employee related costs 2 136 793 144 560 152 625 Remuneration of councillors 8 940 9 387 9 857 Debt impairment 3 18 028 39 055 20 122 Depreciation & asset impairment 2 45 009 56 354 58 549 Finance charges 1 499 1 584 1 673 Bulk purchases 2 89 912 86 787 105 831 Other materials 8 35 330 38 631 62 392 Contracted services 24 355 25 971 28 649 Transfers and subsidies – – – Other expenditure 4, 5 38 590 43 730 46 013 Loss on disposal of PPE – – – Total Expenditure 398 457 446 059 485 712
2017/18 Medium Term Revenue & Expenditure
Framework
The provision of debt impairment was determined based on the actual collection on monthly basis for the municipality and on the billing of debtors. The R18 million is set of against the billing provision on our revenue from receivables. The 7 per cent increase for outer years is based on the assumption of the increase of the receivables between comparative prior years. While this expenditure is considered to be a non-cash flow item, it informed the total cost associated with rendering the services of the municipality, as well as the municipality’s realistically anticipated revenues.
Depreciation is widely considered a proxy for the measurement of the rate asset consumption. Budget appropriations in this regard total R45 million for the 2017-2018 financial and equates to 11 per cent of the total operating expenditure. It is the per cent of the increase of the comparative prior years assets increase. This has resulted in a significant increase in depreciation relative to previous years.
Finance charges consist primarily of the repayment of interest on long-term borrowing (cost of capital). The municipality was in a process of settling the long-term loan in 2016-2017 and is not intending to have a long-term borrowing in 2017-2018, but since it is not finalised an amount of R1.4 million has been provided for interest charges and interest on bank accounts for the municipality.
Bulk purchases are directly informed by the purchase of electricity from Eskom and water for water purification and reticulation. The annual price increases have been factored into the budget appropriations and directly inform the revenue provisions. The expenditures include distribution losses.
Other materials comprise of amongst others the purchase of fuel, diesel, materials for maintenance, repairs, cleaning materials and chemicals. In line with the municipality repairs and maintenance plan this group of expenditure has been prioritised to ensure sustainability of the UMkhanyakude’s infrastructure.
Contracted services have been identified as a cost saving area for the municipality.
As part of the compilation of the 2017-2018 MTREF this group of expenditure was
critically evaluated and operational efficiencies were enforced. In the 2017-2018
financial year, this group of expenditure totals R35 million which equates 4 per cent,
clearly demonstrating the application of cost efficiencies.
Other expenditure comprises of various line items relating to the daily operations of the municipality. This group of expenditure has also been identified as an area in which cost savings and efficiencies can be achieved. Growth has been limited to 15 per cent for 2017-2018 including the other expenditure of the entity.
Figure 1: Main operational expenditure categories for the 2017-2018 financial year
1.6 Capital expenditure
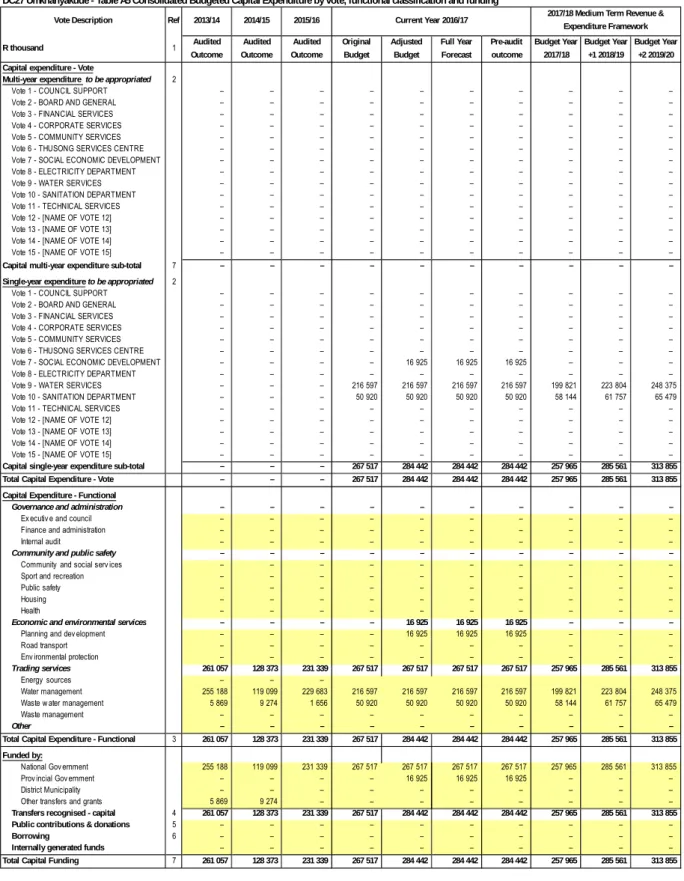
The following table provides a breakdown of budgeted capital expenditure by vote:
Table 8: Capital budget per vote
DC27 Umkhanyakude - Table A5 Consolidated Budgeted Capital Expenditure by vote, functional classification and funding
Vote Description Ref 2013/14 2014/15 2015/16
R thousand 1 Audited
Outcome
Audited Outcome
Audited Outcome
Original Budget
Adjusted Budget
Full Year Forecast
Pre-audit outcome
Budget Year 2017/18
Budget Year +1 2018/19
Budget Year +2 2019/20 Capital expenditure - Vote
Multi-year expenditure to be appropriated 2
Vote 1 - COUNCIL SUPPORT – – – – – – – – – – Vote 2 - BOARD AND GENERAL – – – – – – – – – – Vote 3 - FINANCIAL SERVICES – – – – – – – – – – Vote 4 - CORPORATE SERVICES – – – – – – – – – – Vote 5 - COMMUNITY SERVICES – – – – – – – – – – Vote 6 - THUSONG SERVICES CENTRE – – – – – – – – – – Vote 7 - SOCIAL ECONOMIC DEVELOPMENT – – – – – – – – – – Vote 8 - ELECTRICITY DEPARTMENT – – – – – – – – – – Vote 9 - WATER SERVICES – – – – – – – – – – Vote 10 - SANITATION DEPARTMENT – – – – – – – – – – Vote 11 - TECHNICAL SERVICES – – – – – – – – – – Vote 12 - [NAME OF VOTE 12] – – – – – – – – – – Vote 13 - [NAME OF VOTE 13] – – – – – – – – – – Vote 14 - [NAME OF VOTE 14] – – – – – – – – – – Vote 15 - [NAME OF VOTE 15] – – – – – – – – – – Capital multi-year expenditure sub-total 7 – – – – – – – – – – Single-year expenditure to be appropriated 2
Vote 1 - COUNCIL SUPPORT – – – – – – – – – – Vote 2 - BOARD AND GENERAL – – – – – – – – – – Vote 3 - FINANCIAL SERVICES – – – – – – – – – – Vote 4 - CORPORATE SERVICES – – – – – – – – – – Vote 5 - COMMUNITY SERVICES – – – – – – – – – – Vote 6 - THUSONG SERVICES CENTRE – – – – – – – – – – Vote 7 - SOCIAL ECONOMIC DEVELOPMENT – – – – 16 925 16 925 16 925 – – – Vote 8 - ELECTRICITY DEPARTMENT – – – – – – – – – – Vote 9 - WATER SERVICES – – – 216 597 216 597 216 597 216 597 199 821 223 804 248 375 Vote 10 - SANITATION DEPARTMENT – – – 50 920 50 920 50 920 50 920 58 144 61 757 65 479 Vote 11 - TECHNICAL SERVICES – – – – – – – – – – Vote 12 - [NAME OF VOTE 12] – – – – – – – – – – Vote 13 - [NAME OF VOTE 13] – – – – – – – – – – Vote 14 - [NAME OF VOTE 14] – – – – – – – – – – Vote 15 - [NAME OF VOTE 15] – – – – – – – – – – Capital single-year expenditure sub-total – – – 267 517 284 442 284 442 284 442 257 965 285 561 313 855 Total Capital Expenditure - Vote – – – 267 517 284 442 284 442 284 442 257 965 285 561 313 855 Capital Expenditure - Functional
Governance and administration