At Vyeboom, the agricultural land use had the highest number of captures (210) and the highest species richness (9) rodent species and 1 rodent. On the other hand, in Ka-Ndengeza, the use of agricultural land also had the highest catch (186) with the highest wealth of 7 types of rodents.
Background
Rodent pest control therefore not only has the potential to positively impact rural living conditions, but also reduce the potential for disease transmission. Therefore, this study aims to increase our understanding of rodent population cycles in response to land use changes.
Problem Statement
Such EBRM practices rely on a good understanding of pest rodent ecology, particularly population ecology (Singleton et al., 1999).
Research questions
Research Objectives
General objectives
Investigate rodent population dynamics and species composition under different land uses (cropping, grazing and settlement).
Research hypotheses
Significance of the Study
Expected outcomes
The expectation is that stomach contents of animals in areas of crops and settlements may contain high percentages of different crops, while stomach contents of animals from natural areas may contain high percentages of insects. We expected that most community members would be aware of rodent problems and also have a specific method of dealing with the problem.
Rodent damage in small holder farming communities
As such, there are still many unresolved research questions regarding the sustainable control of rodent pests under small farming conditions.
Rodent control in small-holder farming areas
Studies on integrated rural rodent management under replicated conditions are lacking, while it is important to evaluate its economic value compared to conventional management based on rodenticide chemicals. Limitations of Rodenticides for Rodent Pest Control on Small Farms If used correctly, rodenticides can be used successfully in rodent control.
The limitations of rodenticides to control rodent pests in small-holder farms If rodenticides are applied in a correct manner they can successfully be used in suppressing rodent
The concept of EBRM on small-holder farms
In recent years, rodenticides were the only solution farmers had to rely on in the crop fields and surrounding buildings (Pelz, 2001). However, in recent years it has been strongly emphasized that EBRM is the way to go for rodent management in both developed (Cowan et al., 2003) and developing countries (Belmain et al., 2003).
Rodents as indicator species of ecosystem integrity
From many studies, there has been a positive economic outcome with the adoption of EBRM (Davis et al., 2004). The perception of farmers practicing EBRM was changed and they began to switch to more ecologically benign methods of controlling rodent populations (Singleton et al., 2004).
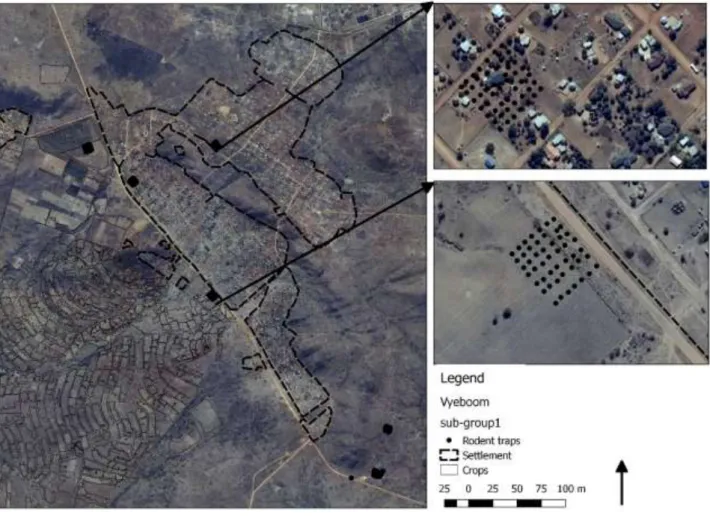
Location of the Study Areas
Vegetation of the study areas
- Grazing area
- Settlement areas
- Grazing areas
- Crop growing areas
- Settlement areas
This area is mainly used for livestock grazing where all the livestock around the community depend on the natural environment for grazing (Huduk, 1999). Crop residues from the sowing areas are also used for livestock feed in the dry season. The settlement areas are places of residence for small farmers, as well as non-farming community members.
Harvesting starts from February to the end of April, depending on the speed and strength of the different farmers.
Ethical Approval
Rodent trapping/population ecology
Live-trapping
Processing of sacrificed animals
The average percentage volume (PV - which is the contribution of a given food item to the volume of stomach contents) was estimated to be approximately 10% (Mulungu et al., 2014). The presence of starch was checked by adding an iodine solution to the stomach contents (Mulungu et al., 2014).
Questionnaire/Focus group discussions
Species diversity, composition and capture rate
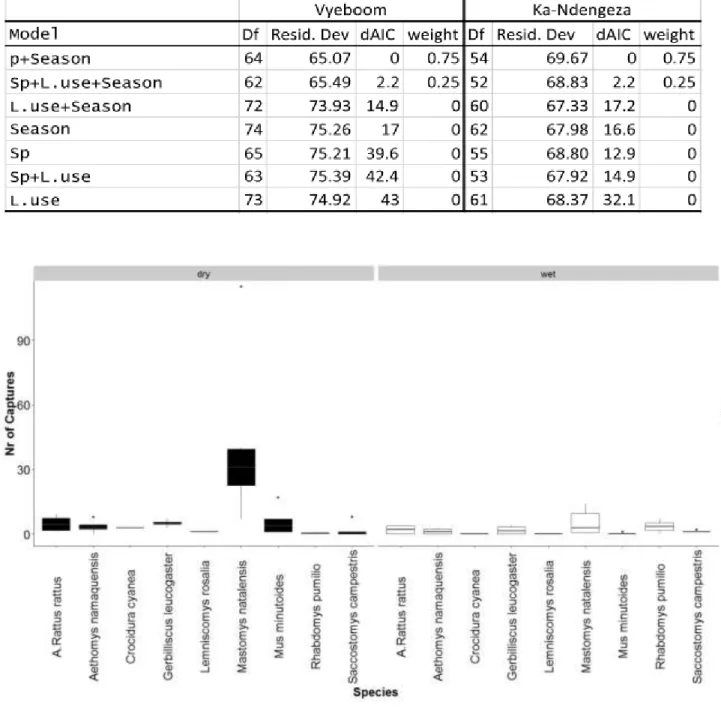
To compare species richness between different sites and land uses, as well as sampling adequacy, species accumulation curves were generated (Gotelli and Colwell, 2001). We used general linear models with a logit link function and Poisson distribution to investigate the effect of land use, species and season on rodent capture rate (number of rodents captured). Therefore, the work corrected for overdispersion using a negative binomial model (Ver Hoef & Boveng, 2007), and then modeled the effect of season, land use and species on the catch data.
We ranked models using Akaike information criterion (AIC) and considered models with >2 delta AIC as models with the most support (Mulungu et al., 2003: Burnham et al., 2011), and used AIC weight (w ) used to further guide variable importance.
Mark recapture model
The observation model essentially describes the degree of decay from the center of the home range (also defined as the center of activity) and is defined by the detection function. A half-normal detection function is commonly used and is defined by a scale parameter (sigma) and the encounter rate at the home range level (similar to detection probability; Efford, 2004). SECR models were then constructed to allow density to vary by session (Effort and Fewster 2013).
Akaike Information Criterion (AIC; Akaike, 1974) was used to select the most parsimonious models and models with a delta AIC >2 were considered to have equal support (Burnham et al., 2011).
Dietary analysis
SECR models also allow the inclusion of covariates to account for heterogeneity in both detection probability and density (Efford and Fewster, 2013). Therefore, the SECR model was adjusted to increase the likelihood that rodent density was modeled to vary with season, study site, and land use. To achieve this, each season (wet and dry), land use (crop cultivation, grazing and settlement), location (Vyeboom and Ndengeza) and species combination were combined into a separate session (e.g. Mastomys Ndengeza Dry Grazing).
The full session models were contrasted against a null model in which density was modeled as constant between sessions.
Rodent trapping/population ecology for Vyeboom and Ka-Ndengeza villages
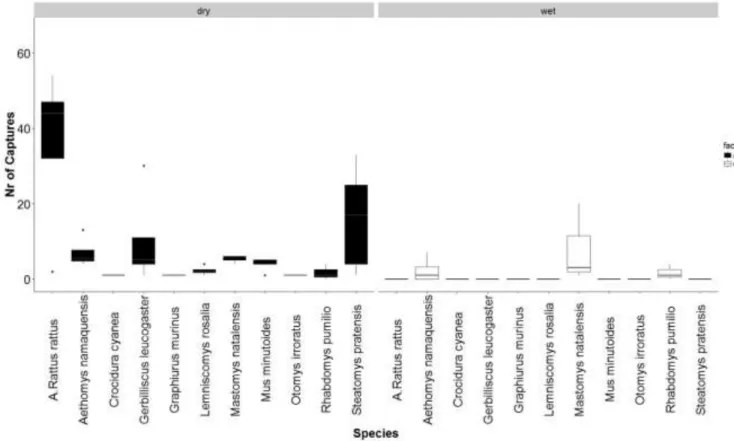
We also captured 2 rodents representing 1 rodent species from Vyeboom pastures (Table 1), while in Ka-Ndengeza using pastures we captured 11 rodents representing 4 rodent species (Table 1). At Vyeboom, a total of 10 rodents and 1 species of shrew were captured during the dry season, which is high compared to only 3 rodent species during the wet season (Table 1). On the other hand, the difference in the number of species captured in the dry and wet seasons in the Ka-Ndengeza area was 2, with the dry season having a total of 9 rodent species compared to the 7 rodent species captured in the wet season (Table 1).
University of Venda Table 1: Trap success of Vyeboom and Ndengeza for the dry and wet seasons.
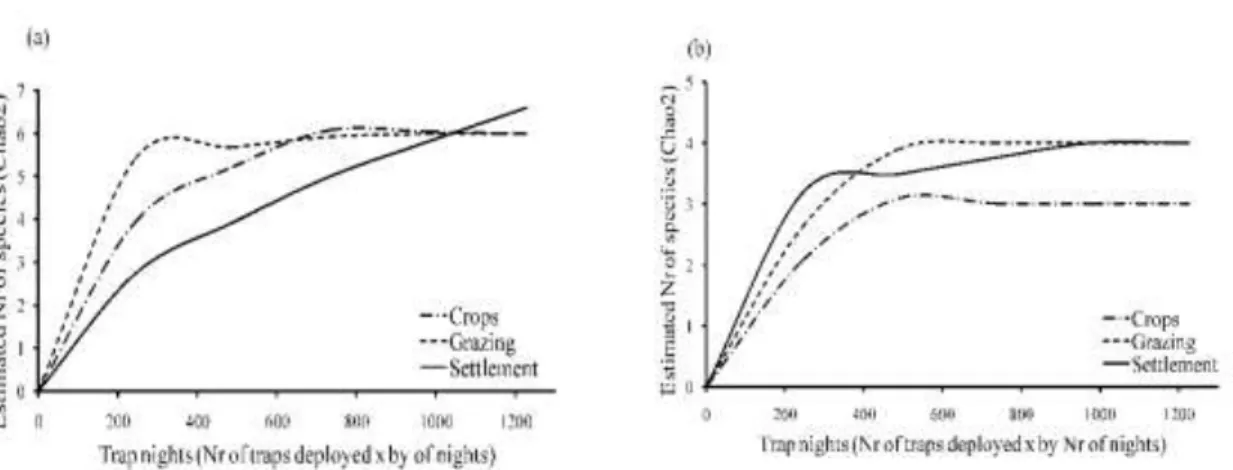
Species accumulation curves
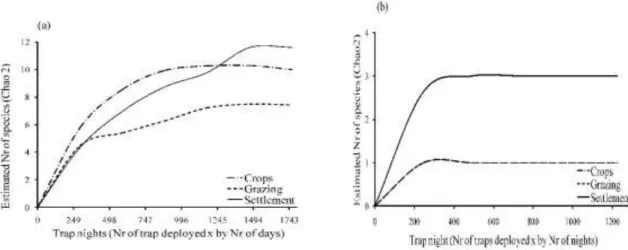
Species observed at Vyeboom and Ka-Ndengeza villages during dry and wet seasons At Vyeboom during dry season only the species accumulation graph representing the settlement
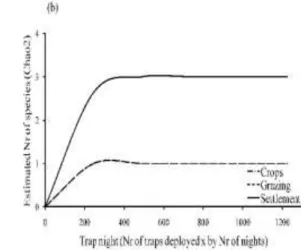
The dry season of Ka-Ndengeza only had the species accumulation plot representing rangeland land uses leveled at 1000 trap nights Fig 6(a). On the other hand, the species accumulation graphs representing crop land use and settlements did not reach an asymptote Fig 6(a). Like the different seasons, at Ka-Ndengeza during the wet season, species accumulation plots representing land and pasture uses reached an asymptote at 1000 trap nights Fig 6(b).
Only graph representing settlement land use did not flatten in this wet season at Ka-Ndengeza Fig 6(b).
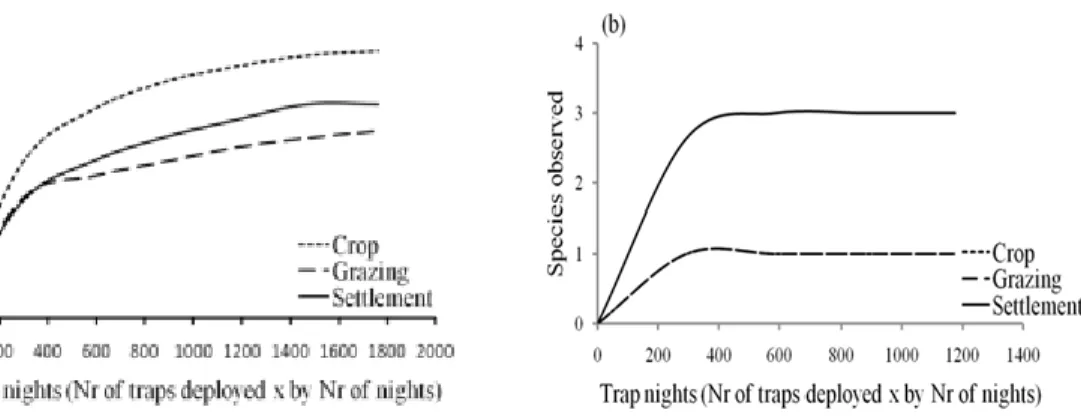
Species richness at Vyeboom and Ka-Ndengeza villages during both dry and wet seasons
The wet season in Ka-Ndengeza village had an equal number of species captured (4 species) for both settlement and grazing areas. Fig. 8(b), which was also the highest number of species captured in the entire village during the wet season.
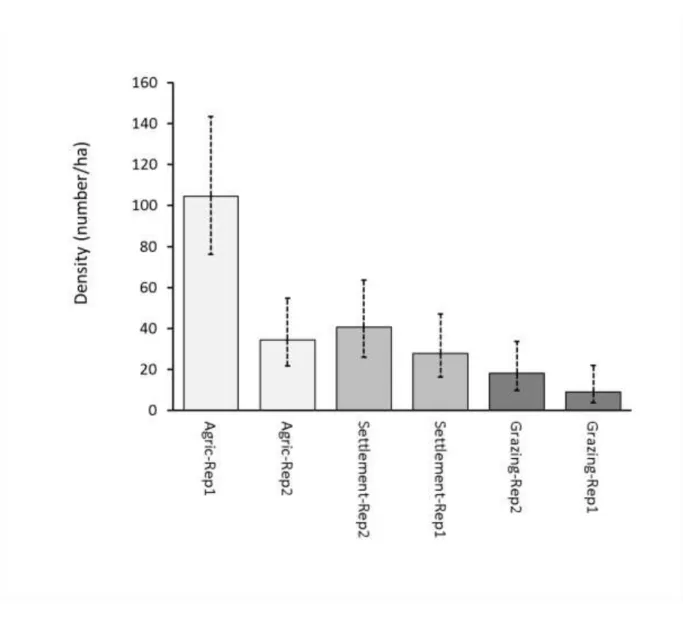
Rodent density
At Vyeboom, three species (G. leucogaster, R. rattus and S. pratensis) were captured in adequate sample sizes to enable density estimation.
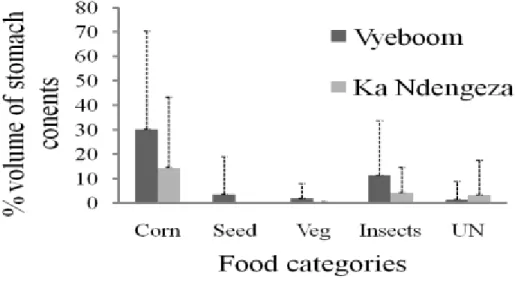
Dietary results
Stomachs from species from both villages seem to be mainly dominated by maize and insects, but seeds and vegetation have only been found on stomachs collected from Vyeboom, while none of the stomachs from Ka-Ndengeza contained seeds or vegetation (Fig. 11). On the other hand, the stomachs of rodents caught in the grazing areas contained food from all categories (corn (23%), seeds (12%), vegetation (5%) and insects 10%), excluding unidentified material . Finally, the stomach contents of rodents caught from settlement areas were dominated by 35% maize, 10% insects, 3% vegetation, 2% unidentified materials and 1% seeds.
While the stomach content of rodents from the use of pasture land was dominated by 22% seeds and 1% corn.
Impact of rodents in the livelihood of community members
- Community member’s opinion on whether rodents are a problem?
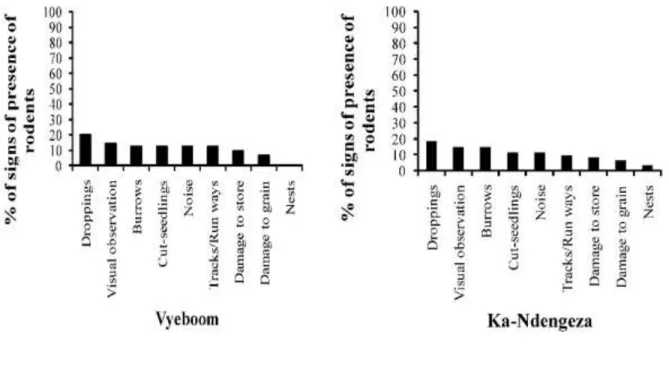
- Indicators of rodent problems in the land uses of Vyeboom and Ka-Ndengeza
- Community member’s opinion on area highly affected by rodent damage
- How large is problem – grain
- Rodent control
Members of the Ka-Ndengeza community rely on closing their storage areas (57%) for harvested crops and using poison (45%) on both harvested and field crops to control rodent damage (Fig. 17 ). The study site Vyeboom also had a higher number of rodents compared to the study site Ka-Ndengeza. The same applies to the land use for agricultural crops in both villages and according to (Makundi et al., 2007) Ka-Ndengeza is more disturbed than Vyeboom.
However, according to Monadjem (1999), the pasture use of Vyeboom is recovering and replanting and less disturbed compared to Ka-Ndengeza.
Rodent density
Rodent capture rates were affected by seasons, because during wet seasons, species and to a lesser extent land uses. And also different species favor different conditions, therefore, with different land uses that differ in terms of disturbance, rodents will respond differently, some will dominate disturbed land use while others dominate less disturbed area (Makundi et al., 2007). During both dry and wet season, there was a large variation in terms of observed species, species composition and species richness in both villages and different land uses, which can be attributed to the availability of food (Hieronimo et al., 2014).
Vyeboom had three rodent species with sample sizes to allow density estimation; however, the three rodent species dominated different land uses due to species adaptability to human disturbance which the study supported (Makundi et al., 2007).
Diet
M. natalensis diet
G. leucogaster diet
All respondents 100% from two study sites confirmed that rodents are a serious problem for their livelihood (Makundi et al., 2005: and Gadisa and Birhane, 2016). Both cities also reported seeing rodent droppings, rodent movement, and piles as evidence of the presence of rodents in their neighborhood, similar to what was reported by (Eisen et al., 2013). The current study has 46% respondents from Vyeboom and 68% respondents from Ka-Ndengeza agree with the study conducted in Tanzania and Ethiopia where they believed that rodents are pests that cause serious damage to agriculture (Makundi et al., 2005).
This is in contrast to what was reported by Eisen et al., (2013) where they reveal that different methods are used to protect crops in storage and their fields from rodents.
Importance of study for EBRM
As in Belmain and Nala, (2002) it was also found in this study that respondents from different villages (Vyeboom and Ka-Ndengeza) have different views when it comes to which part or land use is highly affected by rodents. However, respondents from both study sites believe that rodents cause serious damage to wheat in accordance with Gadisa and Birhane (2016). The majority of respondents in both villages put their faith in sealing their preserves and excessive use of poison with Vyeboom respondents extending their faith to the use of domestic cats and traps.
Conclusion
Recommendations
Small mammal community characteristics as indicators of ecological disturbance in the Willem Pretorius Nature Reserve, Free State, South Africa. AVENANT, N.L., WATSON, J.P. AND SCHULZE, E., 2008. The relationship between small mammal community characteristics and habitat and habitat integrity in the Caledon Nature Reserve, South Africa. Anticoagulant resistance in the Norway rat and guidelines for the management of rat attacks in the United Kingdom.
Impact of variation in land use intensity on species diversity and abundance of small mammals in the Nama Karoo, Namibia. MAKUNDI, R.H., MASSAWE, A.W, AND MULUNGU, L.S., 2007. Reproduction and population dynamics of Mastomys natalensis Smith, 1834 in an agricultural landscape in the West Usambara Mountains of Tanzania. Crop losses due to outbreaks of Mastomys natalensis (Smith, 1834) Muridae, Rodentia in the Lindi region of Tanzania.
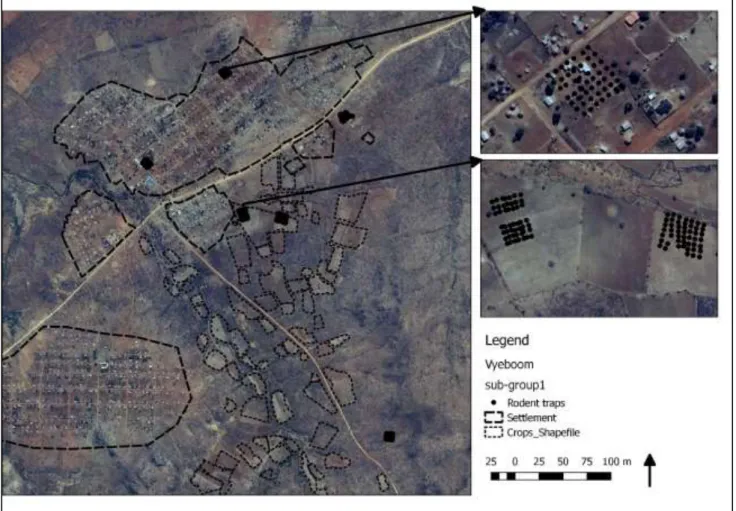
![Figure 1: Map showing the study sites (Vyeboom [top] and Ka-Ndengeza [bottom] study sites)](https://thumb-ap.123doks.com/thumbv2/pubpdfnet/10439740.0/21.892.90.811.114.617/figure-showing-study-sites-vyeboom-ndengeza-study-sites.webp)