The trace elements in the surrounding soil of the geothermal source were a result of geothermal water and soil pedogenesis. Acacia robusta and Mangifera indica ……….90 Figure 4.22: Percentage uptake concentrations of the average tracer per
Background of the research
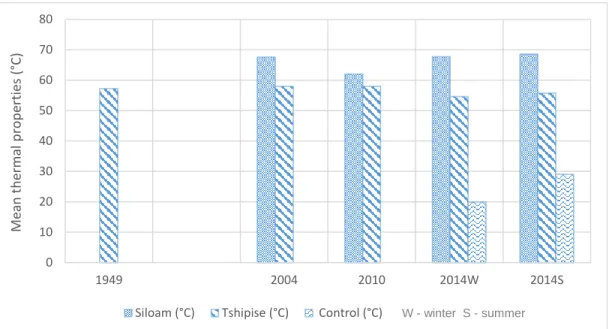
Previous works revealed that the Siloam and Tshipise springs are considered the hottest springs in the country with temperatures of 64 °C and 58 °C, respectively (Olivier et al., 2008). It has been established that these trace elements are present in these springs, so the long-term intake of water from these sources can be dangerous for human health (Olivier et al., 2011).
Statement of problem
Some of the trace elements such as iron (Fe), manganese (Mn), zinc (Zn), copper (Cu), cobalt (Co), molybdenum (Mo), vanadium (V) and nickel (Ni) are essential for. growth of organisms. Other trace elements: cadmium (Cd), lead (Pb), uranium (U), thallium (Tl), chromium (Cr), silver (Ag), mercury (Hg), arsenic (As) and selenium (Se) are toxic. to organisms.
Motivation
Objectives
The main objective
Specific objectives
Research Questions
Hypotheses
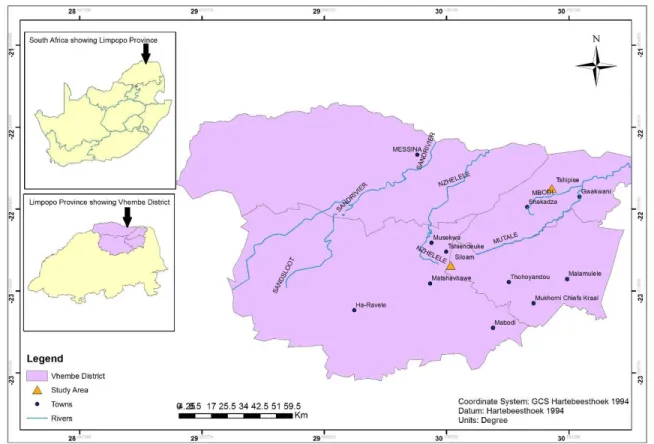
Study Area
Siloam Spring
The Siloam spring is found in the Nzhelele valley in the village of Siloam, which belongs to the youngest formation of the Soutpansberg group, i.e. the Sibasa formation. It is responsible for the more undulating topography south of the Soutpansberg (Brandl, 1986).
Tshipise Spring
It is dominated by basalt (Figure 1.2), which originates from the lava at the base of the Formation.
Preamble
Origin of geothermal springs
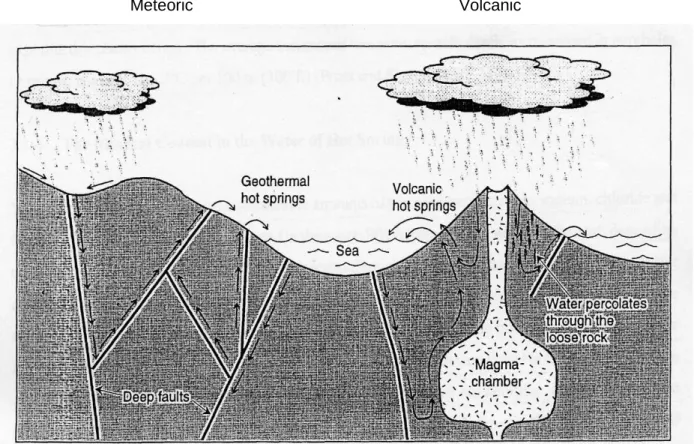
Geothermal springs of volcanic origin
Geothermal springs of meteoric origin
The source of water for geothermal springs in South Africa is meteoric rather than volcanic (Kent and Groeneveld, 1962; Gevers, 1963; Visser, 1989, Hoole, 2001), and the process is generally associated with faulting and shearing. Elements that can be found in geothermal sources include: As, B, Cl, Si, S, Rn many others (Brock, 1994).
Chemistry of geothermal spring
Carbonic acid in water reacts with calcium carbonate to form soluble calcium bicarbonate (equation 2). As the water rises to the surface, it cools and silica and other minerals precipitate.
Benefits of geothermal springs
- Religious and traditional benefits
- Medicinal benefits
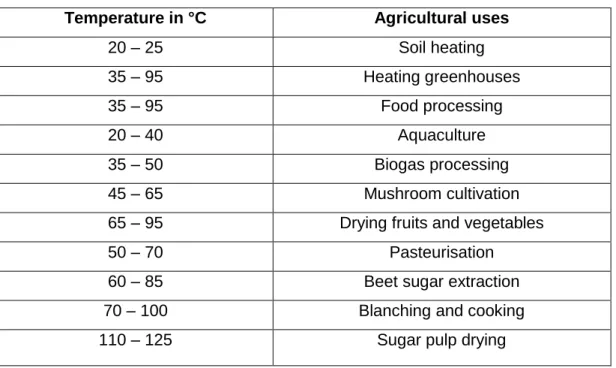
- Agricultural benefits
- Tourism and recreational benefits
Chinese have been using geothermal resources since the time of the Jin dynasty (AD 265-420) (La Moreaux and Tanner, 2001). Tshibalo (2011) reported that 31 of South Africa's known geothermal resources are used for recreation and tourism.
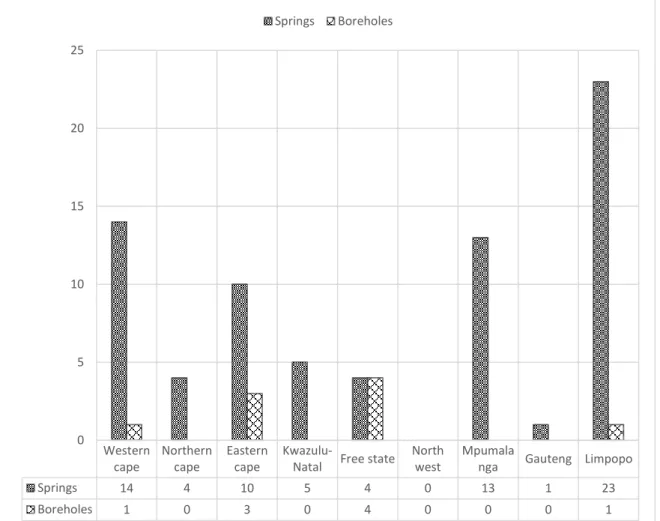
Geothermal springs in South Africa
Geothermal springs in Limpopo, namely Letaba (Die Eiland) and Bela Bela (Hot Baths) were also used before the arrival of the first Europeans. In South Africa, thermal waters were originally used for domestic and irrigation purposes, and later developed as spas and tourist destinations (Hoole, 2001).
Geology of the Soutpansberg Group
Stratigraphy of the Soutpansberg Group
This also takes into account the adsorption and retention capacity of the trace elements in the soil. Trace elements found in the surrounding soil close to the geothermal source were a result of the geothermal water and soil pedogenesis.
Physical characteristics of geothermal springs
Flow rates
Geothermal springs can be classified according to the rate at which they discharge water, which is called the flow rate (discharge) (La Moreaux and Tanner, 2001). The height difference between the recharge area and the starting point determines the hydrological head, which directly affects the flow rate.
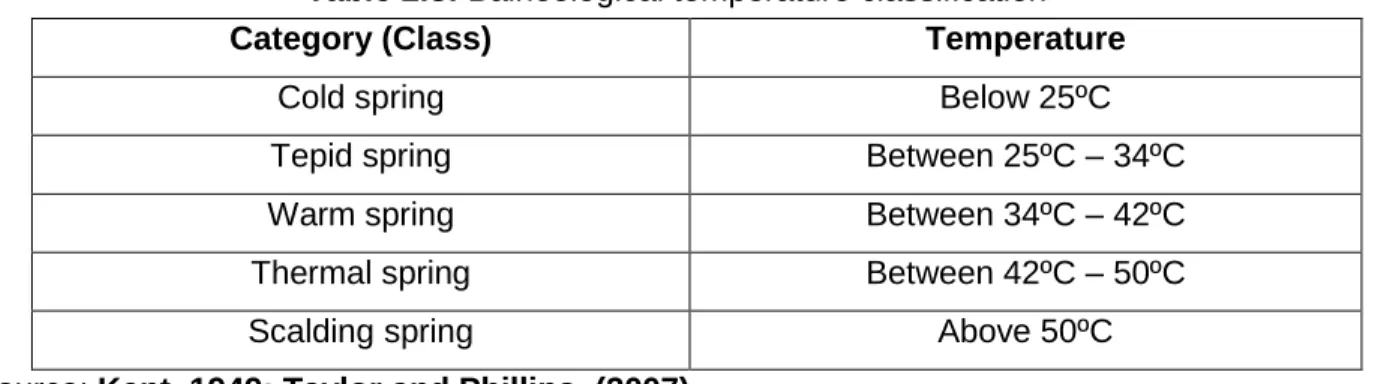
Temperature
The flow rate is an important measurement as it is used to estimate water storage and supply, changes in water availability and water use rates (Helfrich et al., 2005). The temperature of thermal springs is influenced by the temperature of the magma (for volcanic springs), the depth of penetration, as well as the nature of water conduits to the surface (Kent, 1949).
Electrical Conductivity and Total Dissolved Solids
The electrical conductivity of water increases by 2-3% when the water temperature increases by 1 degree Celsius. Electrical conductivity is an indicator of total dissolved solids (TDS) and is based on the presence of ions (Hayashi, 2008).
Chemical characteristics of geothermal springs
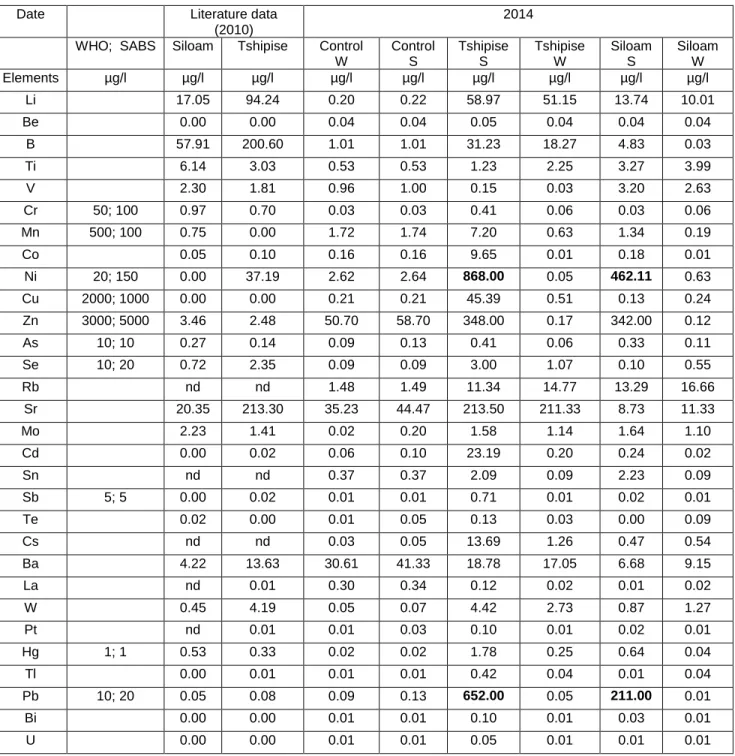
Elemental composition
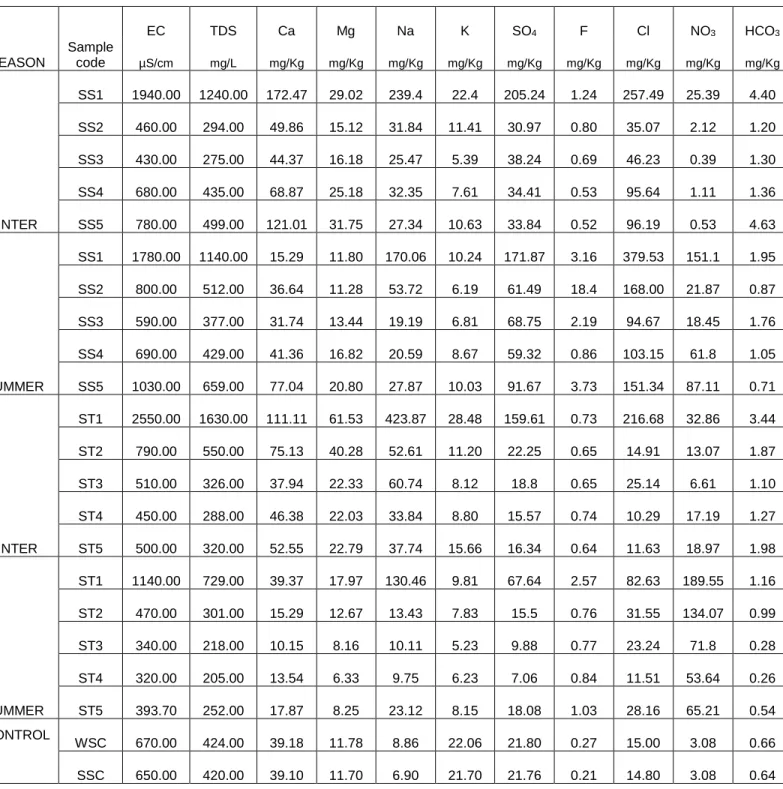
Previous studies show that fluoride concentrations at Siloam and Tshipise springs were 6.11 and 5.63 mg/L, respectively, which is above the South African guidelines for drinking water (Olivier et al. The concentrations of sulfate in Siloam and Tshipise springs were 9.26 and 53.17 mg/ L, respectively (Olivier et al., 2010), which does not contribute to any negative health effect.
Trace elements in geothermal springs
The previous study by Olivier et al. 2010) shows cadmium concentrations in Siloam and Tshipise are 0 µg/L and 0.02 µg/L respectively. Mobility of Cr (III) is reduced by adsorption on clays and oxide minerals below pH 5 and low solubility above pH 5 due to the formation of Cr(OH)3(s) (Chrotowski et al., 1991). The previous study by Olivier et al. 2010) shows copper concentrations in both sources as 0 µg/L.
Trace elements in the soil
Physicochemical factors affecting the transfer of the trace elements in the soil
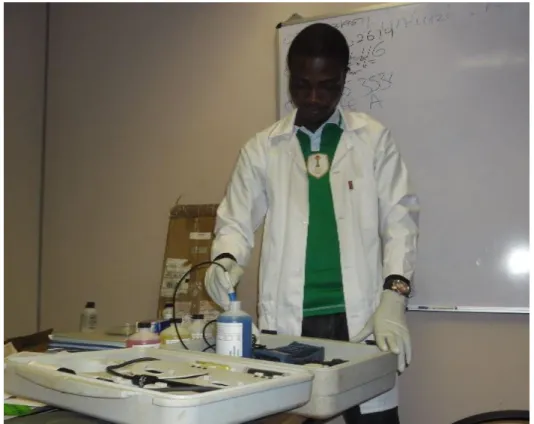
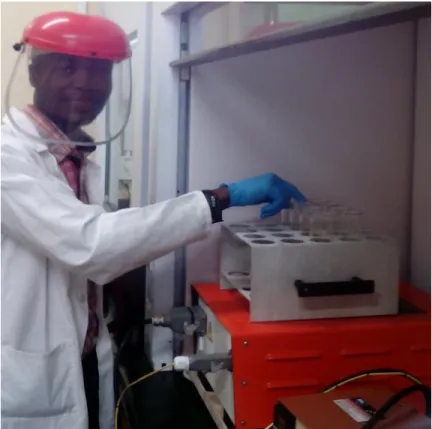
C - Inductively coupled plasma mass spectrometer (ICP-MS) (Agilent 7700 series) used for trace element determination. This means that there are reasonable differences in the concentrations of trace elements in the springs during the last four years. Therefore, there are more trace elements in geothermal water in summer than in winter.
This means that a reduction in acidity reduces trace element concentrations in the soil (Adamu et al., 2011). Figures 4.11 and 4.12 clearly show the effect of seasonal variation in the availability of the trace elements in the soil. This strong relationship with the indicator could possibly be due to the availability of the trace elements in the soil.
The soil at Tshipise is moderately concentrated with trace elements, which can be attributed to the moderate concentrations of the trace elements in the geothermal spring water.
Trace elements in plant
Research design
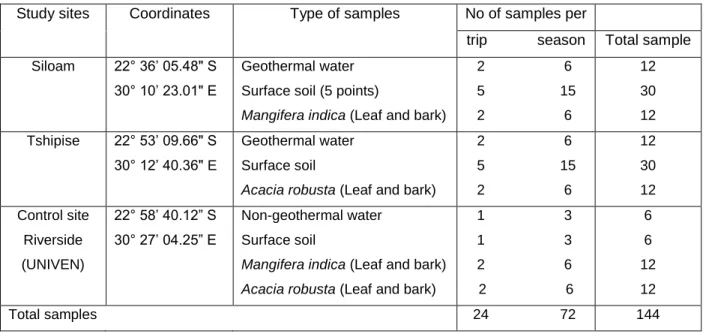
This research aimed to determine the trace element concentrations in the geothermal springs of Siloam and Tshipise and their impact on the soil and the vegetation. This is a quantitative study showing the variation of trace element concentrations between the geothermal spring water, soil and vegetation. The study investigated the availability of trace elements in a non-geothermal source of water, soil and vegetation at Riverside Residence (University of Venda) to serve as a control.
Sampling
Geothermal spring water samples
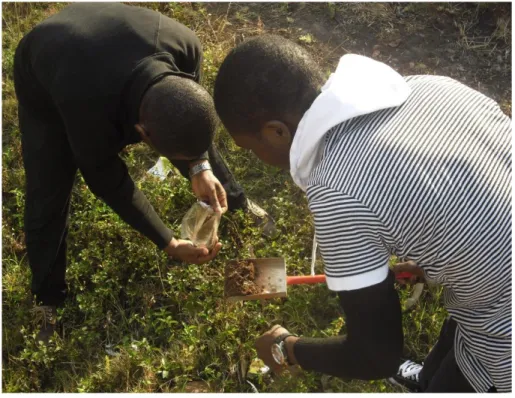
Representative samples were obtained by random sampling, in which water samples were obtained from each part of the source, where possible using a plastic cup (Figures 3.1A and 3.1B) as recommended by Harvey (2000). All the water samples were collected in 2L plastic containers before being transported to the laboratory for sample pretreatment. The geothermal water samples were allowed to cool before pretreatment and storage in the laboratory.
Soil samples
SS1 – SS5 and ST1 – ST5 represent distance from 0 – 20 m away from the geothermal spring at Siloam and Tshipise, respectively.
Vegetation samples
C – Sampling of the leaves of Acacia robusta at Riverside, UNIVEN Figure 3.4: Sampling of vegetation samples at Siloam, Tshipise and Riverside (control).
Experimental protocol
Chemicals
The reference materials used in this study were all standard chemicals of the Agricultural Research Council - Institute for Soils, Climate and Water (ARC-ISCW), Pretoria South Africa.
Sample pre-treatment
Samples were mixed, held for 16 h, and then verified to be pH <2, just before an aliquot was withdrawn for processing or direct analysis was performed. Pretreatment of plant samples (bark and leaves) was performed according to SR ISO 11466:1999. Bark and leaf samples were washed intensively with tap water and deionized water to eliminate soil and dust from the bark and leaves.
Experimental analysis
- Digestion analysis
- Water extract analysis from vegetation samples
- Saturated soil paste analysis
- Temperature, pH, EC and TDS analysis
- Soil organic matter analysis
- Major anion analysis
- Trace elements analysis
The measurement of the pH, temperature, EC and TDS of the water samples was carried out in situ with the help of Multimeter (Multi 340i/SET, USA) and also at the laboratory. All the samples were measured in triplicate and the mean values were estimated per season. 7 All the soil samples were analyzed in triplicate and the average values were estimated and documented.
Data analysis and interpretation
Preamble
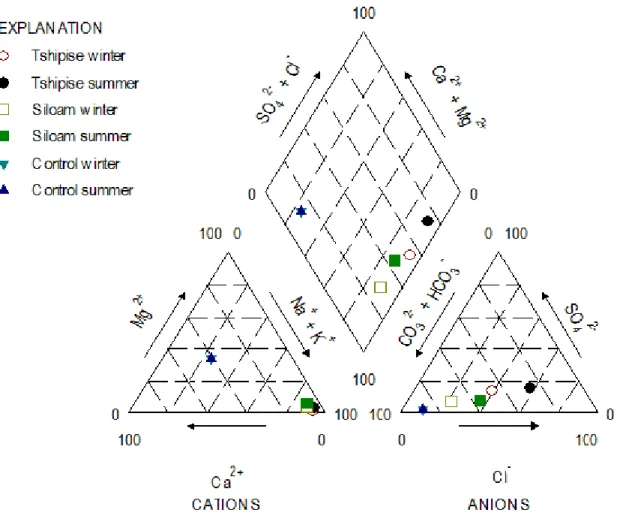
Physical and chemical characteristics of the geothermal springs
- Thermal characteristics of the geothermal springs
- Chemical composition of the geothermal springs
- Trace element concentrations in geothermal springs
- Seasonal variation of trace element concentrations in the geothermal spring water
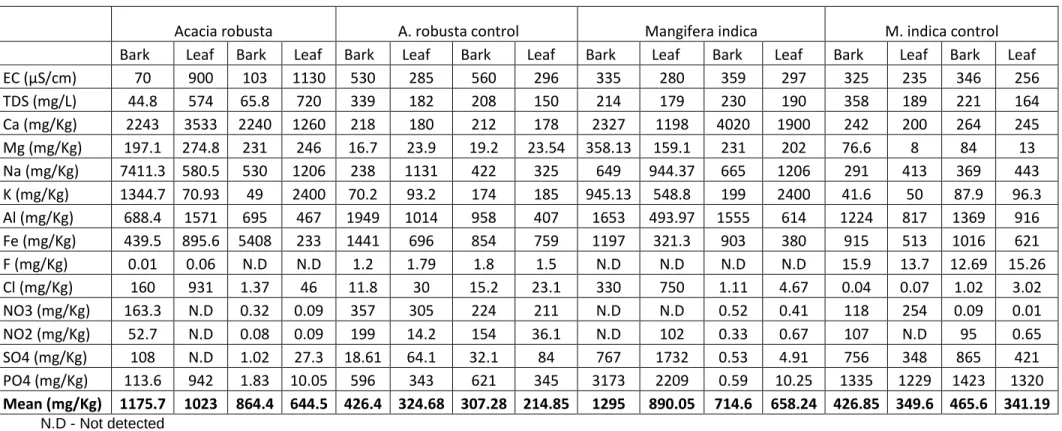
At Tshipise, decreasing indicators with distance (Figure 4.6B) would also represent decreasing concentrations of trace elements in both seasons (Figure 4.7). Statistically, there is a significant difference between the trace elements in the bark and leaves of Acacia robusta. This also assumes the effects of the state of trace elements (horizontally) on the soil surface and the level of pollution.
Factor analysis on the trace element concentrations on the surrounding soils of
Soil pH, soil organic matter and soil water retention as Indicators
Indicators such as soil pH, SOM and SWR (Figures 4.6A and 4.6B) can predict the availability of trace elements in soil. This study shows that there is a good relationship between indicators and trace elements with respect to distance such that the higher the soil pH, SOM and SWR of the soil, the higher the availability of these elements in the soil (Figures 4.6 and 4.7). Indicators play an important role in the seasonality of concentrations of trace elements; there are more trace elements in the summer compared to the winter season (Figure 4.7).

Chemical composition of the soil
The concentration of F- at the control plot was less (0.27 mg/Kg for winter and 0.21 mg/Kg for summer) compared to any sampling points at Siloam and Tshipise soil for both seasons. The concentrations of NO3- were not evenly distributed in the sample points at both study sites, with the highest concentrations at point SS1 and ST and mg/Kg for winter and summer respectively). Compared to control plot, the NO3 concentrations at any sample points of both plots were higher than the concentration at control plot (3.08 mg/Kg) for both seasons.
Trace element concentrations in soil
In general, average trace element concentrations decrease with distance (Figures 4.11 and 4.12) as well as the indicators (Figures 4.6A and 4.6B). At Siloam, the average trace element concentrations are negatively negatively correlated with the distance from the geothermal spring (R for summer and winter seasons respectively: P ˂ 0.05) (Figure 4.11). This implies that the availability of trace elements decreases with distance from the geothermal spring.
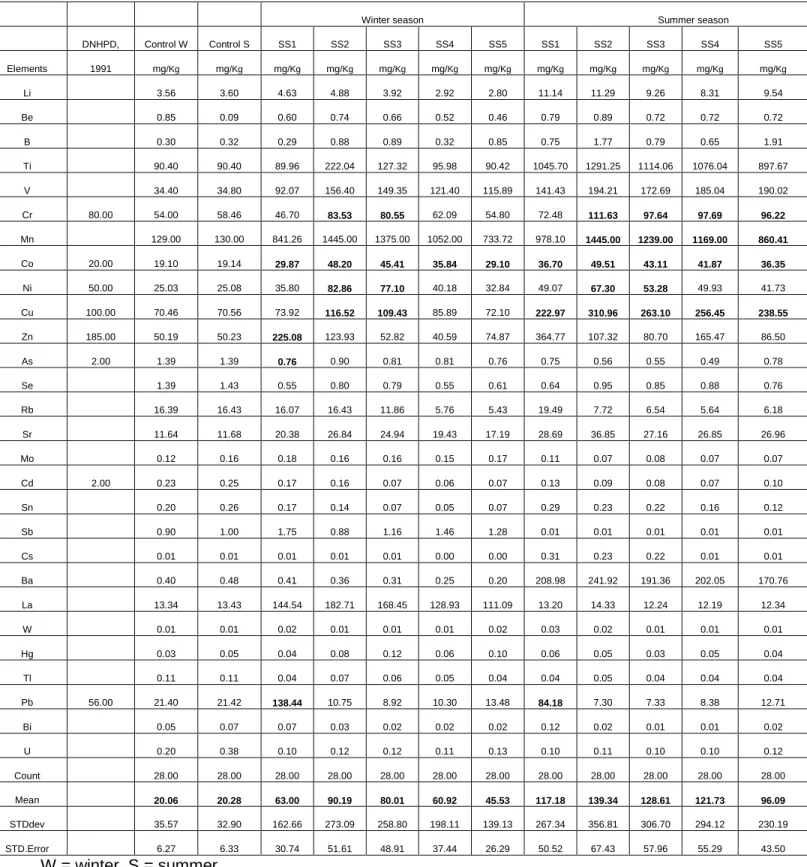
Seasonal variation of trace element concentrations on the soils
This could be attributed to higher concentrations of trace elements from geothermal springs, as well as greater use of spring water in the soil, leading to pollution. A comparison of the trace element concentrations of the two locations with the trace element concentrations at the control site indicates that the adjacent soil from the geothermal springs was partially or moderately contaminated with trace elements that enter the human body via the food chain.
Vegetation around the geothermal springs
- Chemical composition of Acacia robusta and Mangifera indica
- Trace element concentrations in Acacia robusta and Mangifera indica
- Seasonal variation of trace elements concentrations in Acacia robusta and Mangifera
- Percentage uptake of the trace elements in Acacia robusta and Mangifera indica
In addition, there is fruit formation in summer, which may also be responsible for higher concentrations of nutrients, including trace elements from the soil. There was more distribution of trace elements in the summer than in the winter season as a control (Figure 4.21). The percentage of uptake of trace elements in the barks and leaves of the plant was calculated using the formula by Lawal et al.
Preamble
Conclusion
Mean concentrations of trace elements decrease with indicators (soil pH, SWR, SOM) as we move away from the geothermal source. Concentrations of trace elements in geothermal springs were higher in summer than in winter; this resulted in more pollution of their soil and vegetation in summer. The Siloam spring water is more mineralized than the Tshipise spring water, so there are high levels of trace elements in the water, soil and vegetation at Siloam.
Recommendation
Hypocholesterolemic activity of calcite and magnesium sulfate-sulfur spring mineral water in rats, Nutrition Research, vol. acid secretion and reduction of serum cholesterol after crenotherapy with salt-rich mineral water. A study of trace element distribution in soil in and around Mysore city, Karnataka. Thermal and chemical characteristics of thermal springs in the northern part of Limpopo Province, South Africa, Water SA, vol.