• Tidak ada hasil yang ditemukan

M01436

N/A
N/A
Protected

Academic year: 2017

Membagikan " M01436"

Copied!
10
0
0

Teks penuh

Loading

Gambar

Table 1: Descriptive statistics of daily returns for three stocks of the TOPIX Core 30.
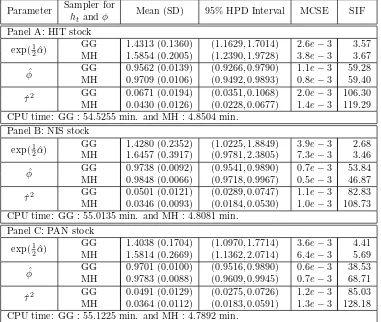
Table 2: Posterior samples of daily returns for three stocks of the TOPIX Core 30.
Table 3: Summary of correlation and normality test statistics of standardized innovations.
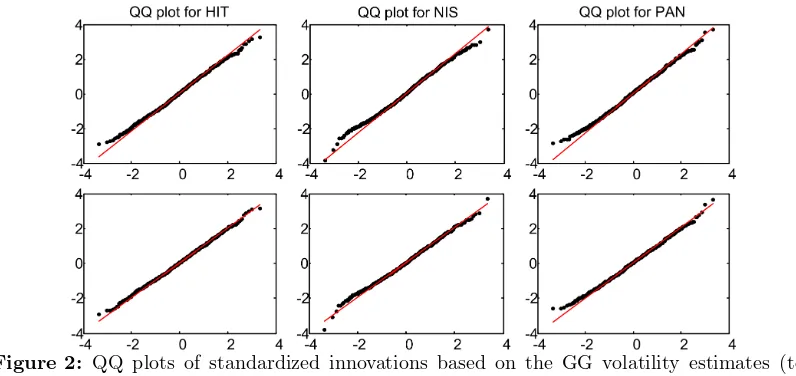
Figure 2: QQ plots of standardized innovations based on the GG volatility estimates (top

Referensi

Garis besar

Dokumen terkait

Three different log-likelihood functions are applied to estimate the GARCH model parameters, and his- torical SAVI data is used to evaluate the accuracy of the estimated GARCH option

More specifically, we estimate three separate cohort-sequential latent growth models that reflect three possible processes underlying the development of rumination across the lifespan: