| 's Blog | Laman 8
Teks penuh
Gambar

Garis besar
Dokumen terkait
Also, due to falling sea- levels, an increase in the erosion of coastal sediments would most likely diminish the rate of microbial (and thereby mud volcanic) methane
The GPS data were recorded over periods of a few hours to several months and show that between June 2006 and September 2007, the earth’s surface has been subsiding at rates of
For an inversion of the interferogram A1 (19 May–4 Oct. 2006), the ellipsoidal fringe pattern as well as the range decrease area to the east, are explained by the optimum model (
For instance, the fluid inside the reservoir balances pressure changes via density changes, the geometry is assumed spherical or cubic, the influx velocity of additional material
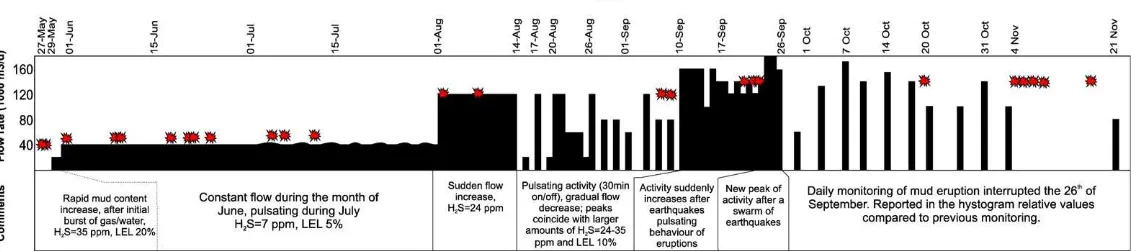
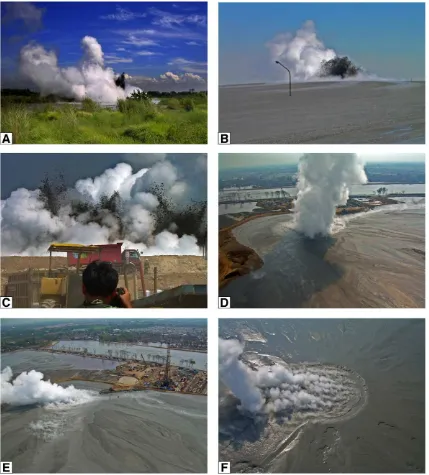
Satellite (IKONOS) photos published at roughly monthly intervals constitute important long-term monitoring data that allow an assessment of heat and mass discharged at the crater
As mentioned previously, that the effects of mud loading, collapse of the overburden due to the removal of mud from the subsurface (eruption) and, settlement caused by surface works
of constant conduit geometry and uniform material properties of the mud
he seismic P-wave (V p ) and S-wave (V s ) velocity proiles measured in the BJP1 borehole (Supplementary Fig. 1) show that the V p proile extends from a depth of about 300 m to
