NATURE GEOSCIENCE | VOL 7 | SEPTEMBER 2014 | www.nature.com/naturegeoscience 687 In our 2013 article1, we adopted a published velocity proile2 described as check-shot data, which we used as an input constraint for our numerical simulations. We were subsequently alerted to artefacts in that velocity proile, so below we present revised simulation results, based on additional data.
he seismic P-wave (Vp) and S-wave (Vs) velocity proiles measured in the BJP1 borehole (Supplementary Fig. 1) show that the Vp proile extends from a depth of about 300 m to the bottom of the section. he S-wave and density proiles, however, were only determined from the depth of the casing (approximately 1,100 m) to the bottom of the section. As we mentioned previously1, the system responds more vigorously to S-wave energy, but the critical information about the S-wave mechanical impedance (Vs multiplied by density, ρ) does not exist for the irst 1,100 m of this section.Instead, we estimate an S-impedance proile above the mud layer by using the observed Vp proile and the observation that Vs in the mud layer is as low as 380 m s–1 at 1,100 m depth. his extremely low value reinforces what has been pointed out elsewhere2,3, that the mud layer is a low-velocity zone representative of an over-pressured and under-consolidated sedimentary horizon. Such horizons are common throughout sedimentary basins in Southeast Asia.
We estimate Vs above the mud layer using experimental data (Supplementary Fig. 2) showing the relationship between Vs and Vp at low efective stress4. Although the V
p proile above the mud layer seems not to vary signiicantly (Supplementary Fig. 1a), a closer inspec-tion (Supplementary Fig. 1b) shows that the Vp steadily increases just above the mud layer from about 1,500 m s–1 to about 2,000 m s–1, between about 700 and 875 m depth. he steady increase in Vp with depth, typical of a normal compacting horizon, indicates lower luid pressures relative to the luid pressure in the underlying mud layer. We assume that the top of the mud layer corresponds to the observed drop in Vp at around 900 m depth, which is consistent with the well log data (Supplementary Fig. 3). Using the recorded Vp constraint of 2,000 m s–1 with a V
p /Vs ratio of about 2.7 (Supplementary Fig. 2), we estimate Vs at the top boundary of the mud layer to be about 750 m s–1 . We assume that the 380 m s–1 V
s recorded at 1,100 m depth extends to the top of the mud layer because of the rela-tively constant and reduced Vp below the compacting layer (Supplementary Fig. 1b). It should be emphasized that there is considerable uncertainty in Vs above the mud layer, but the observed reduction in Vp with depth (ater a systematic increase of velocity with depth in the layer above) corresponds to a far greater reduction in Vs within the mud layer. herefore, the interface between the mud layer and the compacting layer corresponds to an impedance contrast. his is evident in the elevated Vp /Vs ratios of about 4.5 within the mud layer (Supplementary Fig. 4), which again indicate low efective normal stress (Supplementary Fig. 2). At low efective stress, Vp and Vs are only weakly coupled whereby Vp remains relatively constant while Vs varies depending on the pore pressure. he efective stress depend-ence on Vp /Vs ratios occurs because Vs is solely dependent on the shear modulus while Vp is dominated by the bulk modulus. Since shear modulus varies strongly as a function of pore pressure, small changes in pore pressure at low efective stress generate large changes in Vs, with little inluence on Vp. From the available experimental data (Supplementary Fig. 2), we can expect about a factor of two diference in Vp /Vs.Although the data4 in Supplementary Fig. 2 are from a diferent lithology than that at Lusi, the physics is lithology-independent. We multiply our estimated Vs proile (Fig. 1a) with the measured density proile (see Supplementary Fig. 3), using 1,800 kg m–3 where there is no data, to generate a new impedance proile (Fig. 1b). We used this impedance proile as input for our numerical simulation, using the same input and boundary conditions as described previously1. For simplicity, the modelled faults in the previous simulations have been removed.
he results from our revised simulations (Fig. 1c) show that our estimated impedance-contrast between the low-velocity mud layer and the compacting sediments above produces a comparable focusing efect and maximum shear strain, as we reported previously1. Notably, our two-dimensional simulations underestimate by a factor of ive the additional ampliication when the third dimension of this parabolic structure is considered5.
Our conclusions1 therefore remain unchanged. We appreciate this opportunity to correct the record.
References
1. Lupi, M., Saenger, E. H., Fuchs, F. & Miller, S. A. Lusi mud eruption triggered by geometric focusing of seismic waves. Nature Geosci. 6, 642–646 (2013). 2. Istadi, B. P., Pramono, G. H., Sumintadireja, P. & Alam, S. Modeling study of growth and potential geohazard for LUSI mud volcano: East Java, Indonesia.
Mar. Petrol. Geol. 26, 1724–1739 (2009).
3. Tanikawa, W., Sakaguchi, M., Wibowo, H. T., Shimamoto, T. & Tadai, O. Fluid transport properties and estimation of overpressure at the LUSI mud volcano, East Java Basin. Engin. Geol. 116, 73–85 (2010).
4. Lee, M. W. Predicting S-Wave Velocities for Unconsolidated Sediments at Low Efective Pressure (USGS Scientiic Investigations report 2010–5138, 2010). 5. Davis, P. Triggered mud eruption? Nature Geosci. 6, 592–593 (2013).
Acknowledgements
We thank Maxwell Rudolph at Portland State University, USA, Mark Tingay at the University of Adelaide, Australia, Michael Manga and Chi-Yuen Wang at the University of California, Berkeley, USA, and Richard Davies at Durham University, UK, for alerting us to the errors in the original seismic velocity proile and for providing us with the additional data from the BJP1 borehole.
Additional information
Supplementary information is available in the online version of the paper.
Lusi mud eruption triggered by geometric focusing of seismic waves
M. Lupi, E. H. Saenger, F. Fuchs and S. A. Miller
Nature Geoscience 6, 642–646 (2013); published online 21 July 2013; corrected ater print 28 August 2014.
CORRIGENDUM
ARTICLES
NATURE GEOSCIENCE
DOI: 10.1038/NGEO2239
688 NATURE GEOSCIENCE | VOL 7 | SEPTEMBER 2014 | www.nature.com/naturegeoscience
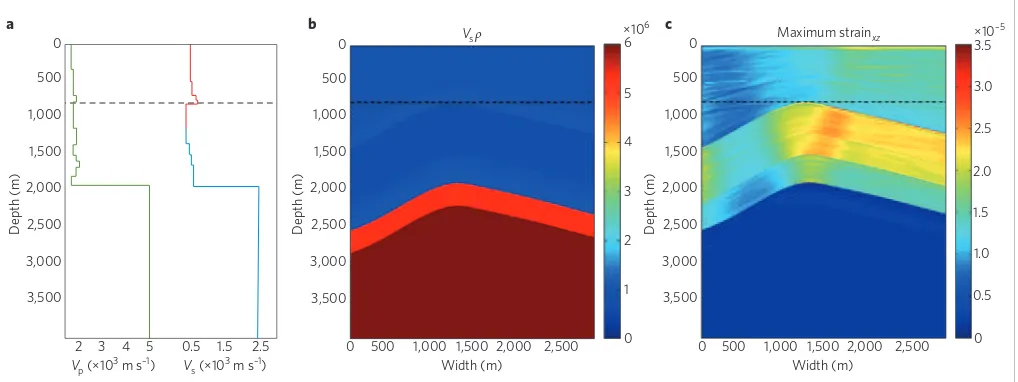
Figure 1 | Revised numerical simulations. a, We estimate a Vs (red line) proile based on the measured Vp (green line) and Vs (blue line) proiles. The
model domain was discretized into 21 layers (with higher resolution for the irst 2,000 m) approximated from the measured and estimated proiles (Supplementary Figs 1 and 2). Experimental data4 suggest that V
s varies indirectly with Vp. That is, Vp ∝ AVs, where A is a coeicient thatvaries
depending on the shear modulus, pore pressure and efective pressure (Supplementary Fig. 2). Hence Vs does not always correlate positively with Vp.
The observation of Vp = 2,000 m s–1 directly above the mud layer (Supplementary Fig. 1b) implies from Supplementary Fig. 2 that Vs = 750 m s–1, while
further observations of Vp = 1,600–1,750 m s–1 in the mud layer are also consistent with the observation of Vs = 380 m s–1 and Vp /Vs = 4.5 in the mud
layer (Supplementary Fig. 4). Therefore, we suggest there is little uncertainty in the magnitude of the impedance contrast, and small changes in these values will not signiicantly afect our results because they scale with impedance contrast. b, We use the S-wave estimates (a) to construct an S-wave impedance proile (with units kg m–2 s–1). c, We use the S-wave impedance proile (b) in our numerical simulation, using the same input and boundary
conditions as our original model simulation1. The dashed line marks the top of the mud layer. The results from this simulation show that the inferred
impedance contrast at Lusi is suicient to focus seismic energy into the mud layer.
2 3,500 2,500 1,500
3,000 2,000
Depth (m)
500 0
a b c Maximum strain
xz
1,000
3,500 2,500 1,500
3,000 2,000 500 0
1,000
4 3
Vp (×103 m s–1) Vs (×103 m s–1)
5 0.5 1.5 2.5 0
Vsρ ×10
6
3,500 2,500 1,500
3,000 2,000
Depth (m) Depth (m)
500 0
1,000
0 500 1,000 1,500 Width (m)
2,000 2,500 0
1 2 3 4 5
6 ×10
–5 3.5
3.0
2.5
1.5
0.5 2.0
1.0
0 500 1,000 1,500
Width (m)
2,000 2,500