A prediction of the longevity of the Lusi mud eruption,
Indonesia
Maxwell L. Rudolpha,∗, Leif Karlstroma, Michael Mangaa,∗∗
aDepartment of Earth and Planetary Science, University of California, Berkeley
Berkeley, CA USA
Abstract
A mud eruption, nicknamed Lusi, began near Sidoarjo, East Java, in May 2006.
It has discharged ∼ 104−105 m3/day of mud ever since. In order to understand
the nature of the eruption and its potential longevity, we develop a model for the
coupled evolution of the mud source and ascent of mud through a conduit to the
surface. The ascent of the mud is driven by overpressure in the mud source and by
the exsolution and expansion of dissolved gases. We assume that erupted fluids
originate in the mud source region. Mobilization of the mud is caused by
elas-tic stresses induced by mud evacuation from the subsurface. We perform Monte
Carlo simulations to explore model outcomes while perturbing the unknown
ma-terial properties of the mud and surrounding medium. Using our preferred model,
we calculate a 50% chance of the eruption lasting <41 years and a 33% chance
that it lasts >84 years. Eruptions often end with the formation of a caldera, but
longer eruptions are less likely to form a caldera. Model predictions can be refined
with additional, but currently unavailable constraints: more precise estimates of
∗Corresponding Author
∗∗Principal Corresponding Author
Email addresses:[email protected](Maxwell L. Rudolph),
mud discharge, the yielding behavior of the materials in the subsurface, total gas
content in the mud source, and identification of any erupted fluids that do not
originate in the mud source.
1. Introduction
1
On 29th May, 2006 an eruption of mud and fluids occurred in Sidoarjo,
In-2
donesia, creating a mud eruption named Lusi (short for Lumpur Sidoarjo).
Ap-3
proximately 104−105m3/day of mud has erupted ever since (Mazzini et al., 2007),
4
displacing>60,000 people (Bayuni, 2009). The large and active subsidence
cre-5
ated by the eruption continues to damage transportation and communication
in-6
frastructure.
7
The birth and evolution of the Lusi eruption are well documented (Istadi et
8
al., 2009; Mazzini et al., 2007) providing a special opportunity to study how and
9
why large mud eruptions occur (Davies et al., 2007). Because the eruption
oc-10
curred next to a 3 km deep gas exploration well, we also have unique insight into
11
the subsurface lithology and properties immediately prior to the eruption.
Specif-12
ically, we can constrain the source of the mud, origin of erupted fluids, and the
13
driving mechanism of the eruption.
14
In this study, we develop a mechanical model for the Lusi eruption that
cou-15
ples mud transport to the surface through a conduit with the evolution of the mud
16
source at depth. The model is analogous to those used for magmatic volcanoes
17
in that there is a mud chamber and a conduit, and dissolved gases play a key role
18
in sustaining the eruption. It differs in that the volume of mobilized mud
(analo-19
gous to eruptible magma at a volcano) increases over time, owing to progressive
20
mobilization of mud in the source region. We begin by summarizing some of
the key observations that guide model development. Next, we describe the model
22
and governing equations. We end by predicting the longevity of the eruption and
23
outline how to test and improve the model.
24
2. Observational Constraints
25
Microfossils imply a mud source in the upper Kalibeng formation, occurring
26
at depths between 1220-1860 m, which consists of Pleistocene clay (Sawolo et
27
al., 2009). The observed clay mineralogy is most similar to mud from 1600-1800
28
m (Mazzini et al., 2007). Kerogen compositions of erupted mud are also similar
29
to those obtained from side-wall cores taken at a depth of 1707 m (Sawolo et al.,
30
2009). Drilling logs indicate that the Kalibeng formation is under-compacted and
31
over-pressured, with porosity of about 30% (Istadi et al., 2009; Tanikawa et al.,
32
2010). There is some controversy over the porosity of the Kalibeng formation.
33
Based on density logs from the well Banjar Panji-1 (BJP1) Davies et al. (2011a)
34
estimate lower porosities (10-13%), which would necessitate an external water
35
source.
36
While there is no debate about the source of mud, there is considerable
dis-37
agreement about the source of fluid. The water content of the mud during the
38
earliest stages of eruption was 60-70% (Mazzini et al., 2007; Istadi et al., 2009).
39
This is greater than the porosity of the Kalibeng formation, ∼ 30%, implying an
40
additional source of fluid. Davies et al. (2007) suggest that water is sourced from
41
a carbonate aquifer at depths of 3 km. Mazzini et al. (2007) suggest that the
pri-42
mary source of water is diagenesis and dehydration within the source region of
43
the erupted mud. The lower concentrations of B, Li, and Cl, as well as theδ18O
44
enrichment of the water, can be explained by clay dehydration. Carbon isotope
measurements of hydrocarbons and methane in the erupted mud indicate the
pres-46
ence of both biogenic methane, which could be produced in the source muds, and
47
thermogenic methane, which, along with heavier hydrocarbons and H2S, must
48
have migrated from greater depths (Mazzini et al., 2007). The migration could
49
have preceded the eruption.
50
The reported water content of the erupting mud provides an additional
con-51
straint. While the initial water content was high, 60-70% (Bayuaji et al., 2009),
52
it gradually decreased to 30% over the first year (Mazzini et al., 2007). As this
53
value is similar to the porosity of the source layer, we assume there is no
signifi-54
cant addition of fluids to the mud source during the bulk of the eruption.
55
The temperature of the erupting mud is 70-100◦C (Sawolo et al., 2009). The
56
geotherm measured in the BJP1 (∼200 m from the site of the eruption) is 42◦C/km
57
and the mean annual air temperature is 27◦C (Bayuaji et al., 2009); temperatures
58
of 100 ◦C are reached at depths of 1700 m (Mazzini et al., 2007). The observed
59
mud temperature does not require the addition of significant amounts of fluid
hot-60
ter than the temperature at the source depth of the mud.
61
3. Model
62
We develop a model that is motivated and constrained by these observations.
63
The fluids, mud and gas for the bulk of the eruption are sourced from the Kalibeng
64
formation. Additional fluids may have played a key role in the initiation (Davies
65
et al., 2007; Tingay et al., 2008) and during the early stages of the eruption, but
66
will not influence subsequent dynamics, evolution, and longevity.
67
Our model is conceptually similar to typical models for magmatic volcanoes
68
in that the system consists of a “chamber” coupled to a “conduit”. It differs,
ever, in the nature and origin of the chamber component as well as the boundary
70
condition imposed on the conduit at the surface. For magmatic volcanoes and
71
some mud volcano models (Zoporowski and Miller, 2009), the chamber boundary
72
is a material surface and the chamber volume changes owing to influx or outflux
73
during the eruption. In our model, an initially spherical chamber consists of
mobi-74
lized mud – mud with a rheology that allows it to flow and to erupt. This chamber
75
is surrounded laterally by mud of the same composition that has not yet become
76
mobilized. The lateral extent of the mud chamber is therefore defined by a
rheo-77
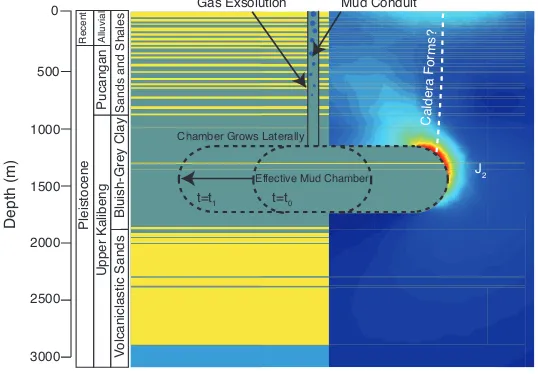
logical, rather than a compositional, transition and evolves over time (Figure 1).
78
Mud erupts through a cylindrical conduit, driven by gas exsolution and expansion
79
and by chamber overpressure.
80
3.1. Mud Source
81
We model the mud chamber as a cylindrical cavity of thickness 600 m
cen-82
tered at a depth of 1500 m. The edges of the cavity are rounded (Figure 1), and
83
the radius of curvature remains constant as the chamber expands. The details of
84
the assumed chamber geometry (e.g. radius of curvature of the edges) are less
85
important than the aspect ratio, which exerts the dominant control on the stress
86
concentration near the lateral boundary of the chamber. For the purposes of
cal-87
culating stresses outside the chamber, we assume that the continuum surrounding
88
the chamber is a linear elastic solid over the time scale of the eruption. Stresses
89
are governed by
90
∇ ·σ =0, (1)
whereσis the Cauchy stress, related to strain (ǫ) through the constitutive equation
91
Here λ and µ are the Lam´e constants. The model domain is subject to stress
92
boundary conditions at the chamber wall (∂S) and free surface (z=0):
93
σn|∂S = ∆PC (3)
94
σn|z=0 =σt|z=0= 0. (4)
Hereσn andσt are the normal and tangential stresses, respectively. ∆PC is equal
95
to the difference between the current pressure in the mud source layer PC(t) and
96
the initial source pressure,PC(0), and obeys the equation of state of the material in
97
the chamber, described later. We calculate elastic stresses and strains numerically,
98
using the axisymmetric program mode in FEAP, version 8.3 (Taylor, 2008). We
99
assume an isotropic initial stress state, neglecting any effects arising from
devia-100
toric tectonic stresses.
101
The equation of state relates specific volumevS (volume per unit mass) of the
102
3-phase mixture inside the chamber to pressure P. If we denote the undeformed
103
volume of the cavityV0,C and the deformed volume of the cavityVC, the pressure
104
satisfies
105
ρ0V0,C+
Z t
0
˙
M(τ)dτ= VC(P)/vS(P) (5)
where ˙M is the time derivative of chamber mass, which is the opposite of the
106
eruptive mass discharge, and ρ0 is the in-situ density of the mud at the initial
107
chamber pressure. We perform Newton-Raphson iteration to obtain a chamber
108
pressure that is consistent with the deformed volume of the cavity, the equation of
109
state of the material inside the chamber, and the mass of material remaining in the
110
chamber.
111
We adopt a von Mises yield stress (and equivalently, strain) criterion for
mo-112
bilizing additional mud from the chamber’s surroundings. The von Mises stress
is
114
σv=
p
3J2, (6)
where J2is the second deviatoric stress invariant. As mud erupts from the
cham-115
ber, the chamber deflates and its pressure decreases, producing stresses in the
116
surrounding mud. Once the von Mises stress in the unmobilized part of the mud
117
layer exceeds a critical value σy,chamber we assume that additional mud is
mobi-118
lized and becomes part of the chamber. We solve for the expanding chamber
119
radius iteratively so that the von Mises stress at the perimeter of the chamber is
120
everywhere less than the yield stress. The von Mises stress criterion has been used
121
to model mud yielding in other studies (e.g. Mazzini et al., 2009) and is the best
122
higher-dimension analogue to the yielding criterion used to study mudflows in one
123
dimension (e.g. Marr et al., 2002).
124
3.2. Conduit
125
Mud rises through a conduit towards the surface. The driving force is provided
126
by a combination of mud chamber overpressure, and exsolution of dissolved gas
127
and expansion of vapor during decompression and ascent. We model conduit
pro-128
cesses assuming steady one-dimensional multiphase flow through a cylinder (e.g.
129
Mastin, 2002; Dobran, 2001), subject to conservation of mass and momentum:
130
In equations 7-8, u is the mixture velocity of mud plus gas, P is the pressure,
132
g is gravity, µ is mud viscosity, r is the conduit radius. We note that the term
133
(8µu)/(ρmixr2) can be interpreted as a friction factor, and any change to conduit
geometry (e.g. opening of multiple vents or widening/collapse of the main vent)
135
would simply change the functional form of this term. ρmixis the mixture density,
136
given by:
137
ρmix = n
ρg
+ 1−n ρl
!−1
(9)
with n the mass fraction of gas, ρg and ρl the densities of gas and water plus
138
particles respectively.
139
c= ∂P
∂ρmix
!1/2
S
(10)
is the sound speed of the mixture, calculated numerically to ensure mass
conser-140
vation.
141 142
Equations 7-8 are solved with a bisection and shooting method and 4th order
143
Runge-Kutta integration to satisfy two boundary conditions: a one-way coupling
144
to the chamber pressure evolution at the base of the conduit
145
P(z =−H)= PC (11)
and an atmospheric pressure boundary condition at the surface
146
P(z=0)= Patm (12)
We assume that gas bubbles are dynamically coupled to the flow until a critical
147
porosity (gas volume fraction) of 0.3 is reached (Blower, 2001; Saar and Manga,
148
1999), which we take as the threshold permeability for gas loss. This limits the
149
acceleration of mud in the conduit and effectively ensures that velocities never
150
approach the sound speed of the mixture. We also assume that the water and mud
151
particles are dynamically coupled. Tanikawa et al. (2010) estimate
permeabili-152
ties of 10−20 to 10−19 m2 in the Upper Kalibeng Formation. Assuming a driving
pressure gradient of 10 MPa/km (estimated from chamber overpressure and
con-154
duit length scale), we compute the pore fluid velocity asv = −k/(µφ)∇P = 10−12
155
m/s, many orders of magnitude smaller than the bulk velocity of the multiphase
156
mixture.
157
The reservoir (chamber) enthalpy for a given initial temperature (T) and
pres-158
sure (P) is calculated using the XSteam (www.x-eng.com) implementation of the
159
International Association for the Properties of Water and Steam (IAPWS) IF-97
160
steam tables. We assume that the ascending mixture experiences isenthalpic
de-161
compression during transport (e.g. Lu and Kieffer, 2009), allowing us to calculate
162
T(z) from conservation of enthalpy and the steam tables. Once the P-T
decom-163
pression path is known, we calculate the density and mass fraction of liquid and
164
gas phases, which are functions of T and P, using the CH4-H2O equation of state
165
developed by Duan et al. (1992a,b) and implemented in HCO-TERNARY (Nieva
166
and Barragan, 2003) and the online calculator at geotherm.ucsd.edu. It is through
167
this calculation that we account for changes in density due to gas exsolution and
168
expansion, and we emphasize that the gas solubility is accounted for through the
169
CH4-H2O equation of state and that the conversion of liquid water to vapor during
170
ascent is limited by conservation of enthalpy.
171
4. Model Parameters
172
Our model contains a number of geometric and material properties, some that
173
are well-constrained and others that are poorly constrained and treated as
vari-174
ables. The following have enough uncertainty to be treated as variables: failure
175
strength of mud adjacent to the chamber (σy,chamber), failure strength of the
near-176
surface material (σy,caldera), Young’s modulus (E), and Poisson’s ratio (ν).
4.1. Constants
178
Mud viscosityµand conduit radiusraffect mud ascent through the grouping
179
µ/r2. Manga et al. (2009) measured mud viscosity of 105Pa·s on sample JV07-05
180
(Mazzini et al., 2007) of Lusi mud with 43 wt.% water. Water content has a large
181
effect on viscosity. Rifai (2008) measured viscosity of samples collected from
182
Lusi and found an approximately 80% increase in viscosity when water content
183
decreased from 62.5 wt.% to 59.0 wt.%. Rudolph and Manga (2010) measured
184
a fivefold increase in mud viscosity when water content decreased from 40 wt.%
185
to 33 wt.%. The geometry of the conduit through which the mud rises cannot
186
be observed directly. The initial fissure, observed within the first few days, was
187
hundreds of meters long and tens of centimeters wide at the surface (Mazzini et
188
al., 2007). Its burial by erupted mud does not allow us to determine how the
con-189
duit subsequently evolved and whether discharge became localized, as it does for
190
magmatic fissure eruptions. In March 2007, 10 months after the eruption began,
191
40 cm diameter concrete balls were able to reach depths of 1000 m (Mazzini et
192
al., 2007). As these balls had no effect on the eruption rate, their size provides a
193
minimum estimate of conduit dimensions. For a given dissolved gas
concentra-194
tion, we choose a combined conduit dimension and viscosity that reproduces the
195
observed 6 ×10⁴ m3/day mean discharge (Tingay, pers. comm. 2010),
empha-196
sizing again that viscosity and conduit radius enter the problem only through the
197
groupingµ/r2.
198
The volume ratio of erupted gases is spatially and temporally variable.
Mazz-199
ini et al. (2007) measured gas composition at seeps near the crater and sampled
200
steam clouds emanating from the crater. The seeps discharge 80-85% CH4 and
201
10-19% CO2. The gas samples from the steam cloud are more variable, with CO2
comprising 28-74% and CH4comprising 24-72% of the gas among three samples.
203
In general, the CO2-enriched samples are also enriched in CX forX > 1. We
in-204
terpret these measurements as indicating a methane-dominated gas composition,
205
following two lines of reasoning. First, CO2(specific gravity 1.53) and CX, X>2
206
are denser than air while CH4is lighter than air (specific gravity 0.56). The steam
207
samples were collected downwind of the crater, and some separation of gases by
208
density may have occurred during transport. Second, we expect that the local
209
gas seep chemistry, which is methane-rich, will be dominated by the composition
210
of the erupting fluids. However, subsequent measurements may indicate that the
211
erupting gas composition is CO2-dominated (Mazzini, pers. comm. 2011). In
212
our model, the gas composition is unimportant. As long as the discharge at
ini-213
tial chamber pressure fits the observational constraint, the relationship between
214
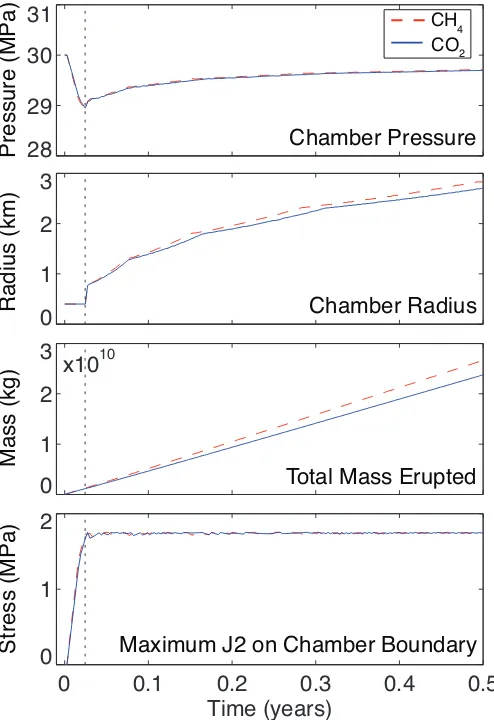
chamber pressure and discharge is independent of gas composition. We show
215
this graphically in Figure 2. The only discrepancy in cumulative mass removed
216
(Figure 2) for the model using CO2and the model using CH4arises from a small
217
mismatch in flux, less than 5%, the tolerance that we chose when calculating
con-218
duit velocities as a function of chamber pressure.
219
4.2. Unknowns
220
The value of σy,chamber for the mud source is not known. Kopf et al. (2009)
221
measured sediment shear strength in situ in the field (at the Dashgil mud volcano,
222
Azerbaijan) using a Cone Penetration Test. They found strengths as low as 150
223
kPa in the conduit and 300-700 kPa at other locations. We thus consider values
224
of σy,chamber with a mean of 1 MPa for the pre-mobilized mud, and a standard
225
deviation of an order of magnitude in log-space. Once the mud loses strength and
226
enters the chamber or flows in the conduit, we treat it as a viscous fluid. The value
ofσy,calderais also unknown, and we assume that it is 10 times larger thanσy,chamber.
228
We experimented with values of σy,caldera/σy,chamber as large as 100 but found it
229
to be unimportant. We explore a range of values for E (Young’s modulus) and ν
230
(Poisson’s ratio) for the surroundings centered about 108Pa and 0.15, respectively,
231
chosen to be consistent with the geodetic modeling of Fukushima et al. (2009).
232
The mean values and range of parameters used in the Monte Carlo
simula-233
tions are summarized in Table 1. We considered three scenarios. In the first, our
234
preferred model, we give more weight to values of unknown parameters near our
235
preferred mean value by using gaussian distribution of random numbers. E and
236
σy,chamberhave values that are normally distributed in log-space, i.e. log10
σy,chamber(Pa)
=
237
6±1. We also performed the same suite of Monte Carlo simulations with
proba-238
bility density functions (pdfs) that are constant in the range [mean−σ,mean+σ]
239
or [mean−2σ,mean+2σ] and zero elsewhere. We refer to these asσ-boxcar and
240
2σ-boxcar, respectively (Table 2).
241
5. Criteria to Terminate Eruption
242
The factors that cause eruptions to end are, in general, poorly understood. We
243
consider two possible scenarios. First, the chamber pressure decreases (sometimes
244
below lithostatic pressure) until there is insufficient potential energy available to
245
drive the eruption. Alternatively, the eruption may end if the near-surface
mate-246
rial fails, initiating caldera formation. The latter condition does not require that
247
the eruption has ended, just that it has entered a regime in which our model is
248
no longer applicable. Caldera formation occurs if continued removal of material
249
induces failure of the overlying layers, and becomes more likely as the chamber
250
grows and deviatoric stresses are concentrated between the surface and regions of
high curvature at the chamber walls. We evaluate J2(second deviatoric stress
in-252
variant) along a trajectory that begins at the tip of the mud chamber and progresses
253
upward always in the direction of greatest J2. We then evaluate J2 along this
tra-254
jectory at half the chamber depth. If the value at this point is greater thanτy,caldera,
255
we assume that a caldera forms. This method produces a conservative criterion
256
for caldera formation because J2is greatest at the free surface and decreases with
257
increasing depth.
258
6. Results
259
To predict longevity, we performed Monte Carlo simulations in which we
per-260
turbed the four unknown model parameters. We illustrate the evolution of
cham-261
ber pressure, chamber radius, total mass removed, and mass flux as a function of
262
time during an individual Monte Carlo realization in Figure 2. Of 2584
simula-263
tions, 1223 eruptions ended due to chamber underpressure, 725 formed a caldera,
264
397 lasted longer than 100 years (the maximum time allowed for computational
265
purposes), and 239 produced unbounded chamber growth (which is not
geolog-266
ically reasonable, as the mud source has finite lateral extent). In general terms,
267
eruptions that ended due to insufficient chamber pressure never incorporated
ad-268
ditional mud into the chamber because σy,chamber was large; those that produced
269
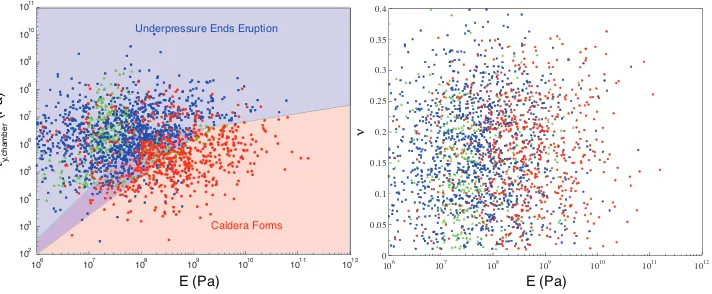
unbounded growth had the lowest σy,chamber. Caldera formation was favored by
270
larger E and lowσy,chamber. Our mean E = 108 Pa (Fukushima et al., 2009) and
271
σy,chamber lie close to the line that divides model outcomes in E-σy,chamber space
272
(Figure 3). Poisson’s ratio is unimportant.
273
Although short eruptions are the most frequent model outcome, the
obser-274
vation that Lusi has been erupting for more than 4.5 years provides an additional
constraint. If we exclude all eruptions shorter than 4.5 years and give equal weight
276
to all durations greater than 4.5 years, we obtain a cumulative probability
distribu-277
tion (Figure 4). The gaussian model predicts that the eruption has a 33% chance
278
of lasting<21 years, a 50% chance of lasting less than 40 years, and a 67% chance
279
of lasting<84 years. Theσ-boxcar and 2σ-boxcar model results are summarized
280
in Table 2.
281
7. Discussion
282
Eruptions driven by overpressure have approximately exponentially decaying
283
discharge because the mass removal decreases overpressure (Woods and Huppert,
284
2003). In contrast, to date the Lusi eruption has displayed a remarkably
uni-285
form discharge, varying only by less than a factor of ten over the first few years.
286
Eruption rates are difficult to determine accurately and the Lusi eruption is no
ex-287
ception. In the first few months discharge was about 50,000 m3/day and increased
288
to as much as 180,000 m3/day over the next year (Mazzini et al., 2009).
Satel-289
lite observations are most consistent with average eruption rates of 90,000 m3/day
290
(Istadi et al., 2009). Our model produces approximately constant eruption rates
291
for a given conduit size because once the chamber begins expanding, the chamber
292
pressure is buffered by incorporating additional material. Changes in observed
293
eruption rates could reflect evolution of the conduit geometry or opening of new
294
conduits, phenomena not captured by our model.
295
Mud volcanoes are known to form calderas (Kopf, 2008). Evans et al. (2008)
296
describe mud calderas, both on land and submarine, with diameters of 1-2 km.
297
Figure 3 shows thatE andσy,chamber are the key variables controlling caldera
for-298
mation. Figure 5 is a histogram of eruption duration, also showing the breakdown
between eruptions that end due to chamber underpressure and eruptions
culmi-300
nating in the formation of a caldera. Eruptions that last longer are more likely to
301
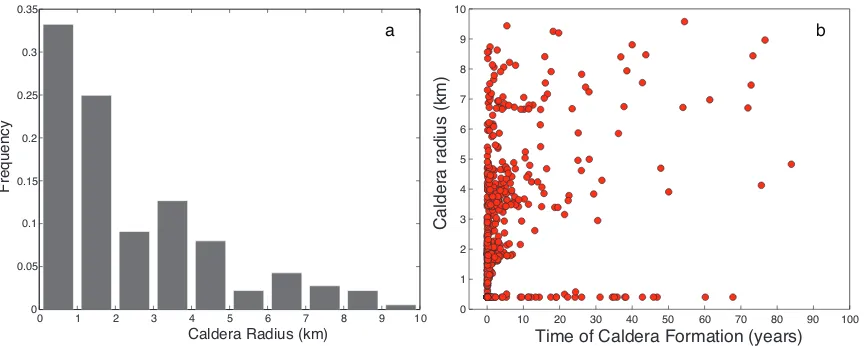
end due to chamber underpressure and less likely to form a caldera. Figure 6a is a
302
histogram of caldera radii, which we assume to be equal to the chamber radius at
303
the time of caldera formation. The calderas formed by our model most frequently
304
have radii less than 2 km, although larger calderas can form. Figure 6b is a
scat-305
ter plot of caldera radius as a function of time of formation. The positive-sloping
306
trend of this plot implies that longer-lasting eruptions tend to form larger calderas,
307
as expected.
308
There are two other models for the future of the Lusi eruption. The first, by
309
Istadi et al. (2009) assumes an eruption rate and uses a GIS approach to account
310
for subsidence and ponding of mud on the surface. As it does not address the
311
controls of eruption rate and processes driving the mud to the surface we do not
312
discuss it further. This model does, however, address a feature of the eruption that
313
we neglect, namely the emplacement and redistribution of the mud after eruption.
314
Davies et al. (2011b) develop a model that is more similar in approach to our
315
own in that they model the mechanics of the eruption process and mass transport.
316
The model differs significantly, however, in the inferred source of the fluids that
317
mix with the mud, the plumbing system for the fluids and mud, and the driving
318
forces for the eruption. Davies et al. (2011b) assume that water from a deep
319
artesian carbonate aquifer flows upwards into the 15 cm-diameter borehole created
320
by drilling operations. At the depths of the mud source, 1.8-1.6 km, the water
321
exits the conduit, mixes with mud in something analogous to our mud chamber,
322
and then erupts. The driving mechanism is overpressure in the carbonate aquifer,
323
and water from this aquifer entrains mud and carries it to the surface. Our model
thus differs conceptually in two important respects: the importance of the deep
325
carbonate aquifer, and the driving forces. We have argued that a source of extra
326
fluid is not needed after the initial phases of the eruption. Without this additional
327
source of overpressure, our eruption is sustained by exsolution and expansion
328
of gases derived from the mud source region. We note that the 50th percentile
329
eruption duration predicted by Davies et al. (2011b) is 26 years, substantially less
330
than we predict without invoking an external fluid source. We expect that the
331
addition of an external source of fluids (and overpressure) to our model would
332
increase the duration of our model eruptions.
333
8. Conclusions
334
In summary, we considered two possible scenarios under which the current
335
eruption may end, either through the eventual inability of dissolved gases to
sus-336
tain the eruption, or the formation of a caldera. We made some necessary
simpli-337
fications in order to develop a tractable model, most importantly the assumption
338
of constant conduit geometry and uniform material properties of the mud source
339
and surroundings. There is also considerable uncertainty in mechanical
proper-340
ties such as viscosity, failure strength of the mud, initial gas content, and origin
341
of additional fluids. However, once we constrain the model to produce the
ob-342
served eruption rate, uncertainty in viscosity and gas content have little effect on
343
longevity predictions.
344
Validating our conceptual model is necessary for its predictions to be relevant
345
and useful for planning. It should be possible to demonstrate the existence and
346
amount of additional fluids (Davies et al., 2007, 2011b) by sampling fluids from
347
the mud source and deeper aquifers, and comparing these with samples of the
erupted mud. There is also some ambiguity in the measurements of gas
composi-349
tion, and the collection of gas samples directly from Lusi’s crater would better
in-350
form our model parameters. We have also neglected to include aspects of regional
351
tectonics that may influence the eruption, particularly if the mud source expands.
352
Perhaps most important is the role of stresses from the reactivated Watukosek fault
353
that passes through the eruption source (Mazzini et al., 2009). The spatial
corre-354
lation of mud volcano locations with the fault suggests that the fault influences at
355
least the location of the eruptions. Our treatment of mud rheology and
mobiliza-356
tion is simplified, as mud failure and flow are complicated. Finally, our treatment
357
of the region surrounding the mud chamber as elastic cannot account for surface
358
cracks and motion on nearby faults, features that suggest brittle failure or plastic
359
deformation. Despite the uncertainties in material properties and the model
ap-360
proximations, our modeling framework allows us to make probabilistic estimates
361
of longevity and to highlight how predictions can be improved in light of better
362
observational constraints.
363
Acknowledgements
364
This work was supported by the National Science Foundation under Grant No.
365
EAR-1114184. We thank A. Mazzini for providing mud samples and R.
Swar-366
brick and R. Davies for discussions and for sharing their work. M.L.R. is
sup-367
ported by a Graduate Research Fellowship from the National Science Foundation.
368
We thank Adriano Mazzini and two anonymous reviewers for comments that
sub-369
stantially improved the quality of the manuscript.
370
Abidin, H.Z., Davies, R.J., Kusuma, M.A., Andreas, H., Deguchi, T., 2008.
Sub-371
sidence and uplift of Sidoarjo (East Java) due to the eruption of the Lusi mud
372
volcano (2006-present). Environ. Geol. 57(4), 833-844.
Bayuaji, L., Watanabe, H., Tonooka, H., Sumantyo, J.T.S., Kuze, H. Study on land
374
surface temperature characteristics of ho mud eruption in East Java, Indonesia.
375
Intl. J. Rem. Sens. Earth Sci. 6, 14-28.
376
Bayuni, E.M., 2009, December 1. Lusi spurs geologists interest. The Jakarta
377
Post. Retrieved from http://www.thejakartapost.com/news/2009/12/01/
lusi-378
spurs-geologists-interest.html.
379
Blower, J.D., 2001. Factors controlling permeability-porosity relationships in
380
magma. Bull. Volcanol. 63, 497-504.
381
Davies, R.J., Swarbrick, R.E., Evans, R.J., Huuse, M., 2007. Birth of a mud
vol-382
cano: East Java, 29 May 2006. GSA Today 17, 4-9.
383
Davies, R.J., Manga, M., Tingay, M., and Swarbrick, R., 2011. Fluid
384
transport properties and estimation of overpressure at the Lusi mud
vol-385
cano, East Java Basin (Tanikawa et al., 2010). Engineering Geology,
386
doi:10.1016/j.enggeo.2011.03.010.
387
Davies, R.J., Mathias, S.A., Swarbrick, R.E., and Tingay, M.J., 2011. Probabilistic
388
longevity estimate for the LUSI mud volcano, East Java. J. Geol. Soc. Lond.
389
168, 1-7.
390
Dobran, F., 2001. Volcanic processes: mechanisms in material transport. Kluwer
391
Academic, New York USA.
392
Duan, Z., Moller, N., Weare, J.H., 1992. An equation of state for the CH4-CO2
-393
H2O system: I. Pure systems from 0 to 1000◦C and 0 to 8000 bar. Geochim.
394
Cosmochim. Acta 56, 2605-2617.
Duan, Z., Moller, N., Weare, J.H., 1992. An equation of state for the CH4-CO2
-396
H2O system: II. Mixtures from 50 to 1000◦C and 0 to 8000 bar. Geochim.
397
Cosmochim. Acta. 56, 2619-2631.
398
Evans, R.J., Stewart, S.A., Davies, R.J., 2008. The structure and formation of mud
399
volcano summit calderas. J. Geol. Soc. 165(4), 769-780.
400
Fukushima, Y., Mori, J., Hashimoto, M., Kano, Y., 2009. Subsidence associated
401
with the Lusi mud eruption, East Java, investigated by SAR interferometry.
402
Mar. Pet. Geol. 26(9), 1740-1750.
403
Istadi, B., Pramono, G.H., Sumintadireja, P., Alam, S., 2009. Modeling study of
404
growth and potential geohazard for LUSI mud volcano: East Java, Indonesia.
405
Mar. Pet. Geol. 26(9), 1724-1739.
406
Kopf, A.J., 2008. Volcanoes: Making calderas from mud. Nature Geosci. 1(8),
407
500-501.
408
Kopf, A., Stegmann, S., Delisle, G., Panahi, B., Aliyev, C.S., Guliyev, I., 2009. In
409
situ cone penetration tests at the active Dashgil mud volcano, Azerbaijan:
Evi-410
dence for excess fluid pressure, updoming, and possible future violent eruption.
411
Mar. Pet. Geol. 26(9), 1716-1723.
412
Lu, X., Kieffer, S., 2009. Thermodynamics and mass transport in multicomponent,
413
multiphase H2O systems of planetary interest. Ann. Rev. Earth Planet. Sci. 37,
414
449-477.
415
Manga M., Brumm M., Rudolph, M.L., 2009. Earthquake triggering of mud
vol-416
canoes. Mar. Pet. Geol. 26(9), 1785-1798.
Marr, J. G., Elverhøi, A., Harbitz, C., Imran, J., Harff, P., 2002. Numerical
sim-418
ulation of mud-rich subaqueous debris flows on the glacially active margins of
419
the Svalbard-Barents Sea. Mar. Geol., 188(3-4), 351364.
420
Mastin, L., 2002. Insights into volcanic conduit flow from an open-source
numer-421
ical model. Geochem. Geophys. Geosyst. 3(7), 1037.
422
Mazzini, A., Svensen, H., Akhmanov, G., Aloisi, G., Planke, S.,
Malthe-423
Sørenssen, A., Istadi, B., 2007. Triggering and dynamic evolution of Lusi mud
424
volcano, Indonesia. Earth Planet. Sci. Lett. 261, 375388.
425
Mazzini, A., Nermoen, A., Krotkiewski, M., Podladchikov, Y., Planke, S.,
426
Svensen, H., 2009. Strike-slip faulting as a trigger mechanism for overpressure
427
release through piercement structures. Implications for the Lusi mud volcano,
428
Indonesia. Mar. Pet. Geol. 26(9), 1751-1765.
429
Nieva, D., Barragan, R.. 2003. HCO-TERNARY: A FORTRAN code for
calcu-430
lating P-V-T-X properties and liquid vapor equilibria of fluids in the system
431
H2O-CO2-CH4. Computers and Geosciences 29(4):469-485.
432
Rifai, R., 2008. Spatial modelling and risk assesment of Sidoarjo mud volcanic
433
flow. M. Sc. Thesis, Gadjah Mada University.
434
Rudolph, M.L., Manga, M., 2010. Mud volcano response to the 4 April 2010 El
435
Mayor-Cucapah earthquake. J. Geophys. Res. 115, B12211.
436
Saar, M.O., Manga, M., 1999. Permeability-porosity relationship in vesicular
437
basalts. Geophys. Res. Lett. 26(1), 111-114.
Sawolo, N., Sutriono, E., Istadi, B.P., Darmoyo, A.B., 2009. The LUSI mud
vol-439
cano triggering controversy: Was it caused by drilling? Mar. Pet. Geol. 26(9),
440
1766-1784.
441
Tanikawa, W., Sakaguchi, M., Wibowo, H.T., Shimamoto, T., Tadai, O., 2010.
442
Fluid transport properties and estimation of overpressure at the Lusi mud
vol-443
cano, East Java Basin. Eng. Geol. 116(1-2), 73-85.
444
Taylor, R.L., 2008. FEAP: A Finite Element Analysis Program. User Manual.
445
Tingay, M.R.P., Heidbach, O., Davies, R., Swarbrick, R.E., 2008. Triggering of
446
the Lusi mud eruption: earthquake versus drilling initiation. Geology 36,
639-447
642.
448
Woods, A.M., Huppert, H.E., 2003. On magma chamber evolution during slow
449
effusive eruptions. J. Geophys. Res. 108(B8), 2403.
450
Zoporowski, A., Miller, S.A., 2009. Modelling eruption cycles and decay of mud
451
volcanoes. Mar. Pet. Geol. 26(9), 1879-1887.
Symbol Value (or Mean) Standard Deviation Description
log10(E (Pa)) 8 1 Young’s modulus
ν 0.15 0.1 Poisson’s ratio
log10(σy,chamber(Pa)) 6 1 Yield strength of mud source layer
σy,caldera 10σy,chamber N/A Yield strength of near-surface material
µ 104Pa s N/A Viscosity in conduit
r 1.4 m N/A Conduit radius
[CH4] 0.5 wt % N/A Methane mole fraction
[CO2] 1 wt % N/A CO2 mole fraction
Table 1: Summary of the values for model parameters. The means and standard deviations listed
were used in our Monte Carlo simulations.
Prior PDF Shape Gaussian σboxcar 2σboxcar
33% Longevity (years) 21 27 14
50% Longevity (years) 40 50 25
75% Longevity (years) 84 >100 52
Table 2: Summary of model results for both choices of gas composition and different assumptions
about the distribution of model unknowns. Models with gaussian pdfs use the means and standard
deviations shown in Table 1. Models withσ-boxcar and 2σ-boxcar distributions use mean values
V
(m) Effective Mud Chamber
Mud Conduit
Figure 1: An illustration of model geometry and how it relates to subsurface lithology, (left of
conduit) and our calculatedJ2(second deviatoric stress invariant), right of conduit. Warmer colors
indicate larger values ofJ2. Stratigraphy is adopted from (Mazzini et al., 2007) and is based on
28 29 30 31
0 1 2 3
0 1 2 3
x1010
0 0.1 0.2 0.3 0.4 0.5
0 1 2
Time (years)
Maximum J2 on Chamber Boundary Total Mass Erupted Chamber Radius Chamber Pressure
R
a
d
iu
s
(km)
Pre
ssu
re
(MPa
)
Ma
ss
(kg
)
St
re
ss
(MPa
)
CH4
CO2
Figure 2: Temporal plots of chamber pressure, chamber (mobilized region) radius, cumulative
mass erupted, and maximum J2on the chamber boundary (top to bottom). The red dashed lines
are from a model in which we used 0.5 mol % CH4while the blue curves are for a model with 1
mol % CO2. The two models are otherwise identical. The most important feature of the model
results, illustrated here, is that once yielding begins (indicated by dashed vertical line), there is a
drastic change in system behavior. Chamber radius begins to increase, and chamber pressure is
buffered by the incorporation of material with higher pore pressure than that of the material filling
the chamber prior to expansion. Like chamber pressure, mass flux is buffered and varies only by
106
Figure 3: Regime diagram illustrating effect of variables on model outcome (gaussian model).
Each glyph represents one model realization and colors/shapes correspond to outcomes: blue
squares - insufficient chamber pressure ends eruption, red circles caldera forms, green triangles
-eruption lasts longer than 100 years.
0 10 20 30 40 50 60 70 80 90 100
Figure 4: Cumulative probability that the eruption has ended for all three distributions of unkown
variables. Horizontal axis is time since eruption started, vertical axis is likelihood that eruption
will have ended or formed a caldera. Green dotted, blue dashed, and red dot-dashed lines indicate
5 15 25 35 45 55 65 75 85 95
Figure 5: Histogram of eruption durations for gaussian model. Red bars indicate eruptions that
formed a caldera and blue bars indicate eruptions that ended due to insufficient chamber pressure.
We list the percentage of the eruptions in a given bin that ended due to caldera formation.
Caldera Radius (km)
Time of Caldera Formation (years)
C
Figure 6: (a) Histogram of caldera radii for gaussian model. Frequency of radii of caldera formed
in the model, normalized so that bins sum to 1. (b) Relationship between caldera radius and time