In
Non-ST Elevation Myocardial Infarction
Nicola Jayne Smith Student ID: 1379396
Master of Health Science (MHSc)
Unitec Institute of Technology 2013
1
2
Abstract
Background: Non-ST elevation myocardial infarction (NSTEMI) has only recently been included in the definition of acute myocardial infarction and literature is limited regarding the usefulness of echocardiography as a diagnostic tool in this setting. Since analysis of regional wall motion abnormalities (RWMAs) by standard echocardiography is highly reliant on observer experience, advanced modalities are suggested as possible complementary methods to perform quantitative RWMA assessment and observe underlying coronary artery disease (CAD); however, their utility has not been widely tested in a clinical setting.
Aim: The aim of this thesis was to explore the usefulness of echocardiography for determining systolic and diastolic dysfunction post NSTEMI and compare the results to coronary angiography. The viability and
accuracy of utilising the advanced echocardiography modalities of tissue velocity imaging and speckle tracking derived velocity, strain and strain rate as novel indices for quantifying regional dysfunction and determining underlying CAD was also explored.
Method: A randomly selected data set of 55 patients admitted with NSTEMI to Christchurch Hospital, New Zealand, underwent standard echocardiography, advanced echocardiography analysis and angiography.
Results: Of 55 patients, 76% were male while 20% had diabetes and 56% were current or previous smokers. Patients with diabetes and/or smoking history were more likely to have multiple coronary lesions and nine fold more likely to require coronary artery bypass grafting. 36% of patients had a left ventricular ejection fraction (LVEF) < 60% while 18% had an LVEF < 50%. A left anterior descending (LAD) coronary artery regional infarction resulted in the lowest LVEF (50+/- 6%). Mild diastolic dysfunction was present in 80% of patients, while moderate to severe diastolic dysfunction was present in 13%. For the advanced modalities, strain and strain rate derived by tissue velocity imaging were statistically significant for all regions, except for detecting underlying CAD in the RCA territory with strain rate and for RWMA identification in the RCA territory with strain – although there was a trend towards statistical significance. Velocity did not correlate well with the territories for identifying RWMAs and underlying CAD. Good correlation was noted in the LAD and Cx regions with speckle tracking derived strain and strain rate for identifying both RWMAs. Good correlation was noted in the LAD region with strain and strain rate for identifying underlying CAD. Although there was statistical significance within these results, there was also variation and overlap.
Conclusions: The role of echocardiography in NSTEMI provides important information concerning systolic and diastolic dysfunction. We found excellent correlation between coronary angiography, clinical parameters and echocardiographic parameters. In general, the advanced imaging modalities correlated with both the presence of regional dysfunction and underlying CAD, however, there was overlap and variation within the data sets. With further technical and clinical refinement, these modalities may be useful supplementary tests to quantitatively evaluate RWMAs and to determine underlying CAD.
3
Acknowledgments
Firstly, I would like to express my gratitude to my primary supervisor Dr Paul Bridgman. His knowledge, patience and advice helped me immensely with this research. I continue to enjoy working with him at
Christchurch Hospital. I would also like to express my gratitude to my secondary supervisor Professor Gillian Whalley. Gillian displays immense knowledge of echocardiography and research in general; her enthusiasm for the subject and ideas for this thesis lit my fire while her proof-reading skills were much appreciated! I could not imagine undertaking a task such as this without the help of these two people!
Thank you to Khadeeja Mohamed, the biostatistician at Christchurch Hospital. Thank you also to the support crew at Unitec Institute of Technology. Dr Suzanne Henwood, the programme leader. To Brendan Smith of the Unitec Library and the Unitec staff in general – thank you for helping a distance learning student in times of need!
I would like to show my gratitude to my colleagues (the echo nurse aide, echo technicians, admin staff and doctors) in the Cardiology Department at Christchurch Hospital. Some of who I gained technical help from, others whom were kind to simply ask how it was going, or offer words of encouragement, which I truly appreciated.
Lastly, but not at all least, I would like to offer my warmest appreciation to my family. Thank you. To my husband (Daniel de Seymour), who supported me throughout my research and who often fell asleep with the glow of a laptop screen. To my mum and dad (Grace and Brian Smith) who helped me in any way possible and allowed me to make a complete mess of their study when we moved in while our house was undergoing earthquake repairs. To my brother and his partner (Michael Smith and Yvetti Tse) who assisted me enormously with technical Word issues. To my uncle (Peter Melrose), who offered encouragement. And, of course, to my dogs, Monty and in particular Eva who spent quiet weekends and long nights curled at my feet or on my lap as I typed, researched, typed, researched, typed.
4
Table of Contents
1 Chapter One: Literature Review ... 17
1.1 Non-ST Elevation Myocardial Infarction – An Overview ... 17
1.1.1 NSTEMI versus STEMI Prognosis ... 18
1.1.2 Troponin I (TnI)... 19
1.1.3 NSTEMI Patient Characteristics ... 20
1.2 Echocardiography and NSTEMI... 23
1.2.1 Echocardiography and Systolic Function ... 24
1.2.2 Echocardiography and Diastolic Function ... 27
1.3 Limitations of Current Clinical Echocardiography ... 32
1.4 Conclusion: Literature Review - Echocardiography Characteristics of NSTEMI Presentations ... 32
1.5 Advanced Imaging Modalities: Tissue Velocity Imaging and Speckle Tracking Derived Velocity, Strain and Strain Rate ... 33
1.5.1 Tissue Velocity Imaging Derived Velocity, Strain and Strain Rate ... 33
1.5.2 Speckle Tracking Derived Velocity, Strain and Strain Rate ... 38
1.5.3 Advanced Imaging Modalities: Current Lack of Clinical Utility ... 40
1.6 Conclusion: Literature Review – Advanced Echocardiography Techniques .... 42
2 Chapter Two: Experimental Design and Methodology... 44
2.1 Aims ... 44
2.2 Hypothesis... 45
2.3 Study Subjects ... 45
2.3.1 Inclusion Criteria ... 46
2.3.2 Exclusion Criteria ... 46
2.4 Study Protocol ... 47
2.5 Echocardiography ... 48
2.5.1 Echocardiography Acquisition ... 48
5
2.5.2 Echocardiography and Angiography Analysis, Measurements and
Calculations... 51
2.5.3 TVI Derived Velocity, Strain and Strain Rate ... 58
2.5.4 ST Derived Velocity, Strain and Strain Rate ... 61
2.6 Coronary Angiography ... 62
2.6.1 Angiography Analysis ... 62
2.7 Statistical Analysis ... 62
2.8 Summary: Methodology ... 63
3 Chapter Three: Part I Results - NSTEMI Characteristics and Standard Echocardiography Features ... 65
3.1 Introduction ... 65
3.2 Patient Characteristics ... 66
3.3 Admission Characteristics ... 67
3.4 Event Timing: Admission, Echocardiography, Angiography and Discharge .... 68
3.5 Echocardiography Results ... 69
3.5.1 Echocardiography Systolic Results ... 69
3.5.2 Echocardiography Diastolic Results ... 71
3.5.3 Assessment of Regional Wall Motion Abnormalities with Echocardiography ... 76
3.5.4 Correlation of Troponin I with Ejection Fraction ... 77
3.5.5 Further Echocardiography Pathologies ... 78
3.6 Angiography Results ... 81
3.6.1 Agreement between RWMA with Echocardiography and the Presence, or Absence, of CAD with Angiography ... 82
3.7 Re-admission and Mortality ... 85
4 Chapter Four: Part I Discussion - NSTEMI Characteristics and Standard Echocardiography Features ... 87
4.1 Introduction ... 87
6
4.2 Patient Characteristics ... 87
4.3 Admission Characteristics ... 88
4.4 Echocardiography ... 91
4.4.1 Systolic Function ... 91
4.4.2 Diastolic Function... 93
4.4.3 Other Pathologies ... 100
4.5 Angiography Results ... 103
4.5.1 RWMA Assessment and CAD ... 105
4.5.2 Sensitivity versus Specificity... 106
4.6 Re-admission Rates ... 107
4.7 Advanced Imaging Modalities ... 107
4.8 Conclusion: NSTEMI Characteristics and Echocardiographic Features ... 109
5 Chapter Five: Results Part II – Advanced Echocardiography Techniques ... 111
5.1 Introduction ... 111
5.2 Patient Characteristics ... 111
5.3 RWMA Assessment ... 113
5.3.1 Tissue Velocity Imaging ... 113
5.3.2 Speckle Tracking ... 120
5.4 Coronary Artery Territory Disease ... 126
5.4.1 Tissue Velocity Imaging ... 126
5.4.2 Speckle Tracking Imaging ... 133
5.5 Global Strain ... 141
5.6 Summary: Advanced Echocardiography Results... 142
6 Chapter Six: Discussion Part II – Advanced Echocardiography Techniques ... 144
6.1 Introduction ... 144
6.2 Validity of Performing and Analysing TVI and ST in a Non-Research Clinical Laboratory ………..145
7
6.2.1 Acquisition... 145
6.2.2 Analysis ... 146
6.2.3 TVI Analysis... 148
6.2.4 ST Analysis... 149
6.2.5 Coronary Angiography Analysis ... 150
6.3 Interpretation ... 151
6.3.1 Tissue Velocity Imaging ... 151
6.3.2 Speckle Tracking Imaging ... 155
6.4 Inter-Observer Variability ... 160
6.5 Global Strain ... 160
6.6 Clinical Application ... 161
6.7 Conclusion: Advanced Echocardiography Discussion ... 162
7 Chapter Seven: Study Limitations... 164
7.1 Clinical Limitations ... 164
7.1.1 Technical Limitations ... 165
8 Chapter Eight: Conclusion ... 167
9 References ... 171
10 Appendix ... 186
8
List of Figures
Figure 1: Torsion of the Myocardium with Speckle Tracking Echocardiography ... 25
Figure 2: Diastolic Cascade ... 28
Figure 3: Diastolic Dysfunction Patterns ... 29
Figure 4: Strain ... 34
Figure 5: Strain Rate ... 34
Figure 6: Diagram of Longitudinal, Circumferential and Radial Strain ... 35
Figure 7: Segment Analysis of Walls of the Left Ventricle in the Apical (1,2,3) and Parasternal Short Axis (4,5,6) Window ... 49
Figure 8: Coronary Distributions of the Left Ventricle in the Apical (1,2,3) and Parasternal Short Axis (4,5,6) Windows ... 50
Figure 9: Left Atria Area ... 52
Figure 10: Simpson’s Biplane Ejection Fraction: End Diastole (left) and End Systole (right) ... 53
Figure 11: Transmitral Inflow ... 54
Figure 12: Tissue Doppler Imaging Septal Annulus ... 55
Figure 13: Event timing of Aortic Valve Opening and Closure - Systole ... 57
Figure 14: Event Timing of Mitral Valve Inflow Opening and Closure - Diastole... 57
Figure 15: Segmental Analysis and Approximate Sample Volume Placement... 58
Figure 16: TVI Derived Velocity ... 59
Figure 17: TVI Derived Strain ... 60
Figure 18: TVI Derived Strain Rate ... 60
Figure 19: Speckle Tracking Derived Velocity, Strain and Strain Rate ... 61
9
List of Tables
Table 1: NSTEMI Patient Characteristics of 55 Patients Admitted to Christchurch
Hospital, New Zealand (June 2011 and April 2012) ... 66 Table 2: NSTEMI Patient Admission Characteristics of 55 Patients Admitted to
Christchurch Hospital, New Zealand ... 67 Table 3: Timing of Admission, Echocardiography, Angiography, Coronary Artery Bypass Grafting and Discharge ... 68
Table 4: Systolic Function Characteristics of NSTEMI Presentations ... 69 Table 5: Left Ventricular Ejection Fraction Groups compared with Regional Wall Motion Abnormalities ... 70 Table 6: Echocardiography Derived Diastolic Function Indices ... 72 Table 7: Characteristics of Diastolic Function Grades in NSTEMI Patients ... 73 Table 8: Characteristics of Patients with Diastolic Dysfunction and Preserved Ejection Fraction (>50%) ... 74
Table 9: Characteristics of Patients with E:A ratio >1.0 in Patients with Pseudo-normal and Restrictive Diastolic Dysfunction ... 75
Table 10: Regional Wall Motion Abnormalities Assessment... 76 Table 11: Pathologies Noted With Echocardiography ... 79 Table 12: Patient Events Post NSTEMI Compared with Echocardiography Characteristics ... 80 Table 13: Angiography Results – Culprit Coronary Arteries ... 81 Table 14: Regional Wall Motion Abnormalities Identified with Echocardiography:
Comparison with Angiography Results ... 82
10
Table 15: Specificity versus Sensitivity of Regional Wall Motion Abnormality Analysis with Echocardiography ... 83
Table 16: Coronary Artery Disease with no Corresponding Regional Wall Motion
Abnormalities ... 84 Table 17: Re-admission Characteristics ... 85 Table 18: Segmental Assessment with TVI and ST in 55 Patients ... 112 Table 19: Quick Reference Table: Vascular Territory Distribution and the Correlation Between Advanced Imaging Modalities and the Presence and Absence of RWMA or CAD (p values) ... 139
Table 20: Quick Reference Table of Statistical Significance: Vascular Territory
Distribution and the Correlation between Advanced Imaging Modalities and the Presence and Absence of RWMA or CAD ... 140
Table 21: Normal Values: Differences in TVI Derived Velocity, Strain and Strain Rate Values between Cardiac Walls ... 186
11
Lit of Graphs
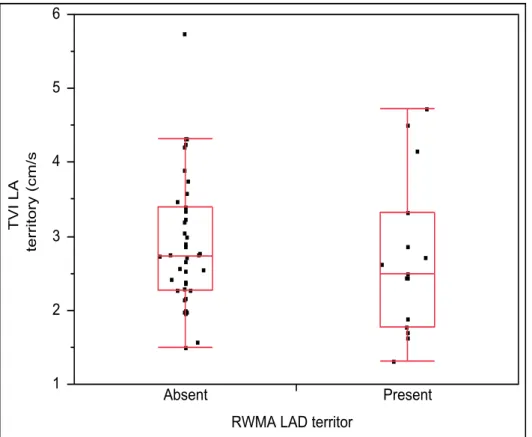
Graph 1: Bivariate Fit of Ejection Fraction (%) by Troponin I (μg/L) ... 77 Graph 2: One-way Analysis of TVI LAD territory (cm/s) By RWMA LAD territory ... 114 Graph 3: One-way Analysis of TVI Cx territory (cm/s) By RWMA Cx territory ... 115 Graph 4: One-way Analysis of TVI RCA territory (cm/s) By RWMA RCA territory ... 115 Graph 5: One-way Analysis of Strain LAD territory (%) By RWMA LAD territory ... 116 Graph 6: One-way Analysis of Strain Cx territory (%) By RWMA Cx territory ... 117 Graph 7: One-way Analysis of Strain RCA territory (%) By RWMA RCA territory ... 117 Graph 8: One-way Analysis of Strain rate LAD territory (/s) By RWMA LAD territory ... 118
Graph 9: One-way Analysis of Strain rate Cx territory (/s) By RWMA Cx territory ... 119 Graph 10: One-way Analysis of Strain rate RCA territory (/s) By RWMA RCA territory ... 119
Graph 11: One-way Analysis of LAD Speckle tracking Velocity (cm/s) By RWMA LAD territory ... 120 Graph 12: One-way Analysis of Cx Speckle tracking velocity (cm/s) By RWMA Cx territory ... 121 Graph 13: One-way Analysis of RCA Speckle tracking velocity (cm/s) By RWMA RCA territory ... 121 Graph 14: One-way Analysis of Speckle tracking strain LAD (%) By RWMA LAD territory ... 122 Graph 15: One-way Analysis of Speckle tracking strain Cx (%) By RWMA Cx territory ... 123
12
Graph 16: One-way Analysis of Speckle Tracking Strain RCA territory (%) By RWMA
RCA territory ... 123
Graph 17: One-way Analysis of LAD Speckle tracking strain rate (/s) By RWMA LAD territory ... 124
Graph 18: One-way Analysis of Cx Speckle tracking strain rate (/s) By RWMA Cx territory ... 125
Graph 19: One-way Analysis of RCA Speckle tracking strain rate (/s) By RWMA RCA territory ... 125
Graph 20: One-way Analysis of TVI LAD territory (cm/s) By LAD disease ... 127
Graph 21: One-way Analysis of TVI Cx territory (cm/s) By Cx disease ... 128
Graph 22: One-way Analysis of TVI RCA territory (cm/s) By RCA disease ... 128
Graph 23: One-way Analysis of Strain LAD territory (%) By LAD disease ... 129
Graph 24: One-way Analysis of Strain Cx territory (%) By Cx disease ... 130
Graph 25: One-way Analysis of Strain RCA territory (%) By RCA disease ... 130
Graph 26: One-way Analysis of Strain rate LAD territory (/s) By LAD disease ... 131
Graph 27: One-way Analysis of Strain rate Cx territory (/s) By Cx disease ... 132
Graph 28: One-way Analysis of Strain rate RCA territory (/s) By RCA disease ... 132
Graph 29: One-way Analysis of LAD Speckle tracking derived velocity (cm/s) By LAD disease ... 133
Graph 30: One-way Analysis of Cx Speckle tracking TVI (cm/s) By Cx disease ... 134
Graph 31: One-way Analysis of RCA Speckle tracking TVI (cm/s) By RCA disease ... 134
Graph 32: One-way Analysis of Speckle tracking strain LAD (%) By LAD disease ... 135
Graph 33: One-way Analysis of Speckle tracking strain Cx (%) By Cx disease ... 136
13
Graph 34: One-way Analysis of Speckle tracking strain RCA (%) By RCA disease ... 136 Graph 35: One-way Analysis of LAD Speckle tracking strain rate (/s) By LAD disease ... 137
Graph 36: One-way Analysis of Cx Speckle tracking strain rate (/s) By Cx disease ... 138 Graph 37: One-way Analysis of RCA Speckle tracking strain rate (/s) By RCA disease ... 138
Graph 38: Bivariate Fit of Ejection fraction (%) By Global strain (%) ... 141
14
Abbreviations
ACS Acute Coronary Syndrome
AMI Acute Myocardial Infarction
BSA Body Surface Area
CABG Coronary Artery Bypass Grafting
CAD Coronary Artery Disease
CENSTEMI Contemporary Echocardiography in Non-ST Elevation Myocardial Infarction
Cx Circumflex Coronary Artery
DVD Double Vessel Disease
ECG Electrocardiogram
EF Ejection Fraction
LAD Left Anterior Descending coronary artery
LVEF Left Ventricular Ejection Fraction
MRI Magnetic Resonance Imaging
NSTEMI Non-ST (segment) Elevation Myocardial Infarction
p Probability (p-value)
RCA Right Coronary Artery
RWMA Regional Wall Motion Abnormality
RVSP Right Ventricular Systolic Pressure
ST Speckle Tracking
STEMI ST Elevation Myocardial Infarction
SVD Single Vessel Disease
TnI Troponin I
TVD Triple Vessel Disease
TVI Tissue Velocity Imaging
15
Introduction
Non-ST elevation myocardial infarction (NSTEMI) is an acute coronary syndrome (ACS) involving acute coronary obstructions, which result in reduced oxygen to the myocardium. In 2007, the American College of Cardiology and the European Society of Cardiology altered the definition of an acute myocardial infarction (AMI), traditionally incorporating only ST elevation myocardial infarction (STEMI), to include unstable angina and NSTEMI [1].
Echocardiography is a cost effective, bedside, adjunct diagnostic tool, which involves using ultrasound to assess the structure and function of a heart after such an event; however, it was only recently included in The New Zealand Medical Journal Guidelines as a recommended test with NSTEMI presentations. Literature regarding the use of echocardiography with NSTEMI presentations is limited. Most studies have been conducted in STEMI patient cohorts. Moreover, a New Zealand audit in this field has shown surprisingly low application rates of this easily accessible test.
This study aims to describe the characteristics of NSTEMI presentation with echocardiography, specifically systolic and diastolic function. As echocardiography is highly subjective and requires an experienced operator, advanced imaging modalities such as tissue velocity imaging (TVI) and speckle tracking (ST) are suggested as modalities which provide quantitative assessment with reduced inter and intra-operator variation. These modalities, although well validated, have generally not been adapted by the clinical community (nationally nor internationally). Instead they are used mainly in the research environment. This study also aims to assess the validity and accuracy of performing these advanced modality techniques in a clinical setting.
To achieve these aims, Chapter One provides an overview of the relevant background material and identifies areas that have yet to be explored. Based on Chapter One, Chapter Two outlines the methods used to study NSTEMI echocardiography characteristics and advanced imaging modalities.
Chapter Three provides the results of echocardiography and NSTEMI presentation characteristics, while Chapter Four discusses the results of Chapter Three in light of the background material presented in Chapter One. Chapter Five provides the results of the advanced imaging modalities, while Chapter Six discusses the results of Chapter Five in light of the background material presented in Chapter One. In Chapter Seven limitations of the study are discussed, while in Chapter Eight, a summary of the thesis is presented and conclusions are drawn and related back to the aims in the introduction.
16
Chapter One:
Literature Review
Contemporary Echocardiography In
Non-ST Elevation
Myocardial Infarction
17
1 Chapter One: Literature Review
1.1 Non-ST Elevation Myocardial Infarction – An Overview
Non-ST elevation myocardial infarction (NSTEMI) has only recently been accepted as a form of acute coronary syndrome (ACS). In 2007, the American College of Cardiology and the European Society of Cardiology altered the definition of an acute myocardial infarction (AMI), traditionally incorporating only ST elevation myocardial infarction (STEMI), to include unstable angina and NSTEMI [1]. ACS is, therefore, an overarching term used to describe STEMI, NSTEMI and unstable angina. ACSs involve acute obstructions of coronary arteries, usually when an acute thrombus forms in an atherosclerotic artery. The aetiology of NSTEMI involves atheromatous plaque in coronary arteries becoming inflamed then
rupturing exposing thrombogenic material [2]. This is mediated by a conformational change in membrane platelet glycoprotein receptors (IIb/IIIa), allowing aggregation of platelets, resulting in a thrombus, which interrupts blood flow (therefore oxygen) to the myocardium [3]. An AMI is myocardial necrosis from reduced blood flow to parts of the myocardium.
Symptoms of NSTEMI include chest discomfort, dyspnoea, nausea and diaphoresis [4].
Diagnosis of an AMI is with biomarker elevation and electrocardiogram (ECG) changes (the latter distinguishes NSTEMI from STEMI). A STEMI is myocardial necrosis with acute ST-segment elevation and possible Q wave development, while a NSTEMI is myocardial necrosis without ST-segment elevation, with possible ST-segment depression and/or T wave inversion. Of note, as many as 20% of patients admitted with NSTEMI may show no ECG changes; therefore, a lack of ECG changes in a patient presenting with chest pain is not enough to rule out ACS and further tests should be carried out [5]. The management and outcome of AMI patients depends on the degree and location of the obstruction. With a STEMI, the coronary artery is usually totally occluded and requires urgent pharmacological or interventional revascularisation (coronary angioplasty). With a NSTEMI, the coronary artery is usually partially blocked and patients require antithrombotic therapy and/or revascularisation reducing the coronary artery stenosis [6].
18
This literature review focuses on the current state of knowledge regarding the benefits of utilising echocardiography as a front-line diagnostic tool with NSTEMI presentations and the usefulness of echocardiography as a predictor of prognostic outcome. Gaps in the literature will be presented as possible paths for future investigation.
1.1.1 NSTEMI versus STEMI Prognosis
Various studies, such as Allen et al. [7] and Montalescot et al. [8], have found prognostic outcomes of NSTEMI patients similar to STEMI patients. Published in 2006, Allen et al. [7]
studied 760 patients: 26% presented with NSTEMI, 17% with STEMI. Unadjusted mortality over 10 years was highest in patients with NSTEMI. NSTEMI patients were associated with higher co-morbidity rates and reduced utilisation of medical therapies when compared with STEMI patients. After statistically controlling for baseline differences, they found STEMI patients had the highest mortality. This study may indicate that prior to controlling for baseline differences, NSTEMI patients are at risk of adverse prognosis resulting in-part from individual patient co-morbidities and risk factors. Furthermore, this suggests that patients presenting with NSTEMI are more likely to have higher rates of co-morbidities than their STEMI counterparts. This study was based on retrospective research and although published in 2006, utilised patients hospitalised between 1991 and 1992. Thus, the data predates modern therapies. Modern medications and protocol changes may affect the results of this study if repeated today.
In a more recent case series published in 2007, Montalescot et al. [8] compared STEMI with NSTEMI patient admissions on a large patient cohort of 2151, from multiple hospitals in France. They found STEMI patients were quicker to present to hospital (4 hours STEMI vs. 7 hours NSTEMI), were more likely to undergo percutaneous coronary intervention (71%
STEMI vs. 52% NSTEMI) and on discharge were more likely to receive secondary prevention therapies. This management was not supported with the differences found in disease severity. The study found rates of re-hospitalisation were equivocal (36.7% STEMI
19
vs. 41.5% NSTEMI), in-hospital mortality rates were equivocal (4.6% STEMI vs. 4.3%
NSTEMI) and one year mortality rates were equivocal (9% STEMI vs. 11.6% NSTEMI). The study suggested heart failure and age were the highest one-year mortality predictors. This study is pivotal to understanding the similarities between STEMI and NSTEMI presentations.
Although prognostic outcome between NSTEMI and STEMI is comparable, patients
presenting with NSTEMI are often treated less effectively than their STEMI counterparts [9].
1.1.2 Troponin I (TnI)
NSTEMI diagnosis requires acute presentation of patients with ischemic symptoms (such as chest, upper extremity, jaw and/or epigastric pain, possibly accompanied by dyspnoea, nausea or syncope), ECG changes (T wave inversion or ST depression) and enzyme
biomarker elevation. The biomarker troponin I (TnI), measured in μg/L, is primarily utilised at Christchurch Hospital, New Zealand as a marker of acute myocyte necrosis. It uses the 99th percentile as a reference limit of elevation [10]. TnI is regarded as the most sensitive and specific biomarker for myocardial damage with levels beginning to rise around 3-4 hours post event [11]. An increased TnI value suggests elevated acute risk and reduced long term
prognostic outcome [12]; however, it does not reflect the mechanism for elevation, so further pathology such as aortic dissection or pulmonary embolism should be excluded [1].
Echocardiography allows for quick differentiation of these diagnoses in most patients, so should be considered as a diagnostic tool upon NSTEMI admission for this reason alone.
20 1.1.3 NSTEMI Patient Characteristics
Risk stratification is an important part of the decision making process when a patient presents with NSTEMI [13]. Risk stratification involves analysing patient presentation symptoms, ECG tracings, biomarker elevations, patient characteristics, co-morbidities and risk factors. This process ensures adequate therapy is utilised on an individual patient basis, which reduces hospital stay, re-admission and, therefore, the cost to the public health system.
Echocardiography is a quick and affordable diagnostic tool that assists in the risk
stratification process, highlighting important individual characteristics of patients which may be useful for management.
The average age of patients presenting with NSTEMI has been well documented as the 7th decade of life [7, 14, 15]. The New Zealand ACS audit, performed by Ellis et al. [15], studied all ACS patients admitted to New Zealand hospitals in 2007 over a 14-day period. They found the interquartile range was of aged between 56 and 78 years. It is well documented that a higher proportion of males (than females) present with NSTEMI [7, 8, 15, 16]. Gehrie et al.
[16] found females were more likely to have non-obstructive coronary artery disease on angiography than men (15.1% vs. 6.8%), with better prognostic outcomes, although the underlying pathophysiology for this was not studied. Atypical NSTEMI presentations and complaints are more common in women, the elderly and patients with diabetes [17], often making diagnosis particularly challenging.
Patient co-morbidities and risk factors such as diabetes and smoking, contribute to the prognostic outcome of individual NSTEMI presentations. Diabetes is a topical global disease due to its heavy demands on the health system [18]. Type II diabetes is due to high blood glucose levels - either the body does not make enough insulin or the body’s cells do not respond properly to insulin [19]. Diabetes affects the heart in numerous ways. This includes metabolic disturbances and increased vascular permeability, which result in myocyte
apoptosis, left ventricular hypertrophy, decreased myocardial perfusion and systolic and diastolic dysfunction [20], [21]. The New Zealand ACS audit [15] performed in 2007 found
21
19% of patients had diabetes mellitus. The 2004 Global Registry of Acute Coronary Events [22] performed a prospective study on 5403 patients admitted with ACS from 94 hospitals.
They found one quarter of the patients had diabetes. These patients were more likely to be older, female, have co-morbidities and were less likely to be treated with effective medical therapies. They also had an increased risk of heart and renal failure and all-cause mortality.
Danahoe at al [23] performed an audit on patients with ACS from 11 independent clinical trials, published in 2007. Of a total 62,036 patients (46,577 were diagnosed with STEMI and 15,459 were diagnosed with unstable angina/NSTEMI), 10,613 (17.1%) had diabetes.
Mortality at 30 days for NSTEMI patients with diabetes was 2.1%, compared to 1.1% for non-diabetics, while the one-year mortality rate for NSTEMI patients with diabetes was significantly higher than that for non-diabetics (7.2 vs. 3.1%). They concluded that diabetes resulted in significant adverse prognosis, highlighting the need for aggressive strategies to manage this disease.
Smoking has also been linked to an elevated risk of AMI [17], however, regardless of public awareness, it is still a common community burden. The New Zealand ACS audit [15]
found 17% of patients admitted with NSTEMI were current smokers, while 39% had smoked in the past. Published in 2012, George et al. [24] reported a link between smoking and
coronary artery disease (CAD) using a prospective cohort study of more than 91,5000
patients. They found smokers were at higher risk of significant CAD than non-smokers when presenting with ACS. A limitation of this study was the failure to determine alternative risk factors such as diabetes, congestive heart failure or family history. It was also unclear whether ex-smokers qualified as non-smokers and what a significant smoking history would involve (i.e. cigarettes per day/packs per year).
Patient in-hospital mortality rates after an AMI vary depending on the degree of heart failure present. This was demonstrated by a landmark study published in 1967 by Killip et al.
[25], who studied 250 patients in a coronary care unit over a two year period. From the data retrieved the Killip classification was created, which grades the severity of heart failure symptoms post AMI. Killip et al. [25] found the in-hospital mortality rate was approximately 10% and primarily determined by the severity of heart failure in NSTEMI and STEMI
22
presentations. Guidelines and clinical management have changed significantly since this study was published (1967), however, the trends between STEMI and NSTEMI admissions are still relevant. A global study [26], found the 30 day mortality rate overall was 6.2% for ACS patients and individually, was 7.4% for NSTEMI patients and 11.1% for STEMI
patients, further supporting prognostic outcome similarities between the two syndromes. This study, however, was published in 2006. A repeat of the global study in 2009 by the same researchers found ACS 30 day mortality rates had decreased from 6.2% to 5.1%. This was thought to be the result of increased guideline adherence (as patient characteristics were similar in both studies), increased use of evidence based therapies/interventions and the availability of state-of-the-art cardiology departments [27].
23
1.2 Echocardiography and NSTEMI
In current clinical practice, echocardiography is recommended when a patient presents with STEMI and NSTEMI. The New Zealand STEMI Guidelines suggest ‘…acute
echocardiography demonstrating regional wall motion abnormalities (RWMAs) may be a useful adjunct for diagnosis and assessment of complications’ [28]. Similarly, the New Zealand NSTEMI guidelines recommend echocardiography “…in all patients with elevated troponin and those with ECG abnormalities to assess global and regional left ventricular function, assess the valves for defining differential diagnoses" [29]. The national audit [15]
found 62% of patients admitted with STEMI received an echocardiogram, while only 22% of patients admitted with NSTEMI received an echocardiogram. This is surprising, as shown in previous studies, with current clinical management, STEMI and NSTEMI prognostic
outcome is similar. This audit was performed in 2007, when the guidelines for NSTEMI did not include recommendations for echocardiography and modern clinical management of NSTEMI was still evolving.
Echocardiography is an excellent real time diagnostic procedure with moderate temporal and spatial resolution [1], useful for assessing mechanical complications or cardiac
abnormalities and variants. With NSTEMI presentations, echocardiography is highly useful when assessing myocardial contraction - differentiating areas of endocardium which are contracting normally from areas which are hypokinetic (reduced motion), akinetic (no motion) or diskinetic (dyssynchronous motion).
Assessment of cardiac function by echocardiography may be split into two areas – systolic function and diastolic function. Echocardiographic indices helpful in the assessment of systolic dysfunction include left ventricular systolic volume, left ventricular ejection fraction (LVEF) - which represents the percentage of blood ejected from the left ventricle with each cardiac contraction, infarct size and location, mitral regurgitant jet severity and the presence of left ventricular hypertrophy [30]. Echocardiographic indices helpful in the assessment of diastolic dysfunction include grades of diastolic dysfunction, E/Em filling
24
pressures (early mitral inflow velocity to peak mitral annular velocity which is an estimate of left ventricular filling pressure), E:A ratio (mitral inflow Doppler ratio between early filling velocity and late filling velocity) and left atrial volume [31]. When compared with the vast pool of STEMI literature, there is a marked absence of studies assessing diastolic dysfunction in NSTEMI presentations. The available literature is limited to a small number of significant studies. This study hopes to add to the small pool of NSTEMI literature by assessing the degree of diastolic dysfunction present in a sample of NSTEMI patients.
1.2.1 Echocardiography and Systolic Function
RWMAs often occur after an AMI and often result in global LVEF impairment, which is the most common form of systolic dysfunction in NSTEMI patients. RWMAs result in reduced myocardial contraction at the site of or downstream from the occlusion and are identified by visualising areas of reduced systolic endocardial thickening at the blood/tissue interface within the left ventricle. LVEF is generated from the difference in left ventricular end-diastolic and end-systolic volumes from two orthogonal planes of the left ventricle in the apical four chamber and apical two chamber views, using the Simpson’s Biplane method [32]. These views are generated from the apical window which is located in the fifth to sixth intercostal space in the median axillary line. With the cursor marker pointing to
approximately one o’clock the apical four chamber view is visualised. A 60º-90 º anti- clockwise rotation creates the apical two chamber view while a further 60 º anti-clockwise rotation creates the apical long axis view. RWMAs and global LVEF identified with
echocardiography have been well-validated [33-36] and provide important information on the relationship between the location and extent of RWMAs present, ECG location and size, the status of the patient, complications and survival [37].
Infarct locations may be defined regionally: anterior, inferior or lateral or by afflicted coronary artery territory: left anterior descending (LAD), right coronary artery (RCA) or circumflex (Cx). Anterior infarcts and LAD occlusions are usually larger, associated with
25
lower LVEF and worse prognosis. A study published in 1987 by Hands et al. [38] assessed 42 patients (19 with anterior infarction, 23 with inferior infarction) presenting with their first STEMI. They found for similar sized inferior and anterior infarcts, anterior infarcts were associated with a lower resting LVEF, increased extent and size of resting RWMAs and increased exercise induced ST-segment elevation which contributed to a poorer prognostic outcome. Future studies may determine whether ST depression and T wave inversion is more marked in anterior NSTEMI infarctions than inferior infarctions. A study published in 2000 by McClements et al. [39] assessed 69 patients one week after AMI who received no thrombolytic therapy or revascularisation. They found a strong correlation between LVEF and the extent and size or RWMAs present. The LVEF was reduced most with an anterior infarction, suggesting that infarct size, location, severity and the extent of apical involvement were the most important predictors for LVEF. A study published in 1982 by Thanavaro et al.
[40] assessed 1105 patients presenting with their first transmural AMI – 611 anterior and 494 inferior. They found patients with inferior infarctions had lower in-hospital mortality (9.1%
vs. 15.6%; p 0.0014), and congestive heart failure rates (39.4% vs. 47.6%; p 0.006) than patients with anterior infarctions. Many different mechanisms have been investigated as explanations for greater LVEF impairment in anterior infarcts. The internal mechanics of cardiac function are complex and not completely understood. There are several layers of muscle in the myocardium which travel in different directions. Rotation occurs in the left ventricle with the apex and base rotating in opposite directions. The image below shows ST B-mode interpretation of torsion angles of the myocardium (Figure 1).
In the ejection phase (indicated by the number 2 at the top of the graph) the apex moves in a counter-clockwise rotation, while the base moves in a clockwise rotation, with torsion recoil apparent in the isovolumic relaxation phase (indicated by the number 3 at the top of the graph) and early diastolic filling phase (indicated by the number 4 at the top of the graph). Note that the LV base
moves with a lower magnitude than that of the LV apex.
Reproduced from Sengupta et al. [41]
Figure 1: Torsion of the Myocardium with Speckle Tracking
26
Studies performed on dogs by LeWinter et al. [42] found regional differences within the myocardium. Fibres shortened more at the apex than the mid-ventricular or basal wall.
Although the canine heart is similar in terms of physical mechanics to a human’s, it is not a perfect model, so results must be approached with a degree of caution [43]. It is also reported that as the apex is supplied blood by a single vessel (the LAD), if occluded, it will affect the entire apical region circumferentially resulting in the significant reduction of long axis shortening. Also, left ventricular minor axis shortening, the main contributor to left ventricular stroke volume, is also mainly dependent on blood supply from the LAD to the anteroseptal wall [39, 44]. A study published in 1986 by Tamaki et al. [45] utilised isotope ventriculography to determine variations in regional contractility in the first ten days post AMI. They found contractile improvements were greater in patients with single vessel disease in the Cx or RCA regions than LAD region. Furthermore, contractility improved more with single vessel disease than with multiple vessel disease.
There is an absence of data regarding RWMAs associated with NSTEMI presentations and their relation to angiographic findings. One study published in 1998 by Weisman [37]
determined the aetiology of chest pain presentations in an emergency department. He scanned 175 patients, 88 (51%) had no RWMAs while 87 (49%) had RWMAs present. Of the 87 patients with regional dysfunction, only 27 (31%) were diagnosed with an AMI. This study provides interesting information regarding the prevalence of RWMAs however does not differentiate between STEMI and NSTEMI nor does it state whether the RWMAs detected correspond to a specific occluded coronary artery. A retrospective audit was performed at Christchurch Hospital, New Zealand in 2007 utilising patients presenting with NSTEMI undergoing both echocardiography and angiography [46]. The study revealed 60% of NSTEMI patients had RWMAs on echocardiography, with 89% of the RWMAs correctly predicting the culprit artery identified with angiography.
Further studies have described how left ventricular remodelling (adverse structural and functional changes in myocardium remote to the infarct zone) in response to myocardial infarction may be site specific and an important prognostic indicator of cardiovascular events in the future [47].
27
There are gaps in existing NSTEMI literature with regards to identification of regional dysfunction and determining if the dysfunction visualised corresponds to a culprit coronary artery determined with coronary angiography. This research project hopes to bridge the gaps in literature concerning NSTEMI admission and systolic function as addressed above, in a limited sample population of 55 patients.
1.2.2 Echocardiography and Diastolic Function
The diastolic phase of the cardiac cycle has historically been somewhat overlooked as a non-invasive, quick technique to further determine prognostic outcome. Diastolic dysfunction is the result of increased myocardial stiffness from a variety of factors including interstitial oedema, fibro-cellular infiltration and scar formation after an AMI [48]. A process termed the diastolic cascade (Figure 2), when diastolic dysfunction precedes systolic dysfunction [49- 51], has been validated as an early indicator of congestive heart failure after an AMI [52-54].
The diastolic cascade begins with an oxygen supply and demand imbalance, followed by metabolic alterations within the myocardium. The physiology is rather complex, however, remodelling of the left ventricle post infarction (such as reparative interstitial fibrosis and the development of scar tissue) leads to impaired left ventricular relaxation, hypertrophy and asynchrony. Pre-existing diabetes may also predispose to diastolic dysfunction. Left ventricular hypertrophy, the primary cause of chamber stiffness, leads to diastolic dysfunction [55].
28
The diastolic cascade begins with perfusion abnormalities, which result in diastolic dysfunction, which then leads to systolic dysfunction (a reduction in left ventricular systolic function).
Where: EKG = electrocardiogram
Reproduced from Herzog et al. [56]
The determination of diastology by echocardiography is based mainly upon transmitral and septal tissue Doppler interrogation; however pulmonary vein inflow and colour m-mode flow propagation may also be used. Diastolic dysfunction can be broken down into four main patterns/grades (Figure 3). Grade one is mildly impaired diastolic dysfunction, with an abnormal relaxation pattern. Grade two is moderately impaired diastolic dysfunction, with a pseudonormal relaxation pattern. Grades three and four are severely impaired diastolic
dysfunction, with restrictive relaxation patterns, defined by an increased E wave and a short E deceleration time (<140ms). Grade three is reversible, while grade four is not [30].
Figure 2: Diastolic Cascade
29
Diastolic dysfunction patterns identified with echocardiography. In this diagram, Grade one is abnormal relaxation, grade two is pseudonormal relaxation and grade three is restrictive relation (grade four is not shown).
The MVF (mitral inflow) and TDI (tissue velocity imaging) profiles were used for this study.
Where: ECG = electrocardiogram; MVF = mitral inflow; PVF = pulmonary vein flow; TDI = tissue velocity imaging; colour m-mode = colour motion mode
Reproduced from Roelandt et al. [57]
A number of studies have examined whether restrictive diastolic dysfunction is useful in ACS presentations, to predict prognostic outcome, with have varied results. Occasionally studies have failed to demonstrate the value of these indices [58, 59]; however, the majority of studies find restrictive diastology to be an excellent predictor of clinical outcome,
associated with higher left atrial filling pressures and increased rates of mortality post AMI [48, 58, 60-63]. A study published in 2010 by Hee et al. [64] validated restrictive diastolic
Figure 3: Diastolic Dysfunction Patterns
30
dysfunction as a predictor of clinical outcome post STEMI in a long term (five year) study of 100 patients. Restrictive diastolic dysfunction was defined as an E:A >2 and/or a mitral E deceleration time of <140ms. They found patients with restrictive diastolic dysfunction had higher myocardial enzyme levels (p<0.001), a high E:A ratio, lower tissue Doppler imaging septal Em, increased left atrial volume, decreased LVEF and a higher incidence of all-cause mortality. As this study was retrospective, echocardiography timings were variable (within a 6 week range) and pre-existing diastolic dysfunction and co-morbidities (such as diabetes or heart failure) were not determined. Published in 2008, a large meta-analysis involving 3396 patients from 12 prospective post infarction clinical trials found ~20% incidence of restrictive diastolic dysfunction. These patients were more likely to have diabetes, hyperlipidaemia, anterior myocardial infarction, increased left ventricular volume, decreased LVEF and a higher Killip Class [65]. Two interesting findings from this study were: that restrictive diastolic dysfunction predicted outcome even with preserved LVEF, and restrictive filling was associated with a three-fold increase in all-cause mortality. The large patient cohort of this study suggests it is reliable as an indicator of a true patient population.
In the past, diastolic impairment with a preserved LVEF (defined as >50% [30]) was thought to be relatively benign in the setting of AMI, but this is now known not to be the case [65]. Although restrictive diastolic dysfunction has been fairly well studied and validated in ACS presentations, less is true for mildly impaired and pseudonormal diastolic dysfunction.
A prospective study on 125 patients post AMI found patients with pseudonormal diastolic dysfunction (defined when mitral E deceleration time was normal: 140-240ms, while propagation velocity was decreased) had a high occurrence of in-hospital heart failure and a poor prognostic outcome [60]. These patients were older with greater heart failure
complications than those with normal or mildly impaired diastolic dysfunction. Studies which have assessed mildly impaired diastolic dysfunction have yet found no significant correlation with mortality rates when adjustments are made for age, Killip Class and LVEF [66, 67]. The fact that pseudonormal diastolic function is associated with raised filling pressures, while mildly impaired diastolic dysfunction is not, may indicate a link between filling pressures and prognostic outcome.
31
A filling pressure (E/Em) of >15 has been associated with a worse prognostic outcome. A review in 2004 performed by Khouri et al. [68] stated E/Em >10 was abnormal, while E/Em was highly specific for raised left atrial filling pressures. This has been confirmed by other studies [69, 70]. A retrospective study in 2004 of 250 patients with AMI found filling
pressure to be a predictor of all-cause mortality [71]. Filling pressure is, however, affected by a number of factors including loading conditions (i.e. heart rate, beta-blockers and cardiac remodelling), which must be taken into account before relying heavily upon an E/Em value [72].
Left atrial dilatation is reported as a predictor of filling pressures and prognostic outcome.
When a left atrium empties into a stiff left ventricle, left atrial pressures increase (as the walls of a left atrium are thin due to a normally low pressure environment) and dilatation occurs [73]. Left atrial dilatation has been associated with an increase in all-cause mortality [74, 75].
A prospective study was published in 2011 by Kuhl et al. [76] involving 384 patients presenting with NSTEMI. These patients underwent gated 64-slice coronary angiography to measure left atrial size and function and were then monitored over two subsequent years.
Over two years, 9% of patients died. The left atrial minimal volume and fraction change were likely independent predictors of mortality, while left atrial maximal volume were likely not associated with increased mortality. Research published in 2004 by Beinart et al. [74] studied 55 patients admitted with AMI. They found patients with a left atrial volume >32mL/m2 had higher rates of congestive heart failure, mitral regurgitation, larger left ventricular volumes and lower LVEF. These patients also had higher five year mortality rates than patients with a left atrial volume <32mL/m2 (35% versus 14%). These studies confirm important prognostic information may be extrapolated from the size/volume of the left atrium.
The E:A ratio value is also recommended as an indicator of prognostic outcome. A meta- analysis (as yet unpublished) performed by Whalley et al. [77] utilising 2344 patients found E:A <1 had a mortality rate of 12.3%, E:A 1-2 had a mortality rate of 21.3% while E:A >2 had a mortality rate of 30.9%. The results showed that higher E:A ratios were related to increased rates of all-cause mortality.
32
1.3 Limitations of Current Clinical Echocardiography
Echocardiography is an effective, affordable, bedside diagnostic tool, but it relies on accurate individual assessment and interpretation of indices by an experienced reader, specifically for assessment of RWMAs post AMI. Also, often there are minute changes in systolic function which are too small or too quick for the human eye to process. For this reason, ultrasound manufacturers have created different methodologies for semi-quantifying or quantifying RWMAs, enabling less reliance upon individual interpretation, thereby
reducing bias. Two methods to be evaluated in our research are tissue velocity imaging (TVI) and speckle tracking (ST) from which velocity (v), strain (%) and strain rate (/s) data may be derived.
1.4 Conclusion: Literature Review - Echocardiography Characteristics of NSTEMI Presentations
In summary, previous literature has shown that the presence of diastolic dysfunction with echocardiography plays a vital role in determining the prognostic outcome of patients post AMI and may also indicate significant underlying CAD [78]. As diastolic dysfunction has been observed to precede systolic dysfunction, it may characterise disease earlier than visualisation of RWMAs or LVEF decline. Most studies showing echocardiography as a predictor of outcome post AMI have been conducted in patients with STEMI. Data concerning the NSTEMI population is fairly limited in comparison and certainly warrants further investigation. It is likely that the more severe grades of diastolic dysfunction will occur in lower prevalence in this population, compared to the STEMI population. However, it has been shown in multiple clinical scenarios that once severe diastolic dysfunction is
present, it carries poor prognosis, despite the underlying cause. Therefore, identification of diastolic dysfunction is an important adjunct to clinical information and may assist with management.
33
1.5 Advanced Imaging Modalities: Tissue Velocity Imaging and Speckle Tracking Derived Velocity, Strain and Strain Rate
To overcome the limitations posed by conventional two-dimensional echocardiography, new advanced echocardiographic modalities now enable semi-quantitative and quantitative assessment of regional dysfunction as well as the ability to detect underlying CAD. The two modalities to be evaluated in this research are tissue velocity imaging (TVI) and speckle tracking (ST). From these modalities, values for velocity (v), strain (%) and strain rate (/s) may be derived.
For TVI and ST derived velocity, normal segments (those with no RWMAs or CAD) will be positive in systole. Hypokinetic segments will be also positive in systole but of lower velocity. For TVI and ST derived strain and strain rate, normal segments (those with no RWMAs or CAD) will be high/increased negative waveforms in systole (further from the baseline). Hypokinetic segments will be negative; with lower/decreased strain values (will appear closer to the baseline). In the case of diskinesis, the waveforms of strain may be inverted (positive in systole when they should be negative). Studies determining normal values are discussed below, while normal TVI derived velocity, strain and strain rate values are shown in Table 21 in the appendix.
1.5.1 Tissue Velocity Imaging Derived Velocity, Strain and Strain Rate
TVI is a velocity based measurement which enables analysis (from time-interval
calculations and myocardial contraction/relaxation velocities throughout the cardiac cycle) of signals from tissue which have high amplitude and low frequency [79]. TVI uses myocardial Doppler frequency shifts to quantify tissue motion [80], is relatively load independent and considered an accurate indicator of systolic and diastolic function [81]. TVI images were obtained from a GE Vivid 7 machine (software version 2.2.1., GE Vingmed Ultrasound
34
System, Horten, Norway) with data analysis performed on EchoPac (GE Vingmed
Ultrasound System, Horten, Norway). The peak systolic myocardial velocity, strain and strain rate of all segments of the left ventricle is measured then trends are analysed and compared within the data set. A study published in 2010 by Dalen et al. [82] provided normal values for regional segmental assessment by measuring the peak systolic myocardial velocities in a large normal patient cohort (without prior cardiac history). TVI velocity traces are considered raw data as they are less processed than strain or strain rate traces and, therefore, the most reproducible [83].
TVI is based on the principle of Doppler, which was originally used for blood flow and obeys the basic laws of physics concerning fluid motion. Tissue Doppler contends with the motion of the myocardium, which is complex - the segments within the myocardium are affected by tethering of adjacent segments and by the overall translational motion of the heart [84]. To overcome this problem, myocardial strain and strain rate can be derived from TVI velocity traces on the prospectively on the GE Vivid 7 machine (software version 2.2.1., GE, Horten, Norway) or retrospectively with EchoPac (GE Vingmed Ultrasound System, Horten, Norway), if prompted. Strain is a dimensionless value. It is deformation (stretching) of an object, relative to its length, which may be positive (fibre lengthening) or negative (fibre shortening) [85]. Strain and strain rate provide regional and global information on myocardial contraction [80]. Strain rate provides information which is too fast for the human eye to process in real time. Post-processing of the waveforms allows comparisons between different areas of the myocardium [80]. The equations for strain (Figure 4) and strain rate (Figure 5) are described by the equations below:
Where: S = strain; l = instantaneous length; l0 = original length; ∆l = change in length; SR = strain rate; v = velocity; va-vb = difference in instantaneous myocardium at points a and b; d = distance in instantaneous myocardium
at a specific time
Reproduced from GE Healthcare [80]
Figure 4: Strain Figure 5: Strain Rate
35
Figure 6: Diagram of Longitudinal, Circumferential and Radial Strain
TVI derived strain and strain rate imaging may be used to analyse longitudinal shortening - which is negative strain (apical views), transmural function - which is positive strain (apical and parasternal short axis views), or circumferential function - which is negative strain (parasternal short axis views) [86] (Figure 6). This research will focus on longitudinal
(negative) strain and strain rate values obtained from the apical views, which studies suggest, are the most reproducible and the most accurate when assessing regional contraction and underlying CAD when compared with gold standard tests such as tagged magnetic resonance imaging (MRI) [86]. Transmural and circumferential strain indices are best proven for anterior and posterior segmental assessment and that is where their predominant clinical use lies.
Reproduced from Leung et al. [87]
The figure shows cardiac motion in the longitudinal (which is shortening and negative), circumferential aka transmural (which is shortening and negative) and radial (which is thickening and positive) directions.
36
Regional assessment is performed by analysing the peak systolic strain and peak systolic strain rate in 15 segments of the left ventricle. The values from each segment may be
compared with normal values by myocardial level (basal, mid, distal) or between walls (anteroseptal, anterior, anterolateral, inferolateral, inferior, inferoseptal) as suggested by Dandel et al. [82]. TVI derived strain rate is the most processed method of TVI imaging, so is the least reproducible, however, it is the least affected by tethering and torsion of the heart [85].
Various studies, including those of Urheim et al. [88] published in 2000 and Edvardsen et al. [89] published in 2002, have validated the feasibility of myocardial strain by Doppler echocardiography. Urheim et al. [88] induced apical ischemia in 13 anesthetised dogs. While the apical myocardium became diskinetic (indicated by strain and Doppler velocities), the basal segment values for strain by Doppler and strain by sonomicrometry and velocity of shortening by sonomicrometry were unchanged. Doppler velocities at the base showed decreased values (4.2+/-0.7 to 2.7+/-0.4cm/s) suggesting that strain is less influenced by cardiac tethering and cardiac motion. The major limitations of this study were that it was performed on anesthetised dogs and the sample population (13) was small. The study did, however, indicate the general trends and benefits of utilising TVI derived strain.
Edvardsen et al. [89] performed longitudinal and radial TVI strain and strain rate on 33 normal patients and 17 patients with AMI. In the 33 normal patients, the longitudinal myocardial Doppler velocities decreased from the base to the apex, while the myocardial strain and strain rate indices remained uniform. In the 17 patients with AMI, the infarcted segments showed only 1.5+/-4.3% longitudinal strain compared with -15.0+/-3.9% in remote myocardial segments. A further comparison between myocardial strain and strain rate indices and tagged MRI revealed excellent correlation with longitudinal values (r=0.89). Their study utilises a small patient population which is not indicative of a true population, therefore only trends should be analysed from this data. The frame rates used for TVI in their study ranged from 56-134 frames per second with a mean of 92. TVI involves the rapid analysis of increased velocity motion with very short duration, which means a high sampling rate is required. A study published in 2002 performed by Lind et al. [90] concluded frame rates with
37
a cut-off of 70 frames per second for E velocity analysis and 100 frames per second for all other systolic and diastolic analysis allowed an acceptable <10% deviation of results, with the optimal being between 141-203 frames per second (fps). This indicates that the frame rates used by Edvardsen et al. [89] were often lower than required (however, may conform to guidelines not stated in their research).
A study published in 2003 by Hasegawa et al. [79] investigated the ability of myocardial strain to quantify regional myocardial contraction in patients with normal wall motion and patients with RWMA. The study found that peak systolic strain values of segments with differing contraction were significantly different to one-another – normokinetic -20.1 ± 5.5%;
hypokinetic -11.9 ± 5.0%; akinetic -6.3 ± 3.4%. There was no significant overlap, suggesting myocardial strain agrees well with visually assessed wall motion. This study is limited by its small sample population of 13 patients with normal wall motion, and 18 patients with RWMA resulting in possible sampling/bias issues.
Studies have also shown the ability of TVI to detect significant underlying CAD (>70%
stenosis), with no visual RWMAs. A study published in 2008 by Choi et al. [91] showed mid and basal peak longitudinal strain cut off values of -17.9% to be indicative of detecting severe 3 vessel disease or left main CAD (sensitivity 78.9%, specificity 79.3%), when there was an absence of RWMA with standard echocardiography. The sample population enrolled in this study was limited (189 patients with suspected angina and 110 patients with suspected CAD);
however, important information regarding the diagnosis of underlying CAD was identified with this study. Future studies should employ a larger patient cohort to confirm these results.
For TVI derived velocity, increased myocardial contraction results in higher systolic values. TVI derived strain and strain rate in systole result in negative values, therefore, better myocardial contraction results in values further away from the baseline (more negative), while abnormal or reduced motion is indicated by values closer to the baseline (less
negative). In a heart with no diskinetic cardiac motion, strain and strain rate systolic values are always negative in systole. Although these methods appear to provide supplementary
38
quantifiable assessment of RWMA, TVI remains a Doppler based measurement. This means it is angle dependent and suffers from significant noise problems (especially at the apex), as well as difficulty in tracking the region of interest throughout the cardiac cycle and tethering from neighbouring segments [92].
1.5.2 Speckle Tracking Derived Velocity, Strain and Strain Rate
ST overcomes the limitations of TVI by tracking speckles (which result from constructive and destructive interference of ultrasound backscatter from structures within the myocardium, smaller than the wavelength of the ultrasound beam) from frame to frame with the geographic shift corresponding to local tissue movement [93]. The resulting information is then post- processed into traces showing the velocity, displacement, strain (a measurement of deformation) and strain rate (speed at which deformation occurs) of a specific myocardial segment [94]. ST is able to track the myocardium independently of cardiac translation and interrogation angle [95], with no significant base to apex gradient [85]. ST images were obtained from a GE Vivid 7 machine (software version 2.2.1., GE Vingmed Ultrasound System, Horten, Norway) with data analysis performed on EchoPac (GE Vingmed
Ultrasound System, Horten, Norway). The peak systolic myocardial velocity, strain and strain rate of all segments of the left ventricle is measured then trends are analysed and compared within the data set.
Studies have determined the validity of ST [92, 96-98]. A study published in 2009 by Amundsen et al. [92] compared TVI derived strain rate with ST derived strain rate using tagged MRI as a reference. They found ST may be used alone or combined with TVI, providing acceptable regional myocardial values. Also, that ST strain values were more reproducible than tagged MRI values. A study published in 2005 by Cho et al. [96] compared ST derived strain and TDI derived strain with tagged MRI. They found values for tagged MRI comparable with TDI and ST derived strain when assessing segments with dysfunction.
39
Global strain, the average of the individual segmental strain within an imaging plane (apical four chamber, two chamber of apical long axis view) has been associated with LVEF.
A study published in 2004 by Reisner et al. [97] found global longitudinal strain and strain rate values were good indicators of global left ventricular function with high sensitivity and specificity. The study had a small sample population of 27 patients post AMI. The study attempted to reduce bias by using a non-echocardiographer to interpret the results but this calls into question the ability/competence of the non-echocardiographer. A study published in 2006 by Becker et al. [98] suggested ST strain and strain rate assessment of regional LVEF, resulted in highly reproducible values with low intra-observer and inter-observer variation.
The patient cohort was small (64). Frame rates were between 56-92 fps which is excellent as frame rates for speckle tracking should be around 40-80fps to maximise spatial resolution for frame-by-frame tracking of acoustic markers [99]. These studies confirm the feasibility of performing ST derived indices as accurate indicators of both regional and global systolic function.
Various studies have validated the use of ST strain and strain rate when identifying RWMA. Decreased ST derived longitudinal segmental strain values imply a regional
myocardial infarction with greater sensitivity and specificity than TVI. A study published in 2007 by Gjesdal et al. [100] found peak systolic longitudinal strain values of -15% could identify an infarction (sensitivity 83%, specificity 93%) at the segmental level. The patient population sample was small (38) and the study only used the apical long axis window. A study published in 2010 by Eek et al. [101] found good correlation between infarct size, wall motion score index (r=0.74, p=<0.001) and global longitudinal strain (r=0.68, p<0.001) in patients with recent NSTEMI. The patient cohort was small (68), however, the study used tagged MRI, regarded as a gold standard test, as a reference. A study published in 2009 by Roes et al. [102] compared the ability of ST strain with contrast enhanced MRI to accurately assess the extent of endocardial scar tissue. Good correlation was found with cut-off values showing segments both without scar tissue (-10.4% +/- 5.2%) and with scar tissue (0.6% +/- 4.9%). They also found that a regional longitudinal strain cut off of -4.5% distinguished a non-transmural infarct from a transmural infarct (sensitivity 81.2%, specificity 81.6%).
40
1.5.3 Advanced Imaging Modalities: Current Lack of Clinical Utility
Neither TVI nor ST derived velocity, strain nor strain rate have been adapted as routine tests post AMI at the Christchurch Hospital, New Zealand Echocardiography Department.
From discussions with others in the field, it is noted that few hospitals have adapted these modalities into routine (non-research) clinical practice. They are, however, often utilised in echocardiography research laboratories. The author has noted a greater number of research protocols from national and international studies performed at Christchurch Hospital, New Zealand are requesting the images required for analysis with these modalities. However, discussions with people in the field of echocardiography yield negative comments towards the use of strain in a clinical (non-research) setting and literature regarding the use of these modalities in a clinical (non-research) setting is limited.
Various literature reviews and studies, including those published in 2011 by Hoit et al.
[103], in 2010 by Antoni et al. [104] and in 2005 by Ingul et al. [105], confirm the need for further research in this field. In their research conclusions, they state that, although their advanced imaging modality of choice was promising, more studies are required in the field to enable use of the modalities in a clinical (non-research) setting. Antoni et al. [104] found strain imaging a time consuming process, which means to use these modalities in a clinical setting, more time should be allocated for analysis, than that of a normal routine study. Choi et al. [91] studied the association between underlying CAD with no visible RWMA and strain imaging with the