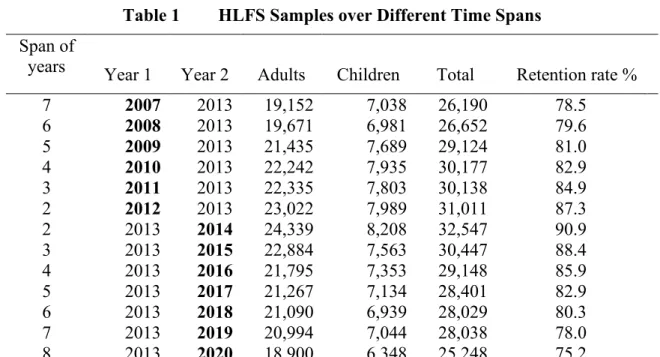
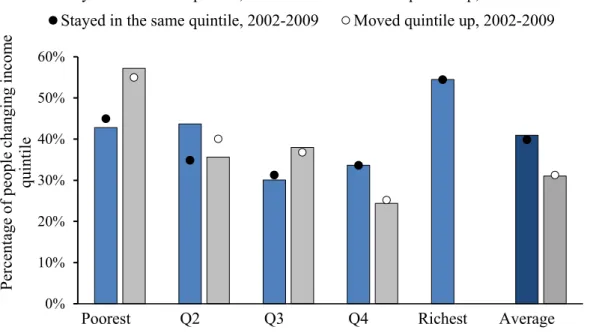
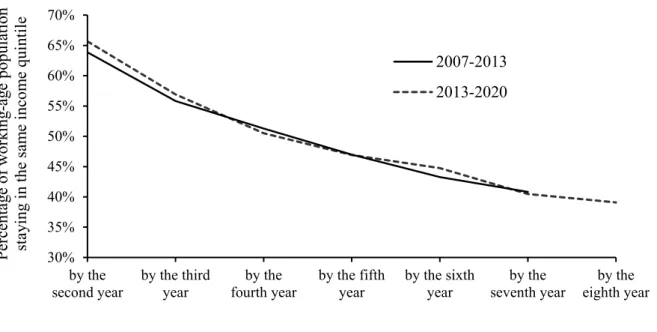
During the period, about half of New Zealand's working-age population remained in the same income quintile over four years and 40% over seven to eight years. Following the widespread assumption of equal sharing in the family, the total income per adult equivalent person each person in the family. The second study found that 57.3 percent of the population remained in the same quintile from one wave to the next, and 38 percent remained in the same quintile from wave 1 to wave 8.
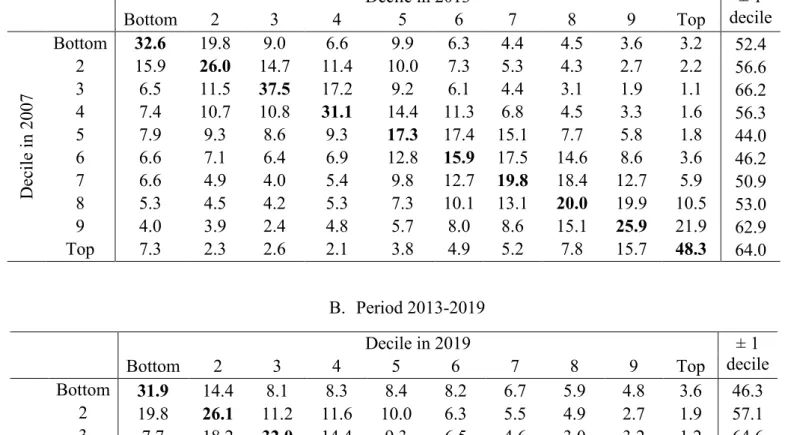
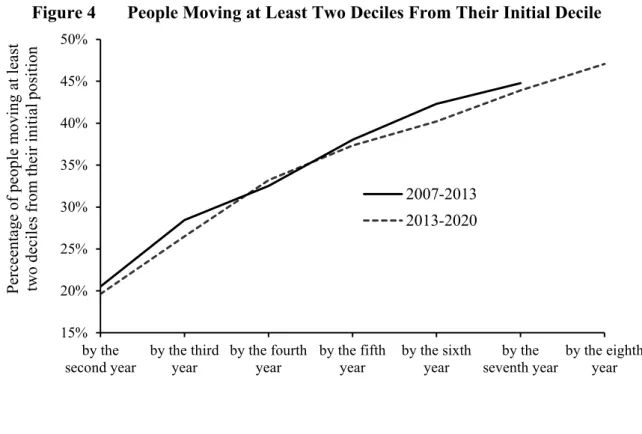
As emphasized above, the unit of income is the individual, so that each individual in the family is assigned income per adult-equivalent person. Of those initially in the top income decile, 64 percent were in the top two deciles in 2013. In addition, 67.1 percent of those who were in the highest decile in 2013 remained there or in the second highest decile in 2019.
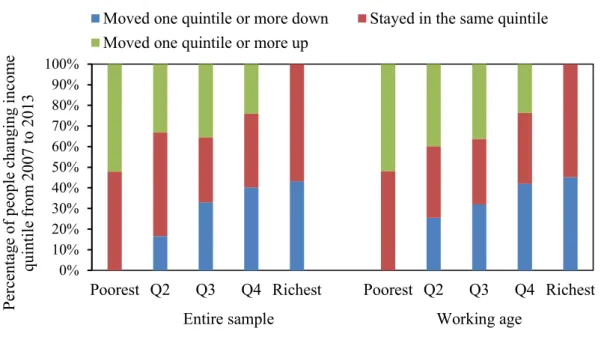
Note: The final column is the percentage of individuals who in 2019 remained in the same decile or in the decile immediately above or below their decile in 2013. Moved one quintile or more down Stayed in the same quintile Moved one quintile or more up. It looks at the proportion in each quintile in 2013 that stayed in the same quintile or had increased by 2020.
On average, 41 percent of the population remained in the same quintile, and 31 percent moved up a quintile during this period.
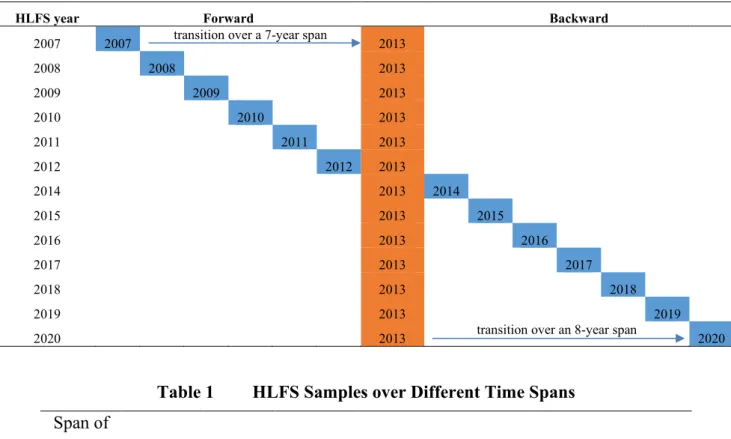
Transitions for Working-Age Individuals
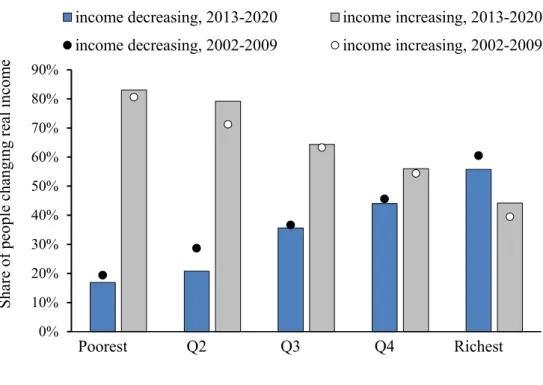
This may be partly due to the transition of income over the life cycle.20 For example, students and young people before starting their work are more likely to experience income growth in the medium term compared to the average population. Equivalently, individuals who started out in low-income households were less likely to experience real income declines over time than those from high-income households. Of those in the bottom quintile in 2013, 83 percent experienced an increase or no change in real income in 2020, while about 56 percent of the richest quintile increased their real income or remained at previous levels. real income.
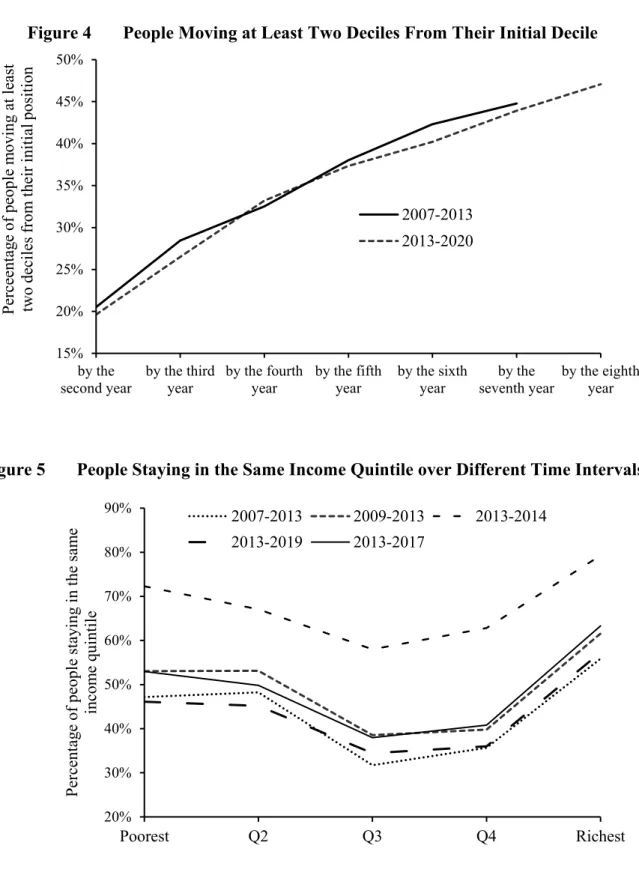
These profiles show that income mobility is lower for people in the bottom quintile compared to middle-income groups, and even lower for those in the top quintile. Of those who started in the bottom quintile, more than half remained in the same quintile four years later, and more than 45 percent remained in the same quintile seven years later. Nevertheless, as Figure 8 shows, most of those in the poorest quintile experienced real income increases over the eight years, although these increases were not sufficient to allow many of them to move into higher quintiles.
In the richest quintile, almost two-thirds of them stayed there in the medium term (four years).
4 Some International Comparisons
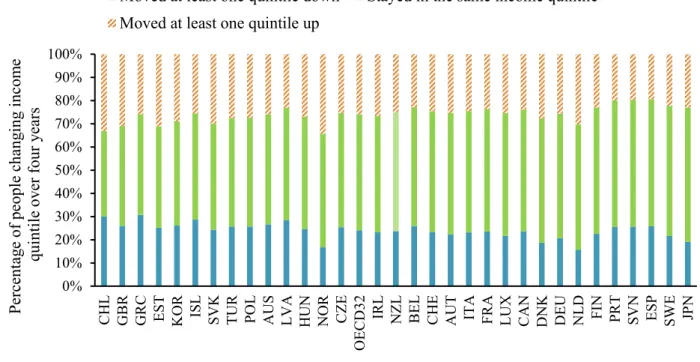
Just over half of New Zealand's population remained in the same income quintile over the medium term (four years). Compared to OECD countries, mobility in New Zealand is similar for the top and bottom quintiles, with somewhat less mobility for the middle quintiles. The obvious similarity is that there is less inter-quintile mobility at both ends of the distribution.
Moved down at least one quintile Remained in the same income quintile Moved up at least one quintile. Forty-two percent of working-age New Zealanders who started in the third quintile remained in the same quintile after four years. For these people, a small change in real income can lead to a change in their income quintile.
The average proportion in the OECD moving out of the third quintile over four years was somewhat higher than in New Zealand (38 per cent versus 42 per cent remaining in the same quintile). For the US, where data is collected on a semi-annual basis, the result is based on the average between the results of the 3-year and 5-year panels. Among OECD countries, there were several different patterns combining the mobility of those in the bottom and top quintiles over four years.
For example, the United Kingdom, Denmark and Japan belong to the group where there were higher transition proportions for those at the bottom but lower proportions for those in the top quintile. Norway, Germany, Austria, the United States and Ireland were in the low-mobility group at the top of the income distribution with average transition proportions at the bottom. New Zealand is at the average level of OECD countries and in the same group as Australia, Hungary and Switzerland: these showed average levels of mobility for those in the bottom or top quintile.
5 Low Incomes and Mobility
- The Foster-Greer-Thorbeck (FGT) Measures
- Short and Longer-Term Low Incomes
- Low Income Dynamics
- Sample 2013-2020
- Sample 2013-2015
- Sample 2009-2013
- Sample 2013-2017
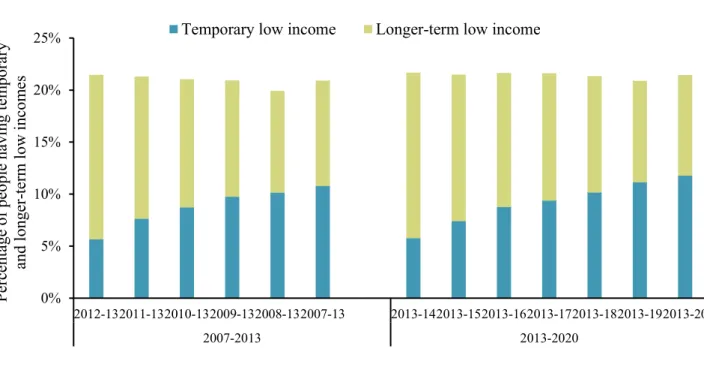
OECD (2008) defines people with low income in three years over a three-year period as the persistent poor. Let the superscripts, T and L, refer to temporary (or short-term) and long-term low income, and the low-income threshold in period, t, is yp,t. In reporting these components for NZ, the low-income threshold is set at 50 percent of median income.
Average measures of low income, LT, are reflected by the height of the bars, which are two-year average levels. The light green bars show the long-run component, LTL, or the proportion of people with low incomes in both years, as defined in equation (7). In particular, the height of the blue bar represents the percentage of people with that characteristic who have low long-term income.
A simple way to distinguish between a group that is overrepresented in the long-term low-income population is to derive the relationship between the long-term component and the proportion of the population:. this is the relative long-term relationship. The higher the proportion, the greater the probability of being overrepresented in the long-term low-income population. Consider low-income individuals in 2020 who were also below the relevant low-income threshold in 2013 (shown in panel B of Figure 19).
The following characteristics were found to be associated with a higher probability of having a long-term low income than the average population. Asians were found to have slightly higher long-term low income rates than Māori or Pacific people, according to this measure of intensity. Percentage, normalized low-income gap and squared normalized low-income gap (three FGT measures respectively) of persons with low income in both years.
Percentage, normalized low income gap and squared normalized low income gap (three FGT measures, respectively) of people with low income in both years FGT (α=0) FGT (α=1) FGT (α=2). For people who have a low income at a certain point in time, the chance of a low income in the longer term increases. Here too, not all people who were below the low-income threshold in a certain period also had a low income in both periods, because there were substantial differences between the longer-term components and the average low-income measures.
These decompositions help identify the characteristics of people who are likely to experience low income over the longer term than the average population, including non-European single-parent families and non-working single-parent families (whose low-income rates are much higher than the averages of the entire population). Percentage, normalized low-income gap, and quadratic normalized low-income gap (three FGT measures, respectively) of low-income earners in both years.
6 Conclusions
Appendix: Further Data
John Creedy er professor i offentlig finans ved Wellington School of Business and Government, Victoria University of Wellington, New Zealand.
Working Papers in Public Finance