This paper focuses on the potential contribution of the sovereign wealth funds (SWFs) of Tuvalu and Kiribati to reducing reliance on foreign aid for subsequent disaster risk management. The separation of Tuvalu from Kiribati, along with their independence from Great Britain, led to the creation of the Tuvalu Trust Fund (TTF), while Kiribati's Revenue Equalizer Reserve Fund (RERF) had already been established.1. Interestingly, the proposed formation of the Pacific Islands Climate Change Insurance Facility (PICCIF) has become a popular topic in the.
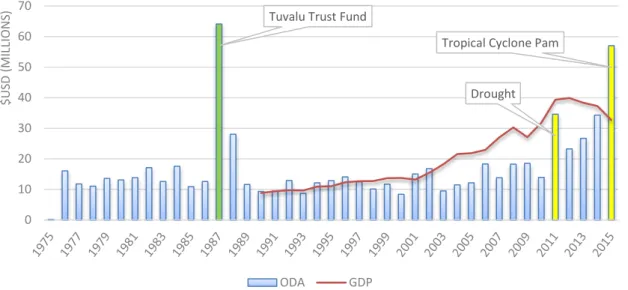
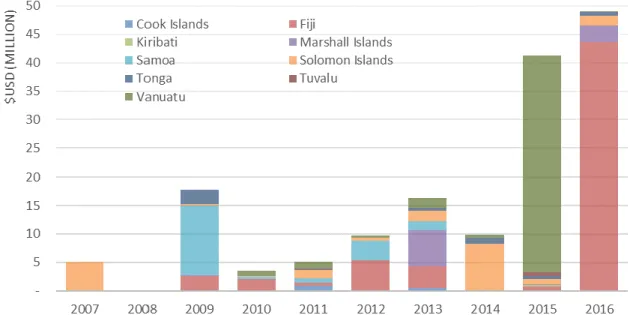
The year of the creation of the Tuvalu Trust Fund is represented by the highest peak, in 1987 (green bar). The International Forum of Sovereign Wealth Funds (IFSWF) emerged from the 2009 'Kuwait Declaration', as successor to the IWGSWF. The Timor-Leste Petroleum Fund (TLPF) is the only Pacific SWF member of the IWG.
One of the priority goals set at the 2015 National Summit on Sustainable Development (NSSD) for Tuvalu is to protect the country from the impacts of climate change through increased resilience, mitigation and adaptation.
Data and Methods
In our case, we applied it to an investment portfolio with a given initial value, average annual return value, standard deviation or volatility of return per year, and assumptions about possible reinvestments and withdrawals. An example is when we generate a random rate of return for one year from today using a function that assumes the rate of return follows a normal distribution. One is obtained by using a random function where the mean of this normal distribution is the average rate of return with the volatility or standard deviation of the return.28 There are many possible returns, so we can generate other possible returns one year from now.
For the final balance, we multiply the initial balance by the annual rate of return and add assumptions (e.g. adding investments) until the end of the year. 28 Average rate of return and standard deviation of return are based on historical data. As a percentage of SWF, the average rate of return is 7.06% and 4.7% for TTF and RERF, respectively.
We used the ARIMA model proposed by Box and Jenkins (1970), which is an extension of the Auto-Regressive Moving Average (ARMA) model.31 The ARMA is the combination of Auto-Regressive (AR) and Moving Average models (MA). it thus combines both 𝑝 autoregressive terms and 𝑞 moving average terms), both of which lagged behind values of 𝑦𝑡 and 𝑡 errors from the past (see, e.g., Diebold, 2006). The first component in the ARMA model is the AR model, where the value in a period is related to the values in previous periods. The second component is the MA model, which takes into account the relationship between a variable in a period and the residuals in previous periods.
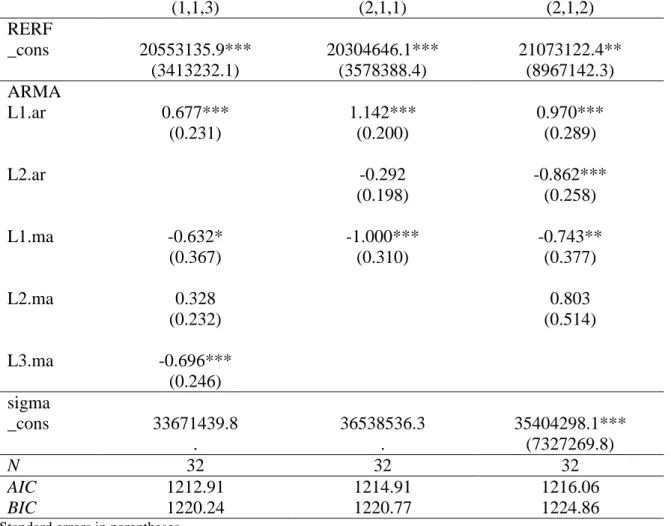
Therefore we arrive at the ARIMA model where 𝑑 is the required degree of difference to make the series stationary (the number of times the data has been subtracted from past values), for example, a first-order difference in 𝑦𝑡 is the difference variable 𝑦𝑡 = 𝑦𝑡− 𝑦𝑡−1 (Box & Jenkins Hyndman & . Athanasopoulos, 2014). Here, values of our dependent variable 𝑦, measured in time, 𝑡, represented by 𝑦𝑡, are affected by the values of 𝑦 in the past (or lags), is a constant, 𝑝 is the coefficient for the. However, we can resort to the Box-Jenkins procedures (see Box & Jenkins, 1976) using an ARIMA model (see equation 1), which is why we chose ARIMA instead of ARMA.32 We follow the Box-Jenkins method for ARIMA model selection in our diagnostics, where we use the Dickey-Fuller tests for stationarity33, Autocorrelation Function (ACF) and Partial Autocorrelation Function (PACF) for correlations, and Akaike Information Criterion (AIC) and the Bayesian Information Criterion ( BIC) measures of goodness of fit of the model (see Box & Jenkins, 1976; Makridakis, Wheelwright, & Hyndman, 1997).
Results and Discussions
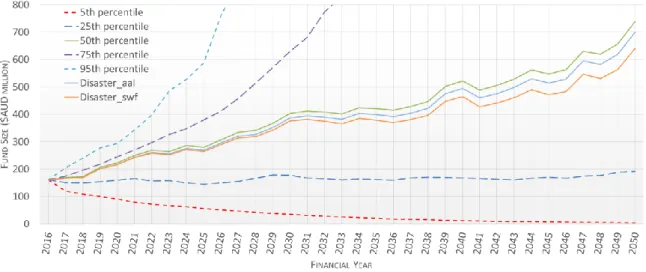
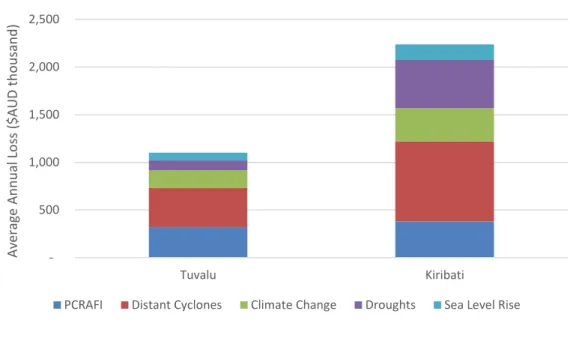
The adjusted AAL for Kiribati is derived from the sum of the current AAL USD$289,186=AUD$379,403 and the distant cyclone component of. The progression of the size of these SWFs over time, including withdrawal and investment inputs according to their account structure and rules, is shown in Figure 8 and Figure 9 for the TTF and RERF, respectively. In general, they show the distribution and dispersion of possible values (or end results) of the funds over time.
Disaster_swf is the 50th percentile of TTF with adjusted calculations to include the adjusted AAL as a percentage of TTF to change overtime based on forecast values of TTF. The adjustments in (2) correspond to annual contributions as a percentage of SWF.52 This way of using the percentage of AAL on SWF would accumulate total estimated contributions in 2050 of about $97 million for the TTF and $126 million for the RERF.53 Figure 8. Intuitively, the effects of contributing to a disaster fund in the expected outcomes of the SWFs are shown by a downward shift in the median with an increasing gap as we move into the future .
To further substantiate this argument, we plotted the relationship between SWF and projected GDP to examine how sustainable the size of the SWF will be relative to GDP (see Figure 3 and Figure 4 in the Appendix). Based on our selection criteria (see Table A2 and Table A3), we selected our parsimonious ARIMA (1,1,1)56 and ARIMA (1,1,3) models to predict TTF and RERF, respectively, as both have significant coefficients and the lowest AIC and BIC indicating good model fit. Disaster_swf is TTF with adjusted calculations that include adjusted AAL as a percentage of TTF so that it changes over time based on predicted TTF values.
The disaster without disaster (in green color) is the expected trajectory of the SWF without annual contributions to the disaster fund. We also mapped the ratio of SWFs to expected GDP to further explore how sustainable the size of SWFs will be relative to GDP (see appendices Figure 5 and Figure 6). The impact of the 2008/2009 global financial crises was clearly visible in the sharp decline in GDP (see Figure 3 for Tuvalu) in 2009 and SWF size (see Figure 10 for the TTF and Figure 11 for RERF) in that periods.
Part of the problem was that the government withdrew annually between 2003 and 2013 without contributing to the RERF. The average annual withdrawal as a percentage of the SWF would likely increase by percentage points of 0.68 for the TTF and 0.29 for the RERF.
Conclusion
On the other hand, the current average contributions to the SWF for the TTF are approximately 7.422% of GDP, which is only If TTF revenue is used, it would probably be necessary to have the support of Australia and NZ as TTF board members and ongoing contributors. In principle, the TTF responds well to external economic shocks, but does not provide a sustainable treatment for natural disasters.
It is clear that the TTF was established to broadly address national budget deficits, support national economic development and achieve greater national financial autonomy. Therefore, natural disasters are excluded as a major threat. However, the TTF agreement does not clearly state that natural disasters are explicitly excluded. Given the recent threat of disasters (beyond economic shocks), there should be a trigger clause in the TTF mandates to include disasters, or they should revise and expand the TTF mandates to include some form of DRM function to include.
This can be prepared by the Ministry of Finance in collaboration with the Climate Change and Disasters Unit. It can also be extended to other international meetings that focus on climate change and disasters, such as Convention of the Parties (COP) meetings, the UN World Conference on Disaster Risk Reduction, European Union meetings and others. An example of an upcoming event is the 23rd session of the COP (or COP 23) of the UN Convention on Climate Change (UNFCCC), which will be organized by Fiji and hosted by UNFCC headquarters in Germany.
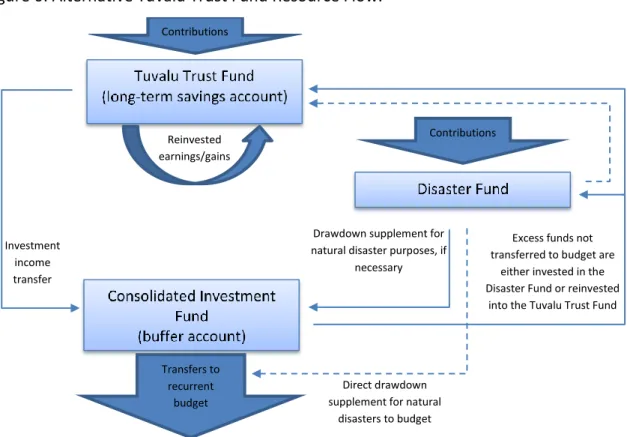
It must be strategic in nature and with the awareness of the members of the AOSIS (Alliance. Nevertheless, these disaster funds can be converted into long-term investment funds comparable to the TTF and RERF when it is deemed viable and appropriate.61 In this way, they can be separately be operated in a sustainable manner that builds on its capital with good governance rules to guide management and encourage prudent reinvestment and withdrawal Similarly, for the disaster fund it can be managed and operated in the same manner but with the sole purpose of financing disaster preparedness, response and recovery.
Bibliography
Enhancing Macroeconomic Resilience to Natural Disasters and Climate Change in Small Pacific States. The Economics of Climate Change and Natural Disaster Risk in Pacific Island Countries to 2040. Retrieved March 30, 2017, from http://www.radionz.co.nz/international/pacific-news/268736/kiribati-reports- severe- damage-in-the-south-from-pam.
The Economic Growth Impact of Natural Disasters in Developing Countries: Evidence from Hurricane Strikes in the Central American and Caribbean Regions. International Development Association Supplementary Funding Document for a proposed Supplementary Funding of SDR 2.2 million from the Crisis Response Window of the International Development Association to Tuvalu for the second development operation. Trust Funds and Fiscal Risk in the North Pacific (Analysis of Trust Fund Regulations and Sustainability in the Marshall Islands and the Federated States of Micronesia).
Appendix
Note: L1.ar is the first lag of the autoregressive (AR) part, L2.ar is the second lag of the AR part, L1.ma is the first lag of the moving average (MA) component while L2.ma refers after the second delay of the MA part, and L3.ma is the third delay of the MA component. Note that the outlier (1987) goes up to about AUD$24 million, which was when the TTF was established.