The distribution of income and tax incidence by age and sex: Some evidence from New Zealand∗. For New Zealand, there are currently few age- or gender-based analyzes of income distribution or tax incidence. Demographic patterns and the distribution of market income in New Zealand Before we examine the role of age and gender in income distribution and tax incidence.
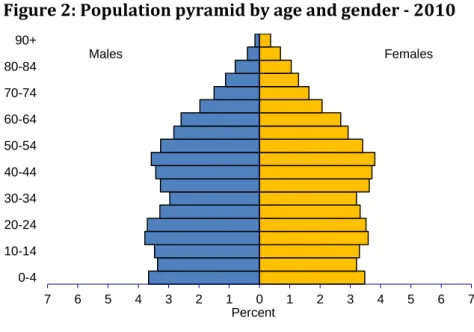
Demographic Patterns and the Distribution of Market Income in New Zealand Before examining the role of age and gender in income distribution and fiscal incidence it
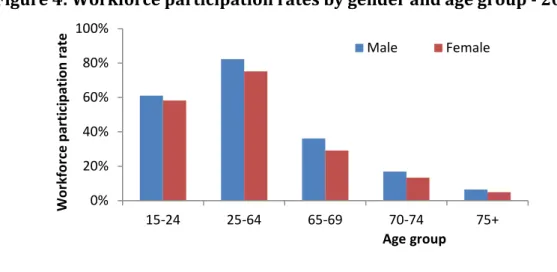
The data presented are the average market incomes of all citizens, including those who are not employed. Once employed, differences in average wages and higher rates of part-time employment may contribute to women's lower market income. This double effect means that women's market income is significantly lower than men's, even when only employees are considered.
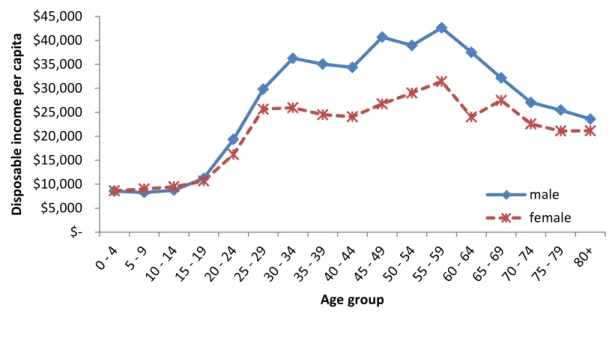
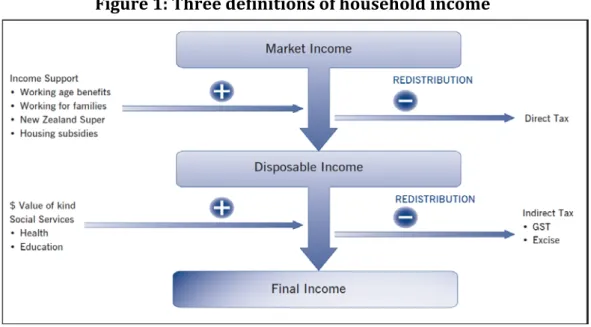
From Market to Disposable Income
This decrease in taxable benefits is later countered by an increase in taxable market income in the 45-59 age group as shown in Figure 3. In principle the diagonal of the table captures those couples where both partners earn in the same band of 10,000 dollars. Across all groups 23% of couples are in this category - where both earn in the same income bracket.

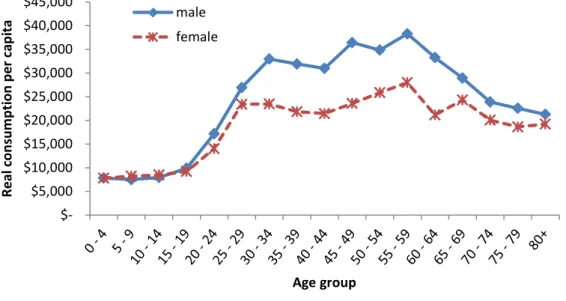
From Disposable Income to Final Income
In terms of gender differences, slightly more indirect burden is attributed to women than to men in the under-25 age group, peaking at 23% per capita for the 10 to 14 age group. This difference is sensitive to the method of allocating disposable income and intra-household indirect taxes included in the analysis. The greater relative number of women in the 80+ age group results in a greater incidence of indirect burdens attributed to them.
Nevertheless, men of all ages pay on average 21% more in indirect taxes per capita than women. 14 See Gibson and Scobie (2001) for a discussion of the age-relatedness of saving in the HES. Interestingly, spending is noticeably higher for women in the 20-24 age group: on average, women receive 62% more funds than men.
In the 70-79 age group, men seem to cost more per capita than women, but this trend reverses in the 80+ age group. For example, Mays (2012) reports that typically half of an individual's lifetime health costs are generated in the last 12 months of life. Given that the average life expectancy of men falls in the 70-79 age group, this could happen. expensive university courses) in New Zealand in 2009 also indicate higher female participation; see Poole et al.
The per capita difference for men and women between the ages of 30 and 64 falls from 89% for market income to 43% for disposable income and then further to 35%.

Net Fiscal Impacts
One possible hypothesis is that retraining during the child-rearing years, which precedes re-entry into the labor market, leads to an increase in market income and, consequently, higher direct taxation. The combined effect of reduced education expenditure and increased direct taxation improves the net fiscal position of women in the 45-49 age group. As mentioned earlier, the data used in this paper are cross-sectional (for the year 2010) and therefore cannot be interpreted directly as profiles of an individual's life cycle.
Despite these limitations, it is useful to consider the cumulative net tax effects across age groups. This is different from the life-cycle profiles produced by generational accounting exercises, which are typically accumulated forward from a given age to assess residual tax liability (see Section 8). As can be seen, the positive net fiscal effect for women aged 45-59 never outweighs the earlier negative net fiscal effects.
Consequently, when large negative net effects of retirement years occur, they only add to an already negative profile. On the other hand, men appear to have a positive cumulative net fiscal effect from about age 40 to 80. For these specific taxes and public expenditures, the net fiscal incidence for men is approximately zero when cumulated over all ages.
Sensitivities and Extensions
This means that, on average, a larger share of disposable income and indirect tax payments and net fiscal effects is attributed to them. Figures 18A and 18B show the effects of the introduction of the equal sharing assumption on disposable income and indirect taxation. As expected, equal sharing affects the distribution of disposable income and indirect tax by redistributing both from working-age males to dependents.
Despite the impact of the sharing assumption on indirect taxes in Figure 18B, there is only a negligible change in the net fiscal impact (not shown). Indirect taxes are a relatively small factor in the net budgetary impact and therefore changing assumptions about distribution has a negligible overall effect. The figure compares the distribution of disposable income by gender and age group under the assumptions of sharing based on the OECD scale (as applied in previous sections) and non-sharing, i.e. individuals keep what they earn after taxes and transfers .
If no division of disposable income is assumed among family members, then individuals who work keep what they earn and those who do not earn are allocated no share of the family's disposable income. To examine heterogeneity, Appendix 1 reports, for each component of the net fiscal incidence analysis (market revenue, direct taxes, etc.), incidence at the 25th, 50th (median), and 75th percentiles for every age group and gender. Here we report the overall impacts on net fiscal incidence in Figures 19A and 19B for men and women, respectively.
For older age groups, it is clear that, at least for net fiscal incidence results, heterogeneity of experience is much less of an issue.
Indirect tax per capita
Disposable income per capita
Life-Time Fiscal Incidence
The lifetime tax burden, as reported by Auerbach et al (1994), Ablett (1996) and Cardarelli et al (2000) for the US, Australia and UK respectively, is usually reported as total tax (net of transfers) liability of each age group in a given year. For example, in 2010, the generational accounting estimate of lifetime incidence in 2010 refers to the net tax paid over the rest of their lives, not the total age span up to 1960. Under these assumptions, Figure 20A shows the expected net tax over the entire lifespan. (all taxes minus transfers) and net fiscal (net taxes plus expenditure on education and health care) for each age cohort in 2010, separately for both men and women.
We can account for this by adding a uniform growth rate to the (net) tax liabilities of each age cohort, so that its net tax liability increases, other things being equal, as each cohort ages over time. We also do not discount future liabilities, which would be necessary to obtain an estimate of the present value of the life. The net tax and net tax profiles in the figure nevertheless reveal strong sigmoidal shapes such that these tend to rise (or remain flat) from ages 0-4 up to those aged around 25 in 2010, and then decline steadily for them aged around 25-65 in 2010, before rising again among the older cohorts.
There are also big differences between men and women; For example, it is predicted that in 2010 a boy aged 0 to 4 will have a positive net tax liability throughout his life, while for a girl it will be substantially negative. For the oldest age group (80+), net tax or tax liabilities approach zero because these ages have fewer numbers and fewer years left to be net tax collectors or payers. This US evidence is based solely on net income tax (taxes minus transfers) and refers to average tax payments by age group in the year 1991.
Despite these differences from those used to obtain the results in Figure 20A, the profiles in the two cases show remarkable similarities; in particular, the same sigmoid shapes, higher net tax liabilities of men compared to women, and older age groups are net tax takers rather than payers, but approach zero towards the end of life.

Conclusions
For example, Statistics New Zealand projects have increased labor force participation, particularly among women and those over 65. 19. The growth of the older demographic may also trigger changes to New Zealand's superannuation, which in turn lead to changes in the fiscal situation of the over 65s. Bakker, I., 1994, Introduction: Macroeconomic Policy Reporting in an Age of Global Restructuring and Adjustment in I.
Creedy, J., 1997, Lifetime Inequality and Tax Progression with Alternative Income Concepts, Review of Income and Wealth. Creedy, J., Disney, R and Whitehouse, E., 1993, The earnings-related state pension, indexation and lifetime redistribution in the UK, Review of Income and Wealth. University of Chicago Press). social security system, NBER Working Paper No. and Wodon, Q., 2002, Consumption dominance curves: testing the impact of indirect tax reforms in Bolivia, Economics Letters.
An assessment of the potential anti-poverty effects of the recent increase in age-specific minimum wages in New Zealand, Income and Wealth Review. Mays, N., 2012, Reorienting New Zealand's health care system to meet the challenge of long-term conditions in a fiscally constrained environment, paper presented at the Affording Our Future Conference, 10-11 December 2012. http://www. victoria.ac.nz/sacl/about/cpf/events/affording-our-future-conference- 2012/papers). Marriages, http://www.stats.govt.nz/browse_for_stats/people_and_communities/m arriages-civil-unions-and-divorces/info-releases.aspx, accessed 5/12/2012.
Ter Rele, H., 2007, Measuring the lifetime redistribution achieved through Dutch taxation, cash transfers and non-cash benefit programs, Review of Income and Wealth.
Fiscal Incidence Components - Percentile graphs
Re-entry into the labor force can be observed in the lowest quartile from age 40 onwards. In both cases, high earners skew the distribution and raise the average above the median. In A1.3 and A1.4, the asymmetry of the distribution in both graphs results in the mean being significantly higher than the median, in some places greater than the 75th.
This is a consequence of some adults receiving high transfer payments, thus skewing the distribution away from the mean. For this reason, the quartile charts do not account for many of the male recipients of income support. To remedy this, graphs a!.5 and A1.6 below show changes in the level of income support received, considering only those receiving transfer payments.
It can also be seen that the mean exceeds the median by a larger amount than the market income. This may be due to the progressivity of the tax system, which causes people with higher incomes to pay a higher proportion of tax, which raises the average. Both disposable income graphs in A1.9 and A1.10 show smaller differences in incomes at both ends of the life spectrum.
The differences shown in the working age range are larger for men than for women, perhaps due to a greater difference in market incomes.
Analysis at the aggregate level
Working Papers in Public Finance