In the case of construction projects, the concept of 'best value' must be considered from the perspective of the customer. They also examined the current state of the literature on 'best value' in construction project procurement.
INTRODUCTION
In part this was the result of a 'rethinking' of the role of purchasing or procurement in the manufacturing enterprise. Although in the short term the costs fall on the seller rather than the customer, ultimately it is the customer who ends up bearing the higher costs through higher prices for subsequent projects.
EXPLORING ‘BEST VALUE’
Introduction
Current usage of ‘Best Value’
Best Value in Public Sector Service Provision
Rees and Gardner (2003) suggested that 'best value' could be seen as dealing with the embedded culture of local government. In this report, 'best value' will be explored from a business enterprise and public sector perspective.
Best Value
The Kennett government in Victoria, Australia also introduced CCT and the Bracks government replaced it with a "best value" regime. "Best value" was not clearly defined, so there was and is a lot to consider when trying to address "best value" in construction contracts.
Best Value in the Public and Private Sectors
Donnelly (1999) emphasizes the complex nature of government when he suggests that the goals and actions of government go beyond direct service delivery to embrace broader societal goals.
Public Sector
The move to ‘best value’ in the UK
Curry (1999) stated that the intention of the Best Value regime was to replace CCT with the intention of still retaining the competitive element over the mandatory element. Wisniewski and Stewart (2001) state that it was clear that Best Value was more than just a simple substitute for CCT.
The Development of ‘best value’ in the UK
Shortly after the election, a Best Value TaskForce was established and mandated to develop a detailed framework for Best Value in Scotland (Wisniewski and Stewart, 2001).
Best Value’ in Scotland
Detailed commitments
The BVTF continues to play an important role in the development of Best Value guidance in Scotland. In England and Wales the best value centered around the four Cs; competition; challenge; comparison; and consultation (DETR, 1998a, cited in Sheffield and Coleshill, 2001).
Governance
Performance improvement measuring and monitoring
Continuous Improvement and competition
In addition, Scotland has established accountability, transparency; Continuous improvement and ownership as key principles of the Scottish approach to best value (Sheffield & Coleshill, 2001). However, the Scottish experience shows that the initial, rather ill-defined concept of best value can develop into a robust approach to public procurement.
Local Government in Scotland Act 2003 (LGIS Act)
While many researchers have written about Best Value and its development in the UK, there are still no firm definitions as to what exactly Best Value is.
Best value criteria
Auditing the Scottish Best Value Approach
The Accounts Commission for Scotland receives a report after each best value audit containing contextual issues, the main issues arising from the audit and conclusions. For example, a Council's use of the Power to promote wellbeing should be influenced by Best Value and the Community Planning process.
LGIS Act Part 1 (Best Value and Accountability)
Instead, it presents as clear a picture as possible of the overall performance of the council. As the Act provides a framework for better delivery of public services, no part of the Act can be considered in isolation.
Duty to secure best value
This reflects the depth of the audit and the time that councils need to implement improvement measures effectively. In maintaining this balance, the local authority must take into account efficiency, effectiveness, economy and the need to meet the requirements of equal opportunities.
Financial and performance reporting
To ensure best value, the local authority will maintain an appropriate balance between quality, cost and charges. The local authority will fulfill its duties in a manner that contributes to the achievement of sustainable development.
Role of Audit Scotland
When measuring performance, the extent to which outcomes have improved must be taken into account. Audit Scotland is currently working on a new approach to auditing Best Value – as it is now a legal obligation.
Summarising the Key Features - Best Value Audit
Best value in Victoria in State Local Government
The third year (2003) of best value implementation in local government is now being assessed in the Commission's Annual Report 2003. Among the recommendations of the 2003 report is that the benefits of best value should be promoted more widely across the sector.
Conclusion
That the best value principles framework encourages councils to adopt innovative and creative responses to service delivery, including a range of partnership relationships. The next phase is to investigate the application of the best value approach to construction project procurement.
BEST VALUE’ IN CONSTRUCTION PROJECT PROCUREMENT The Business Enterprise
Can a 'best value' framework be developed that is rigorous, robust and capable of withstanding the scrutiny of independent external audit?" is answered in the affirmative based on the outcomes in another jurisdiction. As highlighted, there is a significant difference between the meaning of best value for business and public sector procurement.
Public Sector Construction Project Procurement?
The lessons include the need for both flexibility and an appropriate fit between the framework, the reasons for the existence of the organization and the way in which the organization seeks to deliver its mission.
Lowest Bid Procurement
- Designers are forced to produce regulatory documents that direct the contractor on how to accomplish the construction
- The facility owner’s representative is forced to make decisions on acceptable performance, which results in the responsibility to manage contractors
- Contractors are forced to make a profit by providing the ‘cheapest’ possible construction
- Manufacturer constantly modify their systems to be more competitive
- Owners are unable to differentiate high-quality from low-quality contractors owing to the lack of performance information, and as a result perceive that the
It does not take into account the future impact of the cost decision and the history of cost and time increases experienced when a minimally qualified contractor attempts to handle a project that is beyond its technical, managerial and/or financial capacity. Therefore, any ambiguity will be used to lower the overall quality of the finished project that, once completed, is occupied by an unsatisfied customer, resulting in another black eye for the federal construction agency.
Best Value Procurement
Change Needed In Australian Industry
US Public Sector Best Value Procurement
This encourages the purchase of the best value goods and services and supports the evaluation of past procurement performance as a key quality measure in public procurement. However, industry concerns about the largely subjective nature of the best value process (Bail, 1993, cited in Scott, 1995) and the lack of a commonly understood definition (Koch, 1994, cited in Scott, 1994) have led to an increasing number of protests in this area (Lieberman, 1994). , cited in Scott, 1995).
UK BEST VALUE PUBLIC SECTOR PROCUREMENT
Best Value is a quality-focused approach to public contracts that is often misunderstood and applied inconsistently. The CICA Competition in Contracting Act of 1984 established the basis for the best value approach through its prescribed procedures for planning, soliciting, evaluating and awarding competitive public contracts (Scott, 1995).
Best Value in Construction Not Lowest Cost
The government has now turned its focus to ways to get the most for the money. Lowest price is easy, but time and time again it doesn't achieve the best value.
OUTLINE FRAMEWORK FOR BEST VALUE
Operational definition for best value
Linking Purposes of Government to ‘Best Value’
Efficiency Effectiveness
Achieving
Best Value”
Government Client by
Politician/Public Servant Interface
Acts
Proposed Approach
Essence of the Best Value Framework Research Proposal
Development of a comprehensive Best Value Framework 2. Pilot implementation with industrial partners
Evaluation and further development of Framework
CONSTRUCTION INDUSTRY SME PERFORMANCE MEASUREMENT AND IMPROVEMENT
Criteria of Project Success
Performance measurement systems have historically developed as a means of monitoring and maintaining organizational control, which is the process of ensuring that an organization follows strategies that lead to the achievement of overall goals (Nanni, Dixon & Vollmann, 1990, cited in Amaratunga, Baldry & Sarshar, 2001). Performance should be measured against the goals set in the business planning processes.
Quality Assurance and Certification
Kumaraswamy & Dissanayaka (2000) report that in the Hong Kong construction industry, that customer-driven drive for ISO 9000 certification has surpassed any spontaneity. The implementation of quality assurance may be only the first obstacle of quality management that an organization must address if it wants to adopt the learning disciplines.
Total Quality Management
Casual findings are reported from an ongoing research project aimed at determining the effectiveness of quality assurance systems certified under the ISO 9000 series in Australian contracting organisations. The need for ISO 9000 certification as a prerequisite to even being considered for construction work in the public sector appears to have diverted some organizations from a more comprehensive organisation-specific development of their quality management system.
Quality Awards and Business Excellence Frameworks
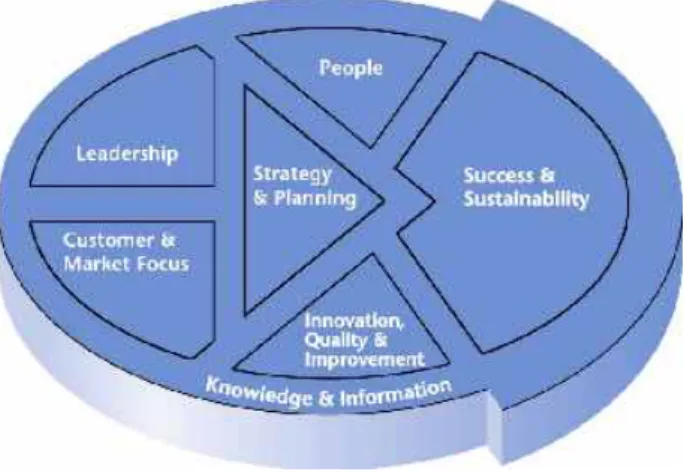
Holonic networks and change – projects are often very large, rarely in the same location and still predominantly labor intensive. Applying the principles through the framework's categories and items can guide organizational improvement and success.
Benchmarking
Barsky & Bremser (1999) suggest that these measurements can be easily tied to routine planning and budgeting in a balanced scorecard environment. If superior performance is achieved, the process starts again with a new team and performance gap.
International Business Profile Benchmarking
If the problem is not resolved, a new action plan is developed and the process continues.
The United Kingdom Benchmarking Index
The data can then be used to make comparisons with international companies that have a similar turnover, number of employees, operating in a common industrial sector. Human resources measures: direct/indirect, employee/manager, graduate/employee, number of management levels, total training days/employee, training expenditure/employee.
The Case Study
The report must then be interpreted in the context of the company and its markets, environment and activities. An appropriate and competent interpretation highlights the company's strengths and weaknesses and allows for the selection of improvement opportunities on a rational basis.
COST OF TENDERING
This is evident in the Giles Commission's (1992) observation on the construction industry that collusion in the construction industry is a reality. 34; Involvement in secret and anti-competitive conduct, including secret receipt and payment of special and unsuccessful bidders.
Previous and Current Research
Attitudes to Cost of Tendering
Experienced mid-level construction industry veterans have discussed their solution to tender costs related to collusion reported by the Giles Commission (1992). Without a clear understanding of the cost of tendering, a broad industry assumption has been that the cost of tendering is too high and that it should be reduced.
Barriers to Understanding Cost of Tendering
However, with such a vague understanding of the cost of tendering, there is an equally vague understanding of the concept of pre-qualification, and in some cases there is an expectation from purchasers that tenderers must pre-qualify themselves for every tender. This misunderstanding of the concept of prequalification undermines the benefits that could be gained from a well-managed prequalification program.
Implications Uncovered by this Scoping Project
34; Each company that submitted a tender added a certain amount which (in the event of winning the tender) was understood to be distributed among the other bidders (those who did not win the contract)." led to a solution to reduce the cost of tendering through the pre-qualification of tenderers.
The Tendering Process
Management The client engages the services of a construction process manager, but accepts some risk and reward for cost outcomes. Relationship This method of procurement attempts to align the goals of the Client and the Contractor (and other relevant parties) so that all decisions are made to benefit the project.
Project Delivery Methods
The Customer engages a number of contractors to carry out capital works and maintenance for specific functions within defined geographical zones and/or time periods. Financed With this method of tendering, the project is fully or partially financed by someone other than the client.
Tendering Process
Benchmarking as an Approach to Gain Understanding
Cost of Tendering Benchmark Categories - Purchasers
Cost of Tendering Benchmark Categories - Tenderers
CONCLUSION
Literature Review
The research is inconclusive on the cost of tendering, but it does point to some sketchy supplier data and anecdotal opinions. As academic literature, they are not necessarily rigorous, but they provide a source of discursive data and prompts for questions for practitioners.
The Components Of Tendering Costs
Because the survey was conducted by a market research firm, it relied on the diligence of those who answered the questions and assumed that they understood the questions and were qualified to provide meaningful answers. A study by the Commonwealth of Australia (1994) notes that while some improvements were recognised, various problems were identified in the tendering process – albeit limited to supply in the Commonwealth of Australia – indicating a lack of concern to address tendering cost issues.
Preparation of Tender Documents
Preparation of Response to Tender
Responses to offers may take the form of a document or include physical models or involved presentations. This can lead to wasted effort preparing tenders relating to work outside the competence of organizations that would be better off rejecting the tender notice.
Assessment and Selection
Barriers To Understanding Tendering Costs
Difficulty in Determining Resources Allocated to Tendering
Difficulty or Reluctance to Implement
Greed and Blatant Corruption
The Giles Commission (1992) into the construction industry raises the issues of secret tendering in the construction industry. Veterans of many years of tendering have explained their solution to the costs of tendering in terms of the collusion reported by the Giles Commission (1992).
Generic Tender Cost Model
It is likely that the client can at least partially mitigate the costs of the tendering process. This is unlikely to happen in an environment where the client is not aware of the costs of the tender and consequently is not aware of the additional costs incurred by the client as a result of its tendering procedures.
Estimation Of Tendering Costs
This model divided the costs of achieving a desired outcome standard into "prevention costs", evaluation costs and "error costs". The following section therefore attempts to quantify tender costs for various circumstances based on data obtained from various informants and sources.
Public Sector Organisations
In addition, the impact of the costs of tendering must be calculated for public authorities with significant responsibility for the procurement of construction projects. This model and analysis has ignored the cascading effect of the bidding process on the subcontracting sector, which constitutes the majority of companies in the construction sector.
SME Sector Subcontractors and Suppliers
Efforts to understand the cost of tenders are confounded by issues both visible and invisible to formal accounting of the construction process. There is also the possibility that a similar experience may emerge as reported in the case of the development of a strict quality cost model in the case of quality management.
Impact of Time and Reasons for Seeking Certification on Perception of Benefits Received', International Journal of Quality & Reliability Management, vol. 2002). A practical approach', Work study, vol. 2000) ‘Quality Assurance in Small Business Organizations: Myths and Realities’, International Journal of Quality & Reliability Management, vol.
Sample copy of Benchmark Index Report
ABC PTY LTD
International Business Profile Benchmarking Report
The graphs show your company's relative position for each factor against the group. It's important to understand that charts are built to show how well your company is doing relative to a group.
Stronger
Profit / Turnover before Tax (Profit Margin, %) - this is the profit before tax expressed as a percentage of turnover. Return on capital employed (ROCE, %) - this is profit before tax expressed as a percentage of capital employed, where capital employed.
Return on Capital Employed (ROCE, %) - this is the profit before tax expressed as a percentage of the capital employed, where capital employed
Return on Net Assets (RONA, %) - this is the profit before taxes expressed as a percentage of net assets (fixed, intangible and intermediate assets plus
Turnover / Orders (AUD) - this ratio provides an indication of the average order value expressed as pounds per order
Value Added (AUD) - this is the difference between the cost of raw materials and the sale price - that is the amount of value that the business has added to
Cash in bank / Turnover (%) - small businesses find that the lack of cash is their biggest problem. Credit payment days - this is the creditor value divided by revenue and represents the average payment period that the business takes to pay its bills.
Credit Payment Days - this is the creditor value divided by turnover and represents the average payment period that company takes to pay its bills. It
However, companies that hold too much cash are not investing their funds to the best advantage of their business.
Gross Gearing (%, *) - this figure demonstrates a company’s ability to finance liabilities from liquid assets
Net Gearing (%, *) - this ratio is a measure of the dependence of the company on loan finance
Pre Tax Profit / Interest (Interest Cover #) - this ratio indicates the
Stock Turnover (#) - this is the turnover divided by stocks, giving the number times stocks are turned over during a year, or how quickly stocks are moved
Turnover/Working Capital (#) – This ratio measures a company's ability to generate sales from available working capital. Pre-tax profit per employee (AUD) – this is pre-tax profit divided by the number of employees.
Capital investment / Depreciation (%) - this is a measure of the level of investment compared to the depreciation of current fixed assets.
Capital Investment / Depreciation (%) - this is a measure of the level of investment compared to the depreciation of the current fixed assets
Capital Investment / Pre Tax Profit (%) - this is an indication of a company’s ability to fund investment from profit
Capital Investment / Turnover (%) - this is an indication of how much the company continues to invest in itself
Marketing Expenditure / Turnover (%) - this is an indication of the companies investment in its marketing activity
R&D Expenditure / Turnover (%) - this is an indication of the companies investment in the future, of its capacity to be innovative
Training Expenditure / Turnover (%) - this is an indicator of the company’s investment in it’s employees
Capital investment / Turnover (% Growth) - this is an indication of a company's investment in itself on a percentage of turnover related to the.
Capital Investment / Turnover (% Growth) - this is an indication of a company’s investment in itself on a percentage of turnover related to the
Return on Capital Employed (% Growth) - this indicates the how much more or less profit the client company is making with the capital employed in
Complaints / Orders (%, *) - this is a method of assessing customers
Complaints / Customers (#, *) - this is a method of assessing the average number of complaints per customer independent of number of orders and
Order Value of Complaints / Turnover (%, *) - this figure expressed as a percentage measures the total dissatisfaction of customers independent of the
Orders Failed Prior to Delivery / Orders (%, *) - this measure shows how effective a company is at preventing failed products from reaching the
Revenue from new geographies/traffic (%) - this determines how successful the company is in developing new geographies.
Income From New Geographies / Turnover (%) - this identifies how successful a company is being at developing new geographical territories
Income From New Market Segments / Turnover (%) - this identifies the ability of a company to generate sales from new market segments
Income From New Products / Turnover (%) - this measures how successful a company is at developing and introducing new products
New Customers / Total Customers (%) - this figure, expressed as a percentage, identifies the growth in customer numbers regardless of new
Total New Income / Turnover (%) - this identifies the ability of a company to generate additional turnover from new customers
Purchased in Materials / Number of Suppliers (AUD) - this ratio measures the average value of the business for each supplier. Substandard supplies / purchased materials (%, *) - this figure highlights the quality of suppliers expressed as a percentage of the total.
Sub Standard Supplies / Bought In Materials (%, *) - this figure highlights the quality of suppliers expressed on a percentage of total
Supplies Delivered On Time / Bought In Materials (%) - this
Turnover / No of Suppliers (AUD) - this ratio demonstrates the
Direct/Indirect (#) – Measures the number of employees directly involved in output-related activities versus support.
Directs / Indirects (#) - this measures the number of employees directly involved in output-related activities compared with supporting
Number of Management Levels (#, *) - this assesses the relative flatness or hierarchical nature of the organisation
Total Training Days / Employees (#) - this measures a company’s level of investment in it’s staff expressed on an average number of days training per
Early Leavers / Employees (%, *) - this indicates the extent to which the organization has been successful in recruiting and selecting people who are.
Early leavers / Employees (%, *) - this indicates the extent to which the organisation has been successful in recruiting and selection people who are
Total Days Lost to Absenteeism / Employees (#, *) - this measures the amount of time that people spend away from work due to sickness,
Leadership - this section discusses the role that senior managers play in shaping the organization through its values, mission and vision, and behavior. Policy and Strategy – this section attempts to identify the existence of policy and strategy statements.
Policy and Strategy - this section seeks to identify the existence of policy and strategy statements. It looks at how planning activity takes into account
Emphasis is placed on the actual behavior and involvement of senior managers rather than relying on statements or policies.
People Management - this section looks at how the organisation views the development of its employees. It also examines the way that peoples
Resource Management - this section looks at the way that key business information is organised and communicated throughout the company. The
Processes - in this section the key processes of the organisation are identified. The means by which they are managed and controlled is also
Customer Satisfaction - this section covers the type of relationships the organisation builds with their customers. It asks about customer perceptions
People Satisfaction - this section covers the measurement methods and communication of employee satisfaction. How these are used for comparative
The Company: the client company whose data has been collected
Benchmark Set: the companies which have been chosen, using benchmarking criteria, as the basis for comparing the Company’s data
Measure: a ratio derived from the input questions which is used for benchmark comparisons. Some ratios are regarded as Inverted Ratios
Relative (Relative Performance): for a given measure, this is the company’s relative performance figure when its value is compared to the other
Your Actual: is the companies actual value for the given measure, expressed as either a percentage (%), a number (#) or in AUD depending on the
Group Actual Data: five data points (see below) for each measure which gives an indication of the “spread” of the current database
Sample: for each measure, this figure represents the how many companies worth of data is being used for the comparison
PROPOSALS
Idea Submission
Part of the focus of the CRC Construction Innovation is to bring about cultural change in the construction sector. This project is an opportunity for the CRC Construction Innovation to contribute to the 'professionalization' of SMEs.
PROPOSALS
Preliminary Research
Proposal
This will be done to match the results sought to the circumstances of the project. The success of the project will be measured by the participation of contractors and customers in the benchmarking process.


