This report presents the findings of the Council's Environmental Groundwater Quality Monitoring (SEM) programme. Tasman District Council (Council) monitors groundwater quality to meet its obligations under the Resource Management Act (RMA 1991) and the Tasman Resource Management Plan (TRMP).
Groundwater Quality
The groundwater quality monitoring program forms part of the Council's wider State of the Environmental Monitoring Program (SEM). To better understand the nature of groundwater quality issues and the factors that can cause changes in groundwater quality in order to facilitate better management of the District's land and water resources.
Alluvial Aquifers
Unconfined Alluvial Aquifers
It is not the intent of this report to provide a detailed physical description of the District's aquifer systems.
Confined Alluvial Aquifers
Sedimentary Rock Aquifers
Karst Aquifers
Tasman District Council's State of the Environment Monitoring (SEM) program comprises quarterly monitoring of 16 sites in the district. Graphs of measured concentrations over time for selected parameters are in Annex III.
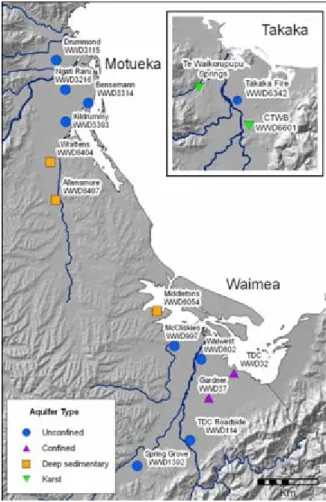
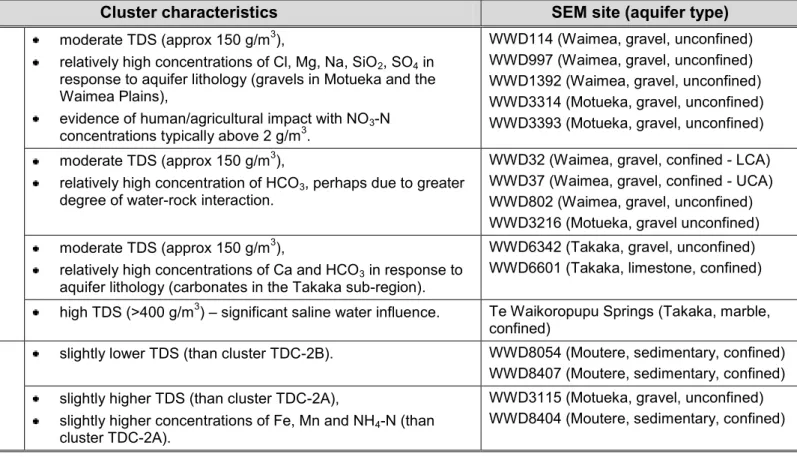
Regional Analysis and Hierarchical Cluster Analysis – SEM Sites
A tabular summary of median, MAD and trends for key geochemical parameters is presented in Appendix II.
Median Concentrations – SEM Sites
- Median Nitrate Concentrations – SEM Sites
- Comparison of Tasman District’s Median Concentrations to other
- Comparison of Tasman’s Median Concentrations with New Zealand’s
- Variability of Median Values – SEM Sites
Overall, the median concentrations of the tested parameters at the 16 SEM sites are below (i.e., in line with) the respective MAVs and GVs for drinking water. Of the 16 SEM sites, both WWD 802 (Waiwest) and WWD 3314 (Bensemann) stand out for several parameters whose median concentrations show relatively high variability (especially calcium, magnesium, potassium, sodium, chloride, sulfate, bicarbonate, and electrical conductivity).
Trends in Monitored Parameters – SEM Sites
State of Groundwater Quality in Tasman District Page 13 October 2010 G:\Environment\Glenn\Groundwater Quality SEM\2010 Groundwater Quality SEM final.docx Most parameters at a majority of, but not all, sites are relatively stable and do not show statistically significant trends. At the time of writing, no groundwater quality data is available from the new well. While the 16 quarterly monitored SEM sites are the cornerstone of the Board's long-term groundwater quality monitoring program, the Board collects numerous other groundwater quality data in the exercise of its various functions.
There is also a significant amount of one-off sampling data, usually collected after the drilling of a new well by the owner of the well, with groundwater quality results forwarded to the municipality. While most of this data relates to groundwater that is likely to be locally degraded, it often includes control sites with slopes reflecting background groundwater quality in the surrounding area. All groundwater quality data collected by the municipality or provided to the municipality is stored in the municipality's environmental database.
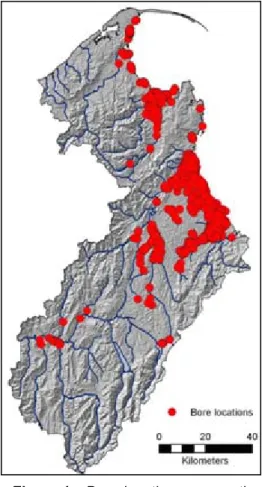
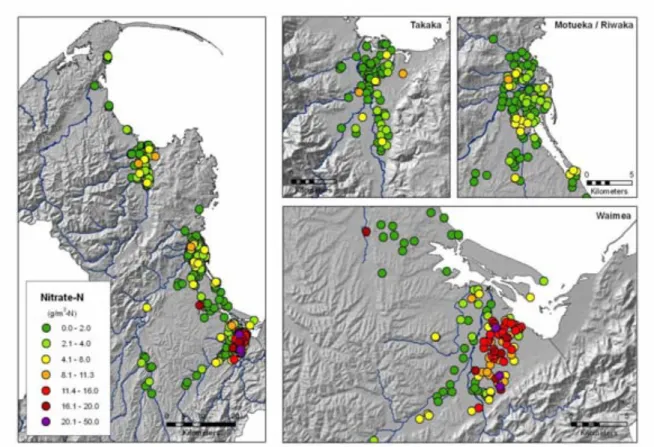
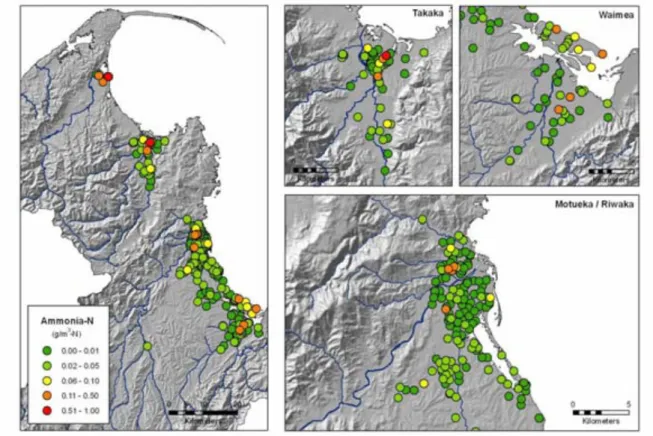
Although these data are not collected regularly and therefore trends over time cannot be discerned, they provide useful insight into changes in groundwater quality over a much larger area of the county. State of Groundwater Quality in the Tasman District Page 15 October 2010 G:\Environmental\Glenn\Groundwater Quality SEM\2010 Groundwater Quality SEM final.docx Although a large amount of groundwater quality data has been collected, only nitrates, ammonia, sulfate, iron, manganese and Eschericia coli are presented as they are considered key indicators of groundwater quality (Daughney and Randall 2009 and M fE 2007).
Nitrates across the Entire Region
Nitrates in the Waimea Plains
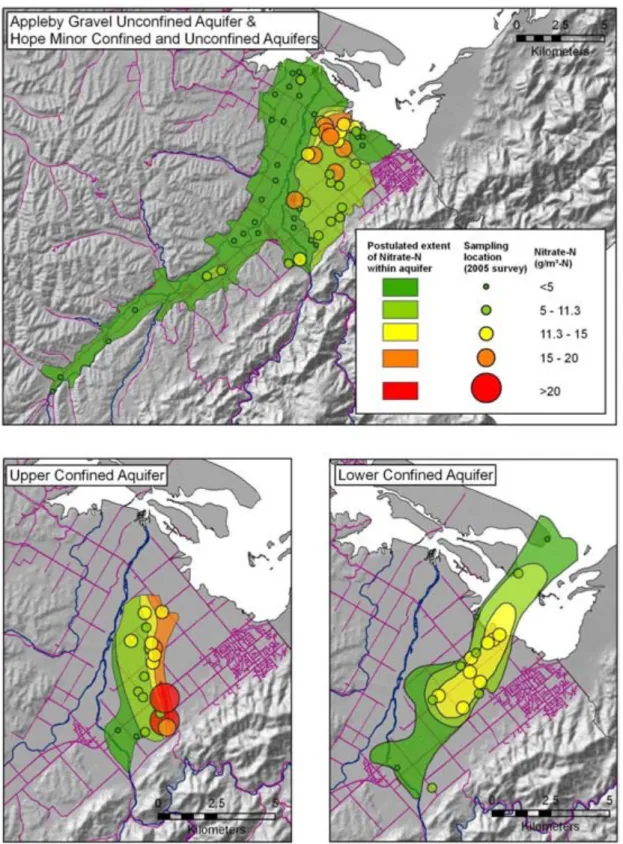
State of Tasman District Groundwater Quality Page 17 October 2010 G:\Environmental\Glenn\Groundwater Quality SEM\2010 Groundwater Quality SEM final.docx At the northern end of the UCA near State Highway 60 and Swamp/Bartlett Roads, the upper confining layer thins and the aquifer is unconfined, essentially lying directly below and in contact with the Appleby Gravel Unconfined Aquifer (AGUA). The AGUA in this area has elevated nitrate concentrations similar to those observed in the lower UCA. In the LCA, nitrate concentrations are elevated (11 to 15 g/m3-N, measured during the 2005 survey) from the Ranzau Road area to the Waimea Estuary.
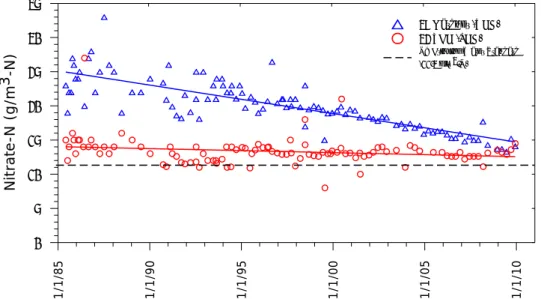
The Ranzau Road area is also where the UCA passes over the top of the LCA. Further down the gradient in the LCA, which extends north at least as far as Rabbit Island, measured nitrate concentrations decrease. The regularly monitored SEM site in the UCA (WWD 37 Gardner) shows a strong decreasing trend in nitrate concentrations.
In LCA (WWD 32 TDC) the trend is a much more gradual decline over time (Figure 4 and Appendices II and III). State of Groundwater Quality in the Tasman District Page 19 October 2010 G:\Environmental\Glenn\Groundwater Quality SEM\2010 Groundwater Quality SEM final.docx.
Ammonia
Sulphates
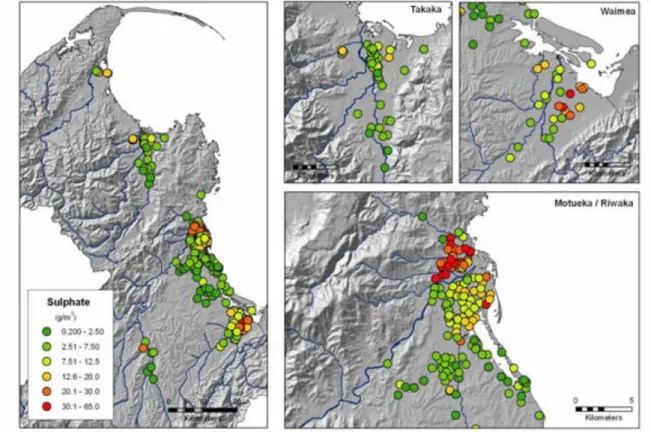
It is worth noting the observed sulfate concentrations across the Motueka/Riwaka Plain, with relatively high concentrations present north of the Motueka River and moderate concentrations south of the Motueka River. South of the Motueka River, sulfate concentrations show an increasing trend with distance from the river to the southeast. North of the Motueka River, groundwater flow rates are less than those to the south (ie there is much less river water flushing).
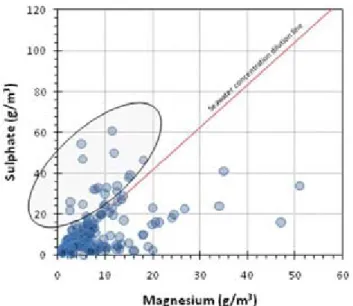
Land use in both the north and south of the Motueka plains is similar, namely intensive horticulture. The state of groundwater quality in the Tasman District Page 21 October 2010 G:\Environmental\Glenn\Groundwater Quality SEM\2010 Groundwater Quality SEM final.docx is most likely to be affected by the natural processes mentioned above (mainly dilution by recharge of the re-phase river water source). Most of the wells in the district fall below and to the right of the SCDL, indicating that their sulfate concentrations are at or below what would be expected if all sulfate was derived from seawater.
However, some clearly plot above and to the left of the SCDL indicating enrichment in sulfate. Most of these boreholes are located on the Motueka Riwaka Plains north of the Motueka River where, as previously mentioned, significant natural sulphate input is likely.
Iron and manganese
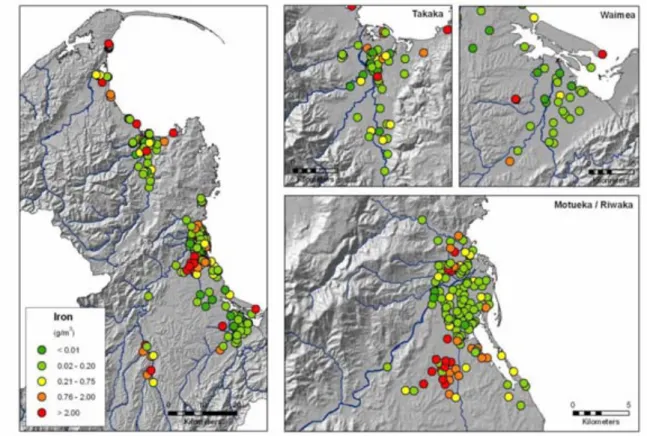
Therefore, as groundwater ages and interacts with its environment, changes in sulfate concentration will lead to a movement away from the SCDL. Wells with significant additional sulfate inputs will be plotted above (and to the left) of the SDCL. The health standard for manganese is 0.4 g/m3 and 15% of the sites did not meet this standard (10% nationally).
State of Groundwater Quality in the Tasman District Page 23 October 2010 G:\Environmental\Glenn\Groundwater Quality SEM\2010 Groundwater Quality SEM Final.docx Figure 10 Manganese concentrations across the Tasman District (average of all data collected).
Bacteriological Contaminants
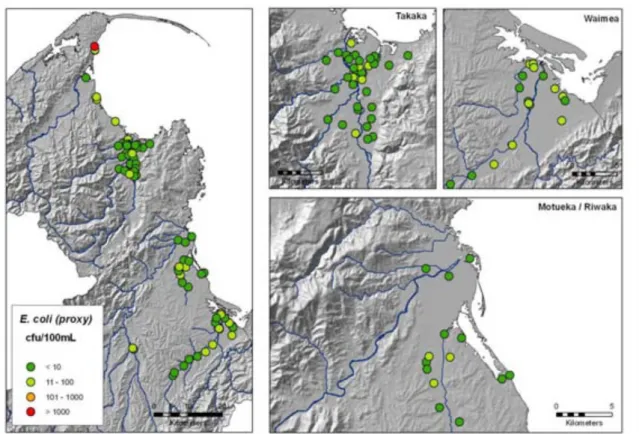
State of groundwater quality in the Tasman District Page 25 October 2010 G:\Environmental\Glenn\Groundwater Quality SEM\2010 Groundwater Quality SEM final.docx. The five sites where pesticide residues were found in the 2006 survey also showed low levels of pesticide residues when tested during both previous surveys (1998 and 2002). There are three sites where no pesticides were found in all three surveys and a further two sites where pesticide residues were found only in the original 1998 survey.
State of Groundwater Quality in the Tasman District Page 27 October 2010 G:\Environmental\Glenn\Groundwater Quality SEM\2010 Groundwater Quality SEM Final.docx Figure 12 Location of sample sites and monitoring results for pesticide residues (all concentrations .3 mg/m). Sites where no pesticide residues were detected during the last sampling round (2006), but some pesticide residues were detected during previous sampling rounds. State of Groundwater Quality in the Tasman District Page 29 October 2010 G:\Environmental\Glenn\Groundwater Quality SEM\2010 Groundwater Quality SEM final.docx.
In general, the quality of groundwater is high and, as expected, reflects the natural changes in the relevant geological composition and aquifer environments. This makes it problematic to identify specific impacts on groundwater quality resulting from specific land use practices.
Unconfined Alluvial Aquifers
Especially the Waimea Plains east of the Waimea River, where elevated nitrate concentrations occur in many places. In general, the more intense the land use, whether agricultural, horticultural or residential, the greater the likelihood that non-natural human influences on groundwater quality are evident. A great variety of land use across the District and within such a relatively small area gives the productive plains a patchwork.
Furthermore, land use changes over time (e.g. fruit trees give way to gardening, viticulture or housing). As a consequence, groundwater quality at a monitoring site may be affected by multiple land uses, both current and historical. Any discharges to land, including waste water from humans and animals, must be treated and handled correctly.
Once contaminated, groundwater can be very difficult, if possible, to remediate, and contamination can persist for long periods of time.
Confined Alluvial Aquifers
Sedimentary Rock Aquifers
State of Groundwater Quality in the Tasman District Page 31 October 2010 G:\Environmental\Glenn\Groundwater Quality SEM\2010 Groundwater Quality SEM final.docx.
Karst Aquifers
Review of state data from Tasman District Council's Environmental Groundwater Monitoring Programme. Groundwater Quality in New Zealand State and Trend Report prepared by the Institute of Geological and Nuclear Sciences Ltd. Groundwater Quality Status in Tasman District Page 33 Oct 2010 G:\Environmental\Glenn\Groundwater Quality SEM\2010 Groundwater Quality SEM final.docx.
Summary of medians, median absolute deviation (MAD – a measure of variability) and trend for the 16 SEM sites. State of Groundwater Quality in Tasman District Page 35 October 2010 G:\Environment\Glenn\Groundwater Quality SEM\2010 Groundwater Quality SEM final.docx. Appendix II(a): Summary of medians, median absolute deviation (MAD – a measure of variability) and trend for the 16 SEM sites.
Appendix II(b): Summary of Means, Mean Absolute Deviation (MAD – a measure of variability) and Trend for 16 SEM sites (continued). State of Groundwater Quality in the Tasman District Page 37 October 2010 G:\Environmental\Glenn\Groundwater Quality SEM\2010 Groundwater Quality SEM final.docx. Med MAD Trend Med Trend MAD Trend Med MAD Trend Med MAD Trend Med Trend MAD.
Appendix II(d): Summary of medians, median absolute deviation (MAD - measure of variability), and trend for 16 SEM sites (continued). uS/cm) During MAD Trend During MAD Trend During MAD Trend During MAD Trend During MAD Trend.
