CHARACTERIZATION, PROXIMATE COMPOSITION AND MINERAL PROFILE ANALYSIS OF DIFFERENT SUNFLOWER
(Helianthus annuus L.) GENOTYPES
MUNSHI MOHAMMAD SUMON
DEPARTMENT OF BIOCHEMISTRY
SHER-E-BANGLA AGRICULURAL UNIVERSITY DHAKA-1207
JUNE, 2020
CHARACTERIZATION, PROXIMATE COMPOSITION AND MINERAL PROFILE ANALYSIS OF DIFFERENT SUNFLOWER
(Helianthus annuus L.) GENOTYPES
BY
MUNSHI MOHAMMAD SUMON REG. NO. 13-05332
A Thesis
Submitted to The Department of Biochemistry, Faculty of Agriculture
Sher-e-Bangla Agricultural University, Dhaka In partial fulfillment of the requirements for the degree of
MASTERS OF SCIENCE (MS) IN
BIOCHEMISTRY
SEMESTER: JANUARY-JUNE 2020 APPROVED BY:
……...……….………. ...………
Prof. Md. Nuruddin Miah Prof. Dr. Kamal Uddin Ahmed Department of Biochemistry Department of Biochemistry
SAU, Dhaka SAU, Dhaka
Supervisor Co-supervisor
………
Prof. Dr. Ashrafi Hossain Chairman
Department of Biochemistry
Sher-E-Bangla Agricultural University Sher-E-Bangla Nagar
Dhaka-1207
Ref: - ... Date:………
CERTIFICATE
This is to certify that the thesis entitled “CHARACTERIZATION, PROXIMATE COMPOSITION AND MINERAL PROFILE ANALYSIS OF DIFFERENT SUNFLOWER (Helianthus annuus L.) GENOTYPES” submitted to the Department of Biochemistry, Sher-e-Bangla Agricultural University, Dhaka, in partial fulfillment of the requirements for the degree of MASTER OF SCIENCE in BIOCHEMISTRY, embodies the result of a piece of bona fide research work carried out by MUNSHI MOHAMMAD SUMON, Registration No. 13-05332 under my supervision and guidance. No part of the thesis has been submitted for any other degree or diploma.
I further certify that any help or source of information, received during the course of this investigation has been duly acknowledged.
Dated: June, 2020 Dhaka, Bangladesh
Prof. Md. Nuruddin Miah Department of Biochemistry Sher-e-Bangla Agricultural University
Sher-e-Bangla Nagar, Dhaka- 1207 Supervisor
DEDICATED TO- My Beloved Parents and
Respected Research Supervisor
ACKNOWLEDGEMENTS
All praises and compliments are due to the Supreme Regulator and Ruler of the Universe, “Almighty Allah” for the blessing upon the successful accomplishment of education, to complete the research work and thesis leading to Master of Science (MS) in Biochemistry. The author likes to express his heartfelt respect, deep sense of gratitude and profound indebtedness to his reverend Supervisor, Prof. MD. Nuruddin Miah, Department of Biochemistry, Sher-e-Bangla Agricultural University, Dhaka for his scholastic guidance, valuable advice, important suggestions and supervision throughout this research work and in preparing this thesis. The author also extends his sincere appreciation, profound regards and cordial thanks to his Co-supervisor, Prof. Dr. Kamal Uddin Ahmed, Department of Biochemistry, Sher-e-Bangla Agricultural University, Dhaka for his kind help, constructive advice, fruitful criticism and encouragement during the compilation of this thesis. The author feels to express his heartfelt thanks to the honorable chairman of Biochemistry Prof. Dr. Ashrafi Hossain for her valuable suggestions, instructions, cordial help and encouragement during the period of the study. The author would like to gratefully acknowledge all other teachers and staff members of the department of Biochemistry, Sher-e- Bangla Agricultural University, Dhaka. The author also grateful to Ministry of Science and Technology, The Peoples Republic of Bangladesh for providing him a National Science and Technology (NST) fellowship to conduct his research properly and Soil Resource Development Institute (SRDI) for their kind cooperation regarding the provide Laboratory facilities for mineral composition of oil cake
June, 2020 The Author
CHARACTERIZATION, PROXIMATE COMPOSITION AND MINERAL PROFILE ANALYSIS OF DIFFERENT SUNFLOWER
(Helianthus annuus L.) GENOTYPES
ABSTRACT
A comparative study was done to find out physical-chemical properties of hybrid, high yielding (HY) and indigenous varieties of sunflower seeds collected from three local markets. In this study seed weight, moisture%, ash%, protein%, and fat% of whole seed, chemical constant, and fatty acid profile of oil, and minerals composition of oilcake were investigated.
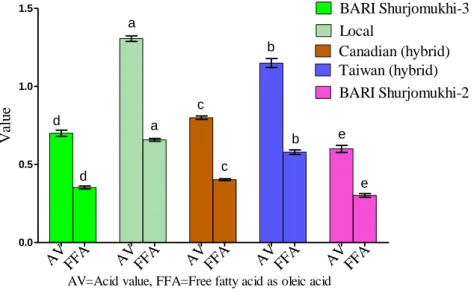
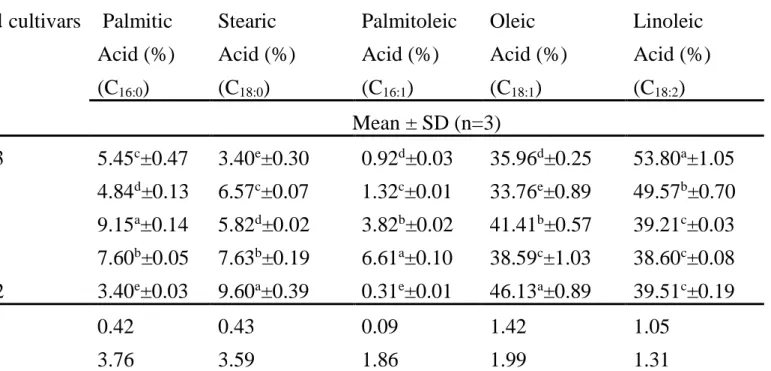
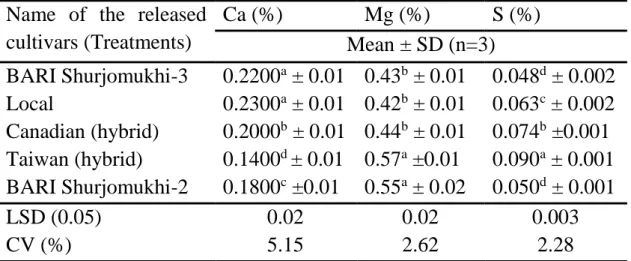
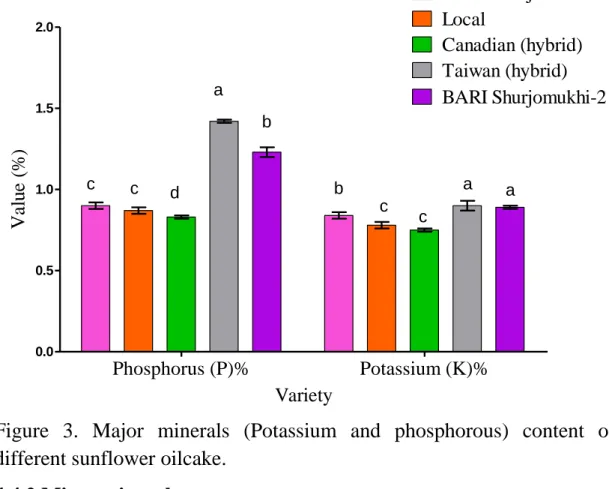
Among the varieties, BARI Shurjomukhi-2 (HY) showed the highest thousand grain weight (69.79 ± 2.06 g), moisture content (6.29 ± 0.09%), oil content (36.46 ± 0.40%), and crude protein (25.03 ± 0.89%). In case of chemical constant, for sunflower oil, BARI Shurjomukhi-2 contained the highest saponification value (237.01± 2.17), iodine value (131.64 ± 0.46), and lower acid value (0.60± 0.04) than in other oil. For fatty acid composition, BARI Shurjomukhi-2 contained the highest stearic acid (9.60 ± 0.39%) and oleic acid (46.13 ± 0.89%) while Canadian (hybrid) showed the highest content of palmitic acid (9.15 ± 0.14%) and BARI Shurjomukhi-3 linoleic acid (53.80 ± 1.05%). Maximum ash content was recorded in Taiwan (hybrid) (3.20 ± 0.03%). In terms of mineral composition, the highest amount of magnesium (0.57 ± 0.01%), sulfur (0.090 ± 0.001%), potassium (0.90 ± 0.03%), phosphorous (1.42 ± 0.01%), cupper (47.75 ± 0.05ppm), zinc (73.36 ± 0.03ppm), and iron (119.75 ± 0.05ppm) observed in the oilcake of hybrid (Taiwan) variety.
The highest content of calcium (0.2300 ± 0.01%) and manganese (45.50
± 0.6ppm) was found highest in Local variety. Therefore, Hybrid (Taiwan) showed best result for mineral composition but in terms of total physico-chemical aspect, HY (BARI-Shurjomukhi-2) performed better over hybrid (Taiwan) and Local varieties.
LIST OF CONTENTS
LIST PAGES
ACKNOWLEDGEMENTS ... I ABSTRACT ... II LIST OF CONTENTS ... III-IV LIST OF TABLES ... V LIST OF FIGURES ...VI LIST OF PLATES ...VI LIST OF ABBREVIATIONS AND ACRONYMS ... VII CHAPTER I ... 1-3
INTRODUCTION ... 1
CHAPTER II ... 4-16 REVIEW OF LITERATURE ... 4
CHAPTER III ... 17-34 MATERIALS AND METHODS ... 17
3.1 Sample collection and preparation ... 17
3.2 Brief description of varieties ... 17
3.3 Physicochemical Properties ... 19
3.4 Determination of thousand grain weight ... 19
3.5 Determination of moisture ... 20
3.6 Determination of ash ... 20
3.7 Chemical Analyses ... 22
3.7.1 Oil extraction and cake preparation ... 22
3.7.2 Estimation of total protein content by Microkjeldhal method .. 23
3.7.3 Chemical constant ... 25
3.7.4 Estimation of fatty acid composition ... 29
3.8 Estimation of minerals ... 301
3.8.1 Preparation of reagents ... 301
3.8.2 Preparation of standards ... 312
3.8.3 Digestion solution ... 32
3.9 Statistical Analysis ... 33
LIST PAGES CHAPTER IV ... 34-50
RESULTS AND DISCUSSION ... 34
4.1 Physical characteristics of sunflower released cultivars ... 34
4.1.1 Thousand grain weight ... 34
4.1.2 Moisture ... 35
4.1.3 Dry matter ... 35
4.1.4 Oil content ... 36
4.1.5 Oil Cake... 37
4.1.6 The dry weight of the cake ... 37
4.1.7 Protein ... 38
4.1.8 Ash ... 39
4.2 Chemical characteristics of sunflower oil ... 40
4.2.1 Saponification value and Saponification equivalent ... 40
4.2.2 Iodine value ... 41
4.2.3 Acid value and percentage of free fatty acid (as oleic) ... 42
4.3 Fatty acid composition ... 43
4.4 Minerals ... 45
4.4.1 Major minerals ... 45
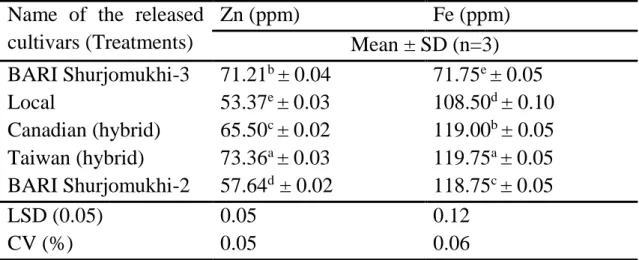
4.4.2 Micro minerals ... 48
CHAPTER V ... 51-56 SUMMARY AND CONCLUSION ... 51 REFERENCES ... 55-61
LIST OF TABLES
TABLE TITLE PAGES
1 Weight of thousand seed, moisture and dry matter of different released cultivars of sunflower.
36
2 Oil content of sunflower seeds, oilcake content and dry weight of oilcake of different sunflower genotypes.
38
3 Protein and ash content in different sunflower genotypes.
39
4 Fatty acid composition of sunflower genotypes. 44 5 Major minerals (calcium, magnesium and sulfur)
content in sunflower oilcake.
46
6 Manganese and cupper content in sunflower oilcake. 49
7 Zinc and iron content in sunflower oilcake. 50
LIST OF FIGURES
LIST OF PLATES
FIGURE TITLE PAGES
1 The chemical constants of sunflower oils. 41
2 Acid value and free fatty acids content of sunflower oils.
42 3 Major minerals (Potassium and phosphorous)
content of different of sunflower oilcake.
48
PLATE TITLE PAGES
1 Photograph of sunflower seeds. 18
LIST OF ABBREVIATIONS AND ACRONYMS
Full Word Abbreviation
And others et al.
Coefficient of variation CV
Poly Unsaturated Fatty Acid PUFA
Days after flowering DAF
World Health Organization WHO
Non-Protein Nitrogen NPN
Hours h
Cultivars cv.
Fatty acid FA
Liter L
Titer Value TV
Saponification Value SV
Iodine value IV
Acid value AV
Normality N
Analysis of variance ANOVA
United States Department of Agriculture USDA Association of Official Analytical Chemist AOAC Bangladesh Agriculture Research Institute BARI
Degree Celsius (Centigrade) °C
Least significant difference LSD
Gram g
Miligram mg
Milliliter ml
Parts per Million ppm
Food and Agriculture Organization FAO
Microgram µg
Microliter µl
CHAPTER I
INTRODUCTION
Oil crops supply many nutrients and minerals in both human and animal nourishment (Kollathova et al., 2019; Das et al., 2017). The sunflower is one of the major cultivated oilseeds crops with global production of about 21.2 million metric tons in 2019/20 (STAT, 2020). In Bangladesh, annual sunflower production is about 1.8 thousand metric tons (BBS, 2019).
The cultivated sunflower (Helianthus annuus L.) is belongs to the family of Asteraceae (Compositae). Helianthus come from the Greek word Helios, meaning sun, and anthos, meaning flower, and from Latin annuus, meaning annual. The property of this flower ‘turning with the sun’ is clearly expressed by the French and Spanish languages when naming this plant. The flower is appreciated through the world (Sanchez- Muniz et al., 2016).
Sunflower have high demand as it contains low cholesterol that’s why it is good for health (Khatun et al., 2016). High-calorie nutrients in sunflower oil have become a vital constituent of the human diet. The presence of polyunsaturated fatty acids ω-6 and ω-9 in sunflower oil protects us from atherosclerosis and improves the activity of the liver, the kidney, and the gall bladder and also have the ability to control blood cholesterol level and prevent heart disease (Ahmadian et al., 2019;
Gunstone, 2011). In contrast to other edible oils, sunflower oil has high levels of Linoleic acid that is resistant to oxidation during storage (Martinez-Force et al., 2015). Unsaturated fatty acids such as oleic and linoleic may reduce the risk of cardiovascular diseases (Farvid et al., 2014). Oleic acid aslo has oxidative stability during the extraction and
refining processes and storage and for use in fried foods (Carvalho et al., 2019; Perdomo et al., 2015). In particular, a diet rich in monounsaturated fatty acids decreases the cholesterol level connected with low-density lipoproteins (“harmful cholesterol”) and has zero effect on the level of the triglycerides or on the cholesterol connected with high density lipoprotein, if compared to a diet rich in saturated fatty acids (Grundy, 1986). Recent studies have clearified the antioxidant properties of oleic acid (Berry, 1997). When oleic acid content increase in the tissues, in conditions of high oxygen stress (oxygen toxicity) that helps to form better cellular protection than a similar increase in polyunsaturated fatty acids (Kinter et al., 1996). Some scientist have demonstrated that there is an inverse relationship between the consumption of monounsaturated fatty acids and occurrence of colon cancer (Baldini et al., 2002; Chyou et al., 1996).
Not only the oil but also the whole seed can be used as medicinal ointments, bread, pigments and a snack food, as an element in baked foodstuffs, salads, and candies and for feeding birds and small animal pets. Press cake and oil meal are protein-rich animal feed and a rich reservoir of essential amino acids such as lysine, methionine, cystine, tryptophan, as well as of calcium, phosphorus, and B group vitamins (Sanchez-Muniz et al., 2016). Sunflower oil meal is a good source of vitamin E (Demirel et al., 2004). Average of 39.6% of protein, 1.6% of fat, 12.3% of crude fiber, 23.5% of nitrogen-free extractives, and 6.0% of ash can be easily obtained from sunflower press cake (Sanchez-Muniz et al., 2016). Sunflower oilcakes are also good source of minerals but many factor such as species, soil, climatic conditions, agro-technics and breeding influence the mineral content in oilcakes (Galik et al., 2016).
Although many researchers studied the composition of sunflower oil,
comparative analysis of the chemical composition of seed and mineral profile of cake among different genotypes in Bangladesh. But we found very few studies related to the comparison of proximate composition and mineral profiling of available High yielding varieties, Hybrid and Local sunflower varieties found in different markets in Bangladesh. The purpose of our qualitative comparison study was to obtain protein rich feed from by-products and quality oil from sunflower seed.
Objectives
1. To compare the physico-chemical parameters of different of sunflower varieties.
2. To determine fatty acid composition of different genotype of sunflower oil.
3. To determine the mineral composition of different varieties of sunflower oilcake.
CHAPTER II
REVIEW OF LITERATURE
Vegetable oils and fats constitute an important component of human diet, ranking third after cereals and animal products. Sunflower is important oil crop in human and animal nutrition because of its high level of fats/oil, fatty acid, protein and other nutritionally valuable substances.
Physical properties, chemical analysis, and estimation of minerals of different types of sunflower observed by other researcher are described in this section.
Grain Weight
Thousand seed weight is a very prominent character of sunflower, where highest consideration is one of the seed yields. A good number of literature are available on the variability of this trait.
Baydar and Erbas (2005) conducted an experiment to evaluate dry weight of sunflower seeds obtained from different maturity stages and positions on the head. The heads were harvested sequentially 10, 15, 20, 25, 30, 35, 40, and 45 days after flowering (DAF) in 2002 and 2003. Dry weight per seed at 2002 was observed 36.10-56.40 mg where at 2003 was 22.80- 49.60 mg. In 2002, seed weight increased remarkably at 25 DAF and maximized at 30 DAF, at 56.40 mg. In 2003, seed weight increased gradually up to the last harvest date at 52.00 mg, respectively.
Seiler (1983) examined the effects of flowering date on seed weight for 38 wild H. annuus populations grown at a single location. Average dry weight per seed (mg) remained relatively constant from the first flowering date through the eighth date and ranges from (4.30-8.70 mg).
Thereafter, there was a decline to a low at the last flowering date. Seed weight for cultivated sunflower followed a similar pattern and ranges
from (27.20-47 mg).The continued decrease in weight per seed may be due to the strong influence that number of seeds per head has on seed weight. Wild H. annuus is multiple-headed and flowers over several weeks with larger heads with more seeds being produced early, and smaller heads with less seeds being produced later.
Earle et al. (1968) showed the comparative data on the composition of achene from six sunflower varieties. They found that 1000 seeds weight of Armavirec, Peredovik, Vniimk 8931, Smena, Krasnodarets, Arrowhead and Mingren were 59 g, 86 g, 62 g, 65 g, 86 g, 91 g, and 77 g, respectively.
Moisture
In storage condition, the suitable moisture level of different oil seeds are 10-12%. Moisture content is an important factor than other nutrients. It is also important for insect infestation and disease.
Nadeem et al. (2010) was conducted a research word to characterize the sunflower hybrids and assess their suitability for the preparation of bread.
They summarized that moisture content in sunflower oilseeds varied from 3.06 to 6.32%.
Anjum et al. (2006) was observed the microwave roasting effects on the physicochemical composition of sunflower seed oil. The moisture contents of the unroasted sunflower oilseeds of variety KL-39 and FH- 330 were 7.00 and 6.30%, respectively.
Earle et al. (1968) investigated that moisture content of different variety of sunflower was ranged from 5.00% to 8.20%. They found the highest moisture content (8.20%) was observed from Mingren; while the lowest moisture content (5.00%) was found in Krasnodarets.
Ash
Ash define as the residue that remains after the complete combustion of the organic compound of a food product. The estimation of ash content in oil seeds enables the classification of oil.
Kollathova et al. (2019) worked to investigate mineral profile of oilseeds and their by-products as feeding sources for animal nutrition. They found that ash content in different oilseeds such as sunflower, soybean, flaxseed and rapeseed were 3.6%, 5.3%, 3.9%, and 3.6%, respectively.
Nadeem et al. (2010) was conducted a research word to characterize the sunflower hybrids and assess their suitability for the preparation of bread.
They summarized that ash content in different sunflower hybrid ranged from 2.68-3.13%.
Anjum et al. (2006) was observed the microwave roasting effects on the physicochemical composition of sunflower seed oil. Content of ash of the unroasted sunflower oilseeds of variety KL-39 and FH-330 were 5.00%
and 5.50%, respectively.
Earle et al. (1968) observed that ash content of different variety of sunflower was ranged from 1.80% to 3.70%. They reported the ash content of different variety were 3.30%, 3.20%, 3.60%, 3.70%, 2.80%, 2.40%, and 1.80% for Armavirec, Peredovik, Vniimk 8931, Smena, Krasnodarets, Arrowhead, and Mingren, respectively.
Oil
Fats and oil are important to maintain body temperature. It provides 9 kcal energy from each gram of oil.
Akkaya et al. (2018) determine the oil ratios of sunflowers cultivated in the warm climate of the Cukurova region at different sowing dates. The mean crude oil ratios ranged from 38.82% to 44.42%, the highest crude
oil ratio (44.42%) was found in the standard type sunflower variety, Tunca. When we evaluated the crude oil ratios according to sunflower types, the highest crude oil ratio was found in standard type sunflowers with 42.57%. When we evaluated the data according to sowing time, the highest crude oil ratio was determined to be 47.90% in SD1, for the standard type sunflower variety, Tunca.
Mandal et al. (2006) evaluated a total of 167 samples of sunflower (Helianthus annuus L.) genotypes, introduced from France were grown during the winter season (rabi) 2002-03 and (rabi) 2003-04 at the farm of NBPGR, New Delhi, and evaluated for seed oil content. Promising lines, with more than 40% oil content in seed were identified.
Baydar and Erbas (2005) conducted an experiment to evaluate variations in the contents of oil of sunflower seeds obtained from different maturity phases and positions on the head. The heads were harvested successively 10, 15, 20, 25, 30, 35, 40, and 45 days after flowering (DAF) in 2002 and 2003. In changes in oil contents in 2002, a sudden rise was commenced at 15 DAF and persistent until 35 DAF. Significant increases in oil content from 30.50% to 45.80% were detected in these phases of seed development. The oil content did not increase significantly from 30 to 35 DAF, after which it started to decline gradually from 45.80% to 42.60%.
The accumulation pattern of the oil was similar in 2003, and the highest oil content was determined at 30 DAF with a value of 47.90%. Although the oil contents were higher from 10 to 30 DAF in 2003, 2002 was a better year than 2003 in terms of the oil content of the final seeds.
Seiler (1983) described that environmental factors, especially temperature, during the period of seed development and maturation, have been shown to affect both content and composition of oil in maturing cultivated sunflower seed. The effects of temperature on oil content,
however, have been variable. The average seed oil content for all populations was 25.7% and ranged from 17.20 to 34.20%. Oil content remained relatively stable from the 6 July flowering date through the 21 September date. Thereafter, there were slight increases in seed oil content to a maximum of 27.6% for the 5 October sampling. The oil content of wild H. annuus populations remained more stable and did not vary by flowering date as much as the oil content did in the commercial hybrid.
Canvin (1965) reported that sunflower grown at a constant 21⁰ C had a higher oil content than those grown at either a lower or higher temperature. Harris et al. (1978) showed that oil content decreased as temperature increased.
Thompson et al. (1979) reported that cultivated sunflower seeds were significantly related seed oil for wild H. annuus ranges from 19.00% to 35.90% with total solar radiation and day length with a mean of 25.40%.
They found that oil content decreased as temperatures decreased. They postulated that these differences in responses may have been due to temperature effects at specific developmental stages or to factors other than temperature. Other factors indirectly related to temperature, such as total solar energy or day length, may influence the oil content and its quality.
Earle et al. (1968) found that oil content of different variety of sunflower was ranged from 21.00% to 51.40%. They found the highest oil content (51.40%) was observed from Peredovik; while the lowest oil content (21.00%) was found in Mingren.
Canvin et al. (1965) showed that the effect of temperature on the oil content of the oils from several oil seed crops. Plants of rape, safflower, sunflower, flax, and castor bean were cultivated at temperatures of 10, 16, 21, and 26.50⁰C for the period of seed development. When mature, the
seed was harvested from individual plants and analyzed for oil content.
The oil content of sunflower was 36.80 ± 0.70%, 37.30 ± 1.50%, 40.40 ± 1.00%, 36.40 ± 1.30% that wasn't stricken by temperature.
Chemical properties of Oil
The chemical characteristics of oil determine the quality and stability of oil.
Rehab (2012) found that the effects of deep frying on physicochemical parameters such as acid value, iodine value were evaluated over 30 hours of the frying process. The pure oils were heated at 180 °C, then frozen French fried potatoes were fried every 30 minutes. Oil samples were taken every 5 hours and the entire continuous frying period was 30 hours.
The initial acid values of the fresh oils under investigation were found according to frying period 0, 5, 10, 15, 20, 25, and 30 hour that was 0.13
± 0.04, 0.25 ± 0.03, 0.3 0 ± 0.03, 0.35 ± 0.05, 0.42 ± 0.07, 0.53 ± 0.03, 0.69 ± 0.03 respectively and iodine value were 123.00 ± 0.29, 121.50 ± 1.05, 119.55 ± 0.21, 118.10 ± 0.31, 117 ± 0.35, 114 ± 0.90, 111.10 ± 0.38 respectively.
Galucio et al. (2011) said that sunflower oil (Helianthus annuus) is rich in unsaturated fatty acids considered essential to human health. The aim of this work is to characterize physical-chemically the sunflower oil.
Iodine value (g I2/100g), Saponification value (mg KOH/g), and Free Fatty Acid (%) were 122.8, 191.7, and 0.262, respectively.
Ali et al. (2009) determined the chemical constant of the seed oil of two sunflower lines when subjected to water stress at different growth stages where found iodine value 112.08 ± 3.38-119.87 ± 5.57 in case of Gulshan 98 genotype and 113.99 ± 4.39-128.34 ± 3.78 in case of Suncross. The iodine value of the oil decreased significantly in cv. Suncross with the
imposition of water stress at the reproductive stage, but this decreasing effect was not observed in cv. Gulshan-98. Saponification value were 184.42 ± 4.56-188.52 ± 4.89 in case of Gulshan 98 where 178.45 ± 3.56- 186.67 ± 4.56 for Suncross genotype. The oil saponification value remained unaffected due to water stress. But water stress at reproductive stage there were significant difference between two genotype in case of saponification value.
Anjum et al. (2006) was observed the microwave roasting effects on the physicochemical composition of sunflower seed oil. Saponification values of the control sunflower oil samples of varieties KL-39 and FH- 330 were 189.0 and 185.0 mg KOH/g, respectively. Iodine values of control oils of KL-39 and FH-330 were 138.0 and 140.0 g of I2/100 g of oil, respectively.
Earle et al. (1968) found that iodine value of different variety of sunflower was ranged from 114.6 to 136.5. They found the highest iodine value was observed from Vniimk 8931; while the lowest iodine value was found in Krasnodarets.
Fatty acid composition
Sunflower oil has a special fatty acid composition. It contains different types of saturated and unsaturated fatty acid. Oleic acid, linoleic acid, palmitic acid and stearic acid are the most important fatty acids in sunflower oil.
Akkaya et al. (2018) determine the fatty acid composition of sunflowers cultivated in the warm climate of the Cukurova region at different sowing dates. The average percentages of oleic acid obtained in the study were 60.08%, 74.35% and 88.01% in standard, mid-oleic and high-oleic sunflower varieties. When the variation in oleic acid ratios were
examined according to the sowing date, it was seen that the sowing date in both of the high-oleic sunflowers, and the Saray variety of the mid- oleic sunflowers, did not affect the oleic acid ratio (p> 0.05).
Reis Akkaya and Akkaya (2018) conducted an experiment to determine the fatty acid composition of oils extracted from sunflowers grown in East Mediterranean region. Samples were taken from 6 different sunflower varieties planted in three different locations during the harvest season. Oleic acid contents of oils extracted from sunflowers were 41.04- 46.15% for standard-oleic acid types and 81.99% for high-oleic acid containing type in average. Average linoleic acid contents were 40.72- 46.73% for standard-oleic type and 8.16% for high-oleic acid type. The results of this study showed that oils extracted from sunflower grown in East Mediterranean region had higher oleic acid content. Pre-sowing sunflower seeds classified in standard type turned out to be mid-oleic acid type when grown in this region.
Rehab (2012) found that the amount of C16:0, C18:0, C18:1, C18:2, C18:3, SAFE, MUFA, PUFA were 7.60 ± 0.41, 4.92 ± 0.09, 19.50 ± 0.31, 67.48 ± 1.22, 0.50 ± 0.02, 12.52 ± 0.50, 19.50 ± 0.31, 67.98 ± 1.24 percent respectively. Sunflower oil had significantly (P < 0.05) the highest level of linoleic acid.
Gonzalez-perez and Vereijken (2007) showed in a review paper title
“Sunflower proteins: overview of their physicochemical, structural and functional properties” that fatty acid composition in sunflower oil were Palmitic, Stearic, Oleic, Linoleic 5–7%, 2–6%, 15-37%, 51-73%, respectively.
Anjum et al. (2006) was observed the microwave roasting effects on the physicochemical composition of sunflower seed oil. The principal fatty acid components of the control sunflower oil varieties KL-39 and FH-330
were palmitic (C16:0), stearic (C18:0), oleic (C18:1), and linoleic acid (C18:2) in concentrations of 8.06, 7.42; 4.04, 3.35; 30.82, 39.68; and 53.93, 49.53%, respectively.
Baydar and Erbas (2005) showed that the composition of fatty acids changed significantly during seed development. Palmitic acid, stearic acid, oleic acid and linoleic acid comprised over 99% of total lipids on the average, and of these oleic and linoleic acids comprised over 85% of total fatty acids. In the first year, palmitic and stearic acid contents decreased significantly with seed development, reaching minimum values of 6.60% at 35 DAF and 4.80% at 30 DAF, respectively. In the second year, while palmitic acid fluctuated up to late maturity stages, stearic acid showed a regular decrease from 8.80% to 3.50%.
Seiler (1983) examined the effects of flowering date on fatty acid composition for 38 wild H. annuus populations and cultivated sunflower Hybrid 896 grown at a single location. In wild H. annuus, palmitic acid appeared variable (4.80-5.60%). It was high at the first flowering date and then decreased and became cyclic. A similar trend was observed in the commercial hybrid .Stearic acid in wild H.annuus seeds remained relatively stable for the first eight flowering dates and then increased and leveled off during the last three samplings. It ranges from (2.40-3.70%) and averaging 2.90%. Stearic acid in the commercial hybrid was more erratic in the early samplings but ended up at about the same level as in the wilds. It ranges from (1.80-3.50%) and averaging 2.40%. Oleic acid in wild H. annuus, varied from 12.80 to 31.10%, averaging 22.20%, and linoleic acid varied from 63.70 to 77.90%, averaging 69.10%. In case of commercial hybrid oleic acid varied from 15.80 to 49.70%, averaging 32.80%, and linoleic acid varied from 41.60 to 75.00%, averaging 58.50%. The general trend for linoleic acid was opposite that for oleic
acid. Linoleic acid increased from the first date of flowering to a maximum at the last date. Linoleic acid levels of wild H. annuus seeds began at a higher level than occurred in the commercial hybrid seeds.
However, it increased about the same level in both wild and cultivated seeds by the last date.
Harris et al. (1978) reported that palmitic acid decreased from 19.60% to 6.20% and that stearic acid increased from 1.80% to 5.40% during seed development in sunflower. A rapid decrease in the synthesis of oleic acid and a rapid increase in the synthesis of linoleic acid were observed during the development of sunflower seeds, with no abrupt fluctuation. When the seeds developed from 10 to 45 DAF, oleic acid content decreased from 38.30% to 21.40% in 2002 and from 40.90% to 20.20% in 2003, linoleic acid increased from 46.00% to 65.60% in 2002 and 33.70% to 64.90% in 2003. Thereafter, oleic acid content significantly declined, while linoleic acid content significantly increased during seed development.
Dorrell and Whelan (1978) reported that oleic acid varied from 12.30 to 19.20%, averaging14.80%, and linoleic acid varied from 74.40 to 82.60%, averaging 79.70%. They also reported that palmitic acid varies from 2.60 to 6.10%, averaging 3.50%, and stearic acid varies from 1.30 to 2.60%, averaging 2.00%.
Earle et al. (1968) showed the comparative data on the composition of achenes from sunflower varieties Armavirec, Peredovik, Vniimk 8931, Smena, Krasnodarets, Arrowhead and Mingren. Hand-separated achene components were analyzed. Kernel oil from seed raised in northern United States or southern Canada typically contains about 70% of linoleic acid. The result showed that the sunflower oil contain defferent amount of fatty acid such as myristic acid (0.10-0.20%), palmitic acid (5.00-6.00%),
palmitoleic acid (0.10%), stearic acid (4.40-6.50%), oleic acid (15.90- 41.40%), linoleic acid (46.00-71.50%).
Protein
Around 28-32% of the mustard seed total weight is composed of proteins.
Proteins are polymers of amino acids. Proteins form the structural elements of cells and tissue in the human body and are considered as the basis of life, but they are also essential components in different food systems.
Gonzalez-perez and Vereijken (2007) showed in a review paper title
“Sunflower proteins: overview of their physicochemical, structural and functional properties” that dehulled seed of sunflower contain 20.40- 40.00% crude protein where whole seed contain 10.00-27.10%, the value being strongly affected by the sunflower variety. About 87–99% of this is true protein. The other 1–13% originates from peptides, amino acids or other nitrogenous substances.
Anjum et al. (2006) was observed the microwave roasting effects on the physicochemical composition of sunflower seed oil. Contents of protein of the unroasted sunflower oilseeds of variety KL-39 and FH-330 were 24.94 and 21.00, respectively.
Earle et al. (1968) carried out an experiment to determine the protein content of different sunflower variety. They reported the protein content (%N×6.25) of different variety were 16.90%, 19.80%, 16.00%, 23.80%, 22.20%, 18.10%, and 15.90% for Armavirec, Peredovik, Vniimk 8931 , Smena, Krasnodarets, Arrowhead, Mingren, respectively. The crude protein contents are calculated by use of the conventional factor of 6.25 times the nitrogen percentage.
Canvin et al. (1965) showed that the effect of temperature on the fatty acid composition of the oils from several oil seed crops. Plants of rape, safflower, sunflower, flax, and castor bean were cultivated at temperatures of 10, 16, 21, and 26.5 ⁰C for the period of seed development. The protein content of the seeds of all the species increased with increasing temperature. Protein content (% N × 6.25) of sunflower was 13.90 ±0.40, 15.70 ± 0.70, 15.90 ± 0.30, 20.30 ± 0.50 at temperatures of 10, 16, 21, and 26.5⁰C.
Mineral
Unlike other nutrient elements, mineral cannot be synthesized by living organism. Mineral are inorganic elements required by the animal body for maintenance of vital processes essential for life. The general functions of minerals are structural component of body organ and tissues, constituents of body fluids and tissues, electrolytes, and catalysts in enzyme and hormone system. The major minerals are calcium, magnesium, phosphorus, potassium, and sulfur and trace minerals are iron, manganese, zinc, and boron.
Kollathova et al. (2019) worked to investigate mineral profile of oilseeds and their by-products as feeding sources for animal nutrition. In case of macro minerals, whole seed of sunflower contained calcium, phosphorous, magnesium and potassium were 0.23%, 0.69%, 0.34%, and 0.87%, respectively where cake contained same macro miner were 0.33%, 1.44%, 0.42%, and 1.38%, respectively. Micro minerals such as cupper, iron, manganese, and zinc for whole seed were 2.12 mg%, 3.38 mg%, 1.50 mg%, and 4.70 mg%, respectively and same minerals for cake were 3.19 mg%, 5.87 mg%, 2.105 mg%, and 5.89 mg%, respectively.
Nadeem et al. (2010) was conducted a research word to characterize the sunflower hybrids and assess their suitability for the preparation of bread.
The iron, zinc, copper, manganese, calcium, sodium, potassium and magnesium contents ranged from 5.57 to 8.85 mg% and 6.40 to 10.19 mg%, 9.05 to 14.19 mg% and 9.53 to 17.86 mg%, 6.83 to 8.73 mg% and 6.92 to 12.17 mg%, 2.11 to 3.72 mg% and 2.50 to 6.99 mg%, 3.19 to 3.90 mg% and 3.45 to 4.10 mg%, 44.02 to 45.86 mg% and from 44.43 to 46.65 mg%, 4.68 to 6.81 mg% and from 5.14 to 7.0 mg% and 7.34 to 16.36 mg% and 8.21 to 18.06 mg% between the whole sunflower seeds and dehulled seeds, respectively among different sunflower hybrids. On account of mineral content, FH-331 was found to be the best.
USDA (2008) gave the following composition for mineral contents in sunflower seeds. Per 100 g seeds contains calcium 78 mg, iron 5.25 mg, magnesium 325 mg, phosphorus 660 mg, potassium 645 mg, sodium 9 mg, zinc 5.mg, copper 1.80 mg, manganese 1.95 mg.
Gonzalez-perez and Vereijken (2007) showed in a review paper title
“Sunflower proteins: overview of their physicochemical, structural and functional properties” that dehulled sunflower seed contain amount of macro minerals such as Potassium, Phosphorus, Sulfur, Magnesium, Calcium, and Sodium were 0.67–0.75%, 0.60–0.94%, 0.26–0.32%, 0.35–
0.41%, 0.08–010%, and 0.02%, respectively.
CHAPTER III
MATERIALS AND METHODS 3.1 Sample collection and preparation
The investigation was conducted at the Biochemistry laboratory of the Sher-e-Bangla Agricultural University, Dhaka-1207, Bangladesh and the laboratory of Soil Resource Development Institute (SRDI), Khamarbari, Dhaka, Bangladesh between October, 2019 to February, 2020. Two high yielding varieties (HYV) released from Bangladesh Agricultural Research Institute (BARI) namely BARI Surjomukhi-2, BARI Surjomukhi-3, two hybrid (Candian OP and Taiwan KB2) and one Local variety of sunflower (Helianthus annuus L.) were selected for the study.
Seeds were collected from different local market of Bangladesh. Sample were as T1 = BARI Surjomukhi-3, T2 = Local variety, T3 = Candian (Hybrid), T4 = Taiwan (Hybrid) and T5=BARI Surjomukhi-2.
3.2 Brief description of varieties
(a) BARI Surjamukhi-2: Developed by Bangladesh Agriculture Research Institute (BARI), Gazipur, Bangladesh following open pollination and selection method. The seeds are 9-10 mm long and 4 mm broad. cylindrical or drop-shaped. Its grain is black in color. The grain size is medium or large
(b) BARI Surjamukhi-3: This is a composite variety evolved by BARI in recent. Its grain colour is bright black and near oval in shape. The grain is medium in size.
(c) Canadian (Hybrid): This is hybrid variety. The seeds are 10-11 mm long and 4 mm broad, cylindrical or drop-shaped. Its grain color is striped grey/black. The grain is large in size.
Plate 1. Photograph of sunflower seeds.
(a) BARI Surjamukhi-3 (b) Canadian (Hybrid)
(c)BARI Sujramukhi-2 (d) Taiwan (Hybrid)
(e) Local
(d) Taiwan (Hybrid): This is also hybrid variety. The seeds are 9-11 mm long and 4 mm broad, cylindrical or drop-shaped. Its grain is black in color. The grain size is medium or large.
(e) Local: This is local variety found in defferent district of Bangladesh mainly southern region. The seeds are 9-11 mm long and 4 mm broad, cylindrical or drop-shaped. Its grain is in striped grey colour. The grainsize is medium to large.
3.3 Physicochemical Properties
The nutritive value of a food-grain is indicated by its composition shown by chemical analysis. The degree to which the chemical analysis indicates the nutritive value is dependent on the constituents determined. Some constituents are determined fairly easily and rapidly, while others require much more time and analytical ability. Consequently, most laboratories are faced with a choice between making a few rather simple determinations of a large number of samples or complete analysis of a limited number of samples. Before undertaking an analysis, the results of which will represent the composition of a crop or a consignment of a food-grain, it is necessary to ensure that the sample taken is randomly selected so as to be truly representative of the original bulk, and is sufficient in amount.
3.4 Determination of thousand grain weight
The mass was determined by randomly selecting 100 seed samples and weighing in an electronic balance of 0.0001 g sensitivity. The weight was then converted into 1000 seed mass.
3.5 Determination of moisture
Moisture content if sunflower sample was determined by conventional method i.e., drying in an oven at 100⁰C for overnight.
Materials
1. Aluminum moisture dish 2. Electrical weighing balance 3. Oven
4. Desiccator Procedure
Empty aluminum moisture dish was weighted (W1) and 2.5 g sample (dried at normal temperature after harvest) was taken in a moisture dish and weighted (W2). The sample was spreaded evenly and placed without lid in oven and dried samples overnight at 100⁰C. The dishes were transferred to desiccators to cool. Aluminum dish was weighed after cooling (W3) (Aziz et al., 2018).
Calculation:
% Moisture =W2 − W3
W2 − W1× 100
3.6 Determination of ash
In this method, destruction of organic matter is accomplished by high temperature oxidation. The critical factors are (i) nature of the ashing vessel, (ii) placement in the muffle furnace and (iii) ashing temperature and time. The vessels used for ashing ranges from silica to platinum crucible or dishes. The sample size can vary from 0.5 to 2.0 g, depending on expected concentration of elements to be determined. The temperature
used for ashing vary from 475 to 600⁰C or even more and time required for digestion can be from 4 to 12 hours (depending on the sample weight and type of sample) (Paul et al., 2017).
Materials:
1. Silica crucible 2. Balance
3. Muffle furnace 4. Desiccators.
Procedure
First a silica crucible was weighted and then 2.0 g of dried ground sample was taken in the silica crucible. The crucibles are placed in a cool muffle furnace (Protech, Model:PT-1700M). Care should be taken to see that the crucibles are away by at least 2 cm from the walls of the furnace. This is to avoid localized over-heating. Ashing is usually done by heating the furnace at 600⁰C for about 5 hours (temperature and duration of heating need to be standardized as these two factors vary from sample to sample).
The crucibles were transferred into the desiccator and cooled them to room temperature and weighted. It was done immediately to prevent moisture absorption. The incineration repeated until constant weight was obtained.
Calculation:
% Ash = Weight of the ash
Weight of the sample taken× 100
3.7 Chemical Analyses
3.7.1 Oil extraction and cake preparation Materials:
1. Electrical weighing balance 2. Soxhlet apparatus
3. Menthol heater
4. Petroleum ether (40-60⁰C) Procedure
The sunflower oil was extracted using Soxhlet method (Aziz et al., 2018) with some modifications. First, sunflower seed (50 g) was taken in aluminum dish and dried for 1 hour at 100ºC temperature. Sunflower flour was prepared by using blender. Then sample was taken into 25x100mm cellulose soxhlet extraction thimble (Whatman 2800-250).
The thimble was put into the soxhlet and 250 ml petroleum ether (AR grade) was poured into the soxhlet flask. Then it was connected to round bottom flask followed with condenser and total apparatus was placed on menthol heater (40-60ºC temperature) for 16-20 hours. When extraction of oil was completed menthol heater turned off and permitted to cool.
Allow the round bottom flask open for 1 days to remove the solvent from the extracted oil. Thimble was removed from the soxhlet and dried the sample in normal air. Finally, sunflower oil cake (a byproduct after getting oil) was collected. The yield of sunflower oil was calculated by following formula.
Oil percentage of seeds = Weight of extracted oil
Weight of seeds × 100
3.7.2 Estimation of total protein content by Microkjeldhal method The protein content of food stuff is obtained by estimating the nitrogen content of the material and multiplying the nitrogen value by 6.25 (according to the fact that nitrogen constitutes on average 16% of a protein molecule). This is referred to as crude protein content, since the non-protein nitrogen (NPN) present in the material is not taken in consideration. The estimation of nitrogen is done by Kjeldhal method (AOAC, 2010) which depends upon the fact that organic nitrogen when digested with sulphuric acid in the presence of catalyst selenium oxide, mercury or copper sulfate is converted into ammonium sulphate.
Ammonia liberated by making the solution alkaline is distilled into a known volume of a standard acid which is then back titrated.
The nitrogen present in the sample is converted to ammonium sulphate by digestion at (380ºC) with sulphate acid in presence of a catalyst, potassium sulphate and mercuric oxide. Ammonia liberated by distilling the digest with sodium hydroxide solution is absorbed by boric acid and is titrated for quantitative estimation.
Equipments 1. Balance
2. Microkjeldhal (Mkj) digestion set 3. Microkjeldhal (Mkj) distillation set.
Reagents
Digestion mixture: 100 g of potassium sulphate (K2SO4) was thoroughly mixed with 20 g of copper sulfate (CuSO4.5H2O) and 2.5 g selenium dioxide (SeO2) was added with it.
Sodium hydroxide solution (60%): 600 g sodium hydroxide and 50 g sodium thiosulphate were dissolved in distilled water, cooled and made the volume up to 1 liter.
Boric acid: 40 g of boric acid was dissolved in water and made up to 1 liter.
Double indicator: 200 mg each methyl red and bromocresol green was dissolved separately in 100 ml of 70% ethanol. One part of methyl red and five parts of bromocresol green were mixed before use.
Hydrochloric acid (0.02 N HCl): 8.5 ml concentrated hydrochloric acid was added to 5 liter of distilled water. Standardized to 0.02 N acids by titrating it against standard sodium carbonate (0.02 N) solution.
Procedure
A known quantity of the finely sunflower cake sample (100 mg) was weighted out in an Mkj digestion flask. About 2 g digestion mixture was added with it 2 ml of concentrated sulphuric acid was dispensed into the flask. Then it was digested for about 2 hrs in Mkj digestion set and was cooled the clear digest. The digest was dissolved in minimum amount of distilled water and carefully transferred to an Mkj distillation set. 10 ml of sodium hydroxide solution was added and distilled it. The distillate was collected for 5 min into 5 ml boric acid containing 2 drops of mixed indicator in a 50 ml conical flask, till the color of solution was changed.
The distillate was titrated against a standard hydrochloric acid and noted the titer value (TV).
N% =(14.007) x (normality of the acid, 0.02) x (TV)
Weight of sample (mg) × 100 Where 14.007 is the equivalent weight of nitrogen.
Nitrogen % is converted into protein by multiplying with a factor 6.25 for cereals and pulses.
3.7.3 Chemical constant
3.7.3.1 Determination of Saponification value and saponification equivalent: Saponification value is the number of milligrams of KOH required to completely saponify 1 g of oil. The method is based upon the principle that fat, on treatment with excess of alcoholic KOH is used up.
The excess of KOH left unused may then be found by titrating it against a standard acid.
The Saponification equivalent (groups of saponified per equivalent of base) is proportional to the average molecular weight of the fatty acids present in the lipid.
Reagents
Hydrochloric acid 0.5 N: 20.9 ml 37% HCl mixed with water for 500ml solution.
Alcoholic solution of Potassium hydroxide. Take 14.02 g potassium hydroxide and dissolve it in very little water. Make up to 500 ml by adding rectified spirit (C2H5OH) of specific gravity 0.81.
Phenolphthelin solution, 1% in alcohol:0.2g phenolphthelin mixed with ethanol to make up to 20 ml.
3KOH
Potassium salt of higher fatty acid CH2OCOC17H35
CHOCOC17H35
CH2OCOC17H35 (Oil or Fatty acid)
(Potassium Hydroxide)
3C17H35COOK
CH2OH
CHOH
CH2OH (Glycerol) +
+
=
Procedure
Oil was taken (1-2 g) in bottom flask. Added 25 ml of 0.5 N alcoholic potash solutions and fit the flask with a cork and a long air condenser.
Refux the contents of the flask for about 30 minutes by heating on boiling water bath. Cool the flask and add 1 ml of 1% solution of phenolphthalein and titrate the excess of the alkali against standard N/2 acid (A). At the same time and under similar conditions carry out a blank experiment (B) without fat (25 ml of the same alcoholic KOH heated in a similar way is titrated, against 0.05 N acid) (Sharif et al., 2017).
Calculation:
Saponification value = 56.1 × (B − A) × strenght of acid Weight of substance in g
Saponification Equivalent = 56100
Saponification value
3.7.3.2 Iodine value
Iodine value or Iodine absorption number is the percentage of iodine monochloride (ICI) in terms of iodine absorbed by the oil. Some oils and fats contain many unsaturated fatty acid constituents such as oleic and linoleic acids which take up halogen to form saturated compounds. The extent of this combination however, depends on the degree of unsaturation (Sharif et al., 2017).
Regents required
Sodium thiosulphate (0.1 N): 12.41 g sodium thiosulphate pentahydrate mixed with water to make up to 500 ml.
Starch solution (indicator): Starch (1g) was dissolved in 50 ml hot water and diluted to 100 ml with cold water.
Hanus solution: Iodine (13 g) was dissolved in glacial acetic acid.
Bromine (3 ml) was added to it and the solution was diluted with glacial acetic acid to 1 liter.
15% Potassium iodide solution: Dissolve 75 g KI crystals in water and make up the volume to 500 ml.
Procedure
In a 500 ml dry glass stoppered bottle, added 5ml of given oil sample (the oil sample was dissolved in 10 ml chloroform (the concentration of the oil sample is 5%).
To the content of the bottle 25 ml of Hanus solution was added and the mixture was allowed to stand in the dark for exactly 30 minutes with occasional shaking.
Potassium iodine (10 ml) solution was mixed to it and the mixture was shaken well.
Freshly boiling cooled water (100 ml) was added to the mixture and the content of the bottle was titrsted with 0.1 N sodium thiosulphate solution, using starch solution as indicator.
A blank experiment (without the oil) was performed exactly in the same manner as described above.
Calculations:
Iodine value = S × (X − Y) × 0.127 × 100 W
Where, S=Strength of the sodium thiosulphate solution.
X= ml of sodium thiosulphate solution required in the blank test.
Y= ml of sodium thiosulphate solution requird in true test.
W=Weight of the oil taken in grams.
3.7.3.3 Acid value and Free fatty acid (as oleic acid)
The acid number or value of a fat or oil tells the amount of free fatty acid present in it. The acid number is expressed as the Number of milligrams of potassium hydroxide required to neutralize the free fatty acids present in one gram of fat. The acid number of a fat can give the extent of rancidity in a stored sample. A fat which has been both processed and stored properly has a very low acid number. During storage fats may become rancid as a result of peroxide formation at the double bonds by atmospheric oxygen and hydrolysis by micro-organisms with the liberation of free fatty acid. The amount of free fatty acid present therefore gives an indication of the age and quality of the fat.
Reagents
Phenolphthalein: 1 percent solution in alcohol neutralized with 0.1 N NaOH.
Denatured alcohol (Neutral): Mix 10 volumes of ethyl alcohol with 1 volume of methyl alcohol and neutralize with N/4 NaOH using phenolphthalein as indicator.
0.25N Sodium hydroxide and 0.1N Sodium hydroxide.
0.05 N potassium hydroxide solution Procedure
Oil sample (5-7 g) in 250 ml conical flask was taken and added 50 ml denatured alcohol (neutral) and shaked well. Then 2 ml of phenolphthalein as indicator was added and titrated against 0.05 N potassium hydroxide with vigorous shaking after each addition till a permanent light pink color was produced which persists for at least 1 minute (Sharif et al., 2017).
Calculation:
Acid value = 56.1 × N × V W Where, N= Strength of potassium hydroxide
V= Number of ml of aqueous potassium hydroxide required for titration
W= Weight of the oil taken in the gram Free fatty acid
Percentage of free fatty acid (oleic acid) was calculated by using the formula:
% Free fatty acid (as oleic acid) = Acid value × M 561 Where,
M= molecular weight of the oleic acid.
3.7.4 Estimation of fatty acid composition
Fatty acid composition was determined by Gas-liquid chromatographic method (Uppstrom et al., 1978).
Reagent
Ethylate reagent (Petroleum ether / 0.02M sodium hydroxide in ethanol (2/3)
A Salt solution (80 g NaCl and 3g Sodium hydrogen Sulphate in 1 litre water).
Procedure
About 12 mg of oil or equivalent amount of oil seeds was taken (seed was crushed in an oil paper and then transferred into a test tube).
The sample was extracted and transesterified at the same time with 5 ml ethylated reagent and shaked.
The samples were kept for overnight at room temperature.
10 ml salt solution was added and shaked. As soon as the two layers were separated, the benzene phase was transferred to small test tubes.
A Philips PU 4500 chromatograph instrument was used with flame ionization detector (FID).
A glass column (1.5m x 4mm) was packed with BDS. With this column the injection post, column and detector temperature was set at 220º C, 185º C and 240º C, respectively.
Nitrogen flow (used as career gas) rate was 22 ml/min, the injection volume was 2µl. Peak areas were measured with an electronic digital integrator (Shinadzu C-R6A chromatopac).
3.8 Estimation of minerals 3.8.1 Preparation of reagents
3.8.1.1 Reagents for P determination Reagent A
Added antimony trioxide (45 g) in 400ml water then added 150ml conc.
H2SO4 and allowed to cool.
Ammonium molybdate (7.5 g) was dissolved in 300ml water. Cool antimony solution and molybdate solution was mixed by adding 1 liter of water.
Reagent B
Gelatin (1 g) was dissolved in 100 ml hot water.
Reagent A (150 ml) dissolved to about 500 ml water and dissolved gelatins were mixed and finally, 1 g of ascorbic acid was dissolved with it to make volume 1 liter.
3.8.1.2 Reagent for Ca and Mg determination 1% Lanthanum solution
Fifty nine gram of lanthanum oxide (La2O3 ) were added in 50 ml of water then added 250 ml conc. H2SO4 gradully and carefully. It was made up to 5 liters by adding water.
3.8.1.3 Reagents for S determination Mixed acid seed solution
Firstly 65 ml of conc. HNO3 and 250 ml glacial acetic acid were added to about 500 ml of water. Then 3 ml of 1000 ppm S standard solution was added and made volume to one liter with water.
Turbidimetric reagent
Ten g of polyvinyl pyrolidone (PVP K30) was dissolved in about 100 ml of hot water along with 150 g of BaCl2.2 H2O was dissolved in about 500 ml of water. The PVP and barium chloride solutions were mixed and were made to liter with water
3.8.2 Preparation of standards
For standard calibration Cu, Fe, Mn and Zn were prepared together in water following concentration as 2μg Cu/ml, 10μg Fe/ml, 4μg Mn/ml, 2 μg Zn/ml.
The P, K and S were also prepared together in water as 20μg P/ml, 100 μg K/ml, 20 μg S/ml.
Finally, Ca and Mg as 100 μg Ca/ml, 40 μg Mg/ml were prepared in the same solution.
3.8.3 Digestion solution Nitric-perchloric solution
Conc. Perchloric acid (100 ml) was added to 500 ml concentrated HNO 3
to prepare nitric-perchloric solution.
3.8.3.1 Digestion of sample for determination of P, K, Ca, Mg, S, Cu, Fe, Zn and Mn
Digestion procedure
Oil cake (500 mg) was taken into a 50 ml boiling flask. 5 ml of nitric- perchloric acid (5:1) solution was added and placed in digestion chamber.
Started digestion for 1 hour and 30 minutes at 370ºC temperature. After completely digestion removed from digestion chamber and was cooled and 15 ml water was added. For collection of aliquot the flask was slowly agitated and heated to suspend the ash and filter.
3.8.4 Analytical procedure
By using a combination diluter-dispenser, 1 ml aliquot was taken from filtrate and 19 ml water (dilution 1) was added. The other dilutions were made in the following order. For S determination, 7 ml of aliquot from dilution 1, 9 ml of acid seed solution and 4 ml of turbid metric solution were mixed together thoroughly. It was allowed to stand 20 minutes and not longer than one hour. The reading was taken in turbid meter or in colorimeter at 535 nm using a cuvette with 2 cm light path. For P and K determination, 1 ml aliquot from dilution 1, 9 ml of water and 10 ml of color reagent were mixed together. It was allowed to stand about 20 minutes and reading was taken by using spectrophotometer at 680 nm for P and by using a flame photometer (Model AnA-135, OSK, Japan) at
766.5 nm for K. For Ca and Mg determination, 1 ml aliquot from dilution 1, 9 ml of water and 10 ml of 1% lanthanum solution were mixed together. It was analyzed by Atomic Absorption Spectrometer contrAA 700 (Analytik Jena). For Fe, Mn and Zn determination, the original filtrate was used to analyze these elements by Atomic Absorption Spectrometer (Sharif et al., 2017).
3.9 Statistical Analysis
The recorded data for each character from the experiments was analyzed statistically with a one way ANOVA to find out the variation resulting from experimental treatments using statistix 10 program. The mean for all the treatments were calculated and analysis of variance of characters under the study was performed by F variance test. The mean differences were evaluated by (LSD) Least Significance difference test (Gomez et al., 1984).
CHAPTER IV
RESULTS AND DISCUSSION
Five released cultivars of sunflower (Helianthus annuus L.) were taken for the determination of physical and chemical characteristics. The seeds were stored in the refrigerator under a suitable storage condition. The proximate composition and some other nutrients compositions of sunflower seeds are also testified.
Analytical studies of the whole seeds
The proximate composition of whole sunflower seeds of different released cultivars is presented in different tables. The data have also been estimated on a moisture-free basis in order to allow for a better comparison of the different fractions. The data taken are the average of three replication and have been presented and discussed.
4.1 Physical characteristics of sunflower released cultivars 4.1.1 Thousand grain weight
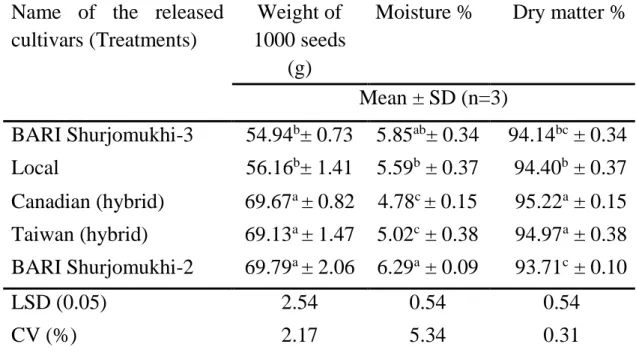
The significant variations were observed among the different varieties in terms of the effect on the thousand-grain weight (Table 1). The highest weight of thousands grains was found in BARI Shurjomukhi-2 (69.79 ± 2.06 g), which was statistically identical with Taiwan (hybrid) (69.13 ± 1.47 g) and Canadian (hybrid) (69.67 ± 0.82 g). The lowest weight of thousand grains was found in BARI Sujomukhi-3 (54.94 ± 0.73 g), which also statistically identical with Local (56.16 ± 1.41 g) variety. The present values were supported by the reported values (Earle et al., 1968; Baydar and Erbas, 2005). Seiler (1983) reported lower value (27.2-47 g) than the present investigation and demonstrated that grain weight vary due to flowering date. Maturity stages and positions of seeds on the head can
change the grain weight (Baydar and Erbas, 2005). Seed weight varied with their size and shape (Chowdhury et al., 2014). Grain weight increased from 4.3 to 5.1 g as the moisture content increased from 7.00 to 15.99% (Damian, 2014).
4.1.2 Moisture
The moisture percentage of different sunflower genotypes was ranged from 4.78 ± 0.15% to 6.29 ± 0.09% (Table 1). The highest value of moisture percentage was found in BARI Shurjomukhi-2 (6.29 ± 0.09%), which was statistically similar to BARI Shurjomukhi-3 (5.85 ± 0.34%) and also followed by Local (5.59 ± 0.37%) variety. The lowest value of moisture content was found in Canadian (hybrid) (4.78 ± 0.15%), which was statistically identical with Taiwan (hybrid) (5.02 ± 0.38%). Present results was similar with (Earle et al., 1968 and Nadeem et al., 2010). The reason of changing the moisture content may be due to too much drying the grain after harvest, storage period (Bhardwaj et al., 1999). Apart from this maturation process, can change the moisture content of the grains by a series of morphological, physiological and functional changes that started from fertilization, continuing until the grains reach sufficient moisture for harvest (Ciabotti et al., 2016).
4.1.3 Dry matter
A statistically significant variation was observed for dry matter content of different sunflower genotypes that have been presented in (Table 1). The highest dry matter content (95.22 ± 0.15%) were observed from Canadian (hybrid), which was statistically identical (94.97 ± 0.38%) to Taiwan (hybrid) and followed (94.14 ± 0.34% and 94.40 ± 0.37%) by BARI Shurjomukhi-3 and Local, respectively. The lowest dry matter content (93.71 ± 0.10%) was found in BARI Shurjomukhi-2. Kollathova et al. (2019) reported the similar result.
Table 1. Weight of thousand seed, moisture and dry matter of different released cultivars of sunflower.
Name of the released cultivars (Treatments)
Weight of 1000 seeds
(g)
Moisture % Dry matter %
Mean ± SD (n=3)
BARI Shurjomukhi-3 54.94b± 0.73 5.85ab± 0.34 94.14bc ± 0.34 Local 56.16b± 1.41 5.59b ± 0.37 94.40b ± 0.37 Canadian (hybrid) 69.67a ± 0.82 4.78c ± 0.15 95.22a ± 0.15 Taiwan (hybrid) 69.13a ± 1.47 5.02c ± 0.38 94.97a ± 0.38 BARI Shurjomukhi-2 69.79a ± 2.06 6.29a ± 0.09 93.71c ± 0.10
LSD (0.05) 2.54 0.54 0.54
CV (%) 2.17 5.34 0.31
In a column, means with a similar letter (s) are not significantly different and means with different letter (s) are significantly different by LSD at 5% level of significance.
SD = standard deviation; CV = Coefficient of Variation; LSD = Least significant difference.
4.1.4 Oil content
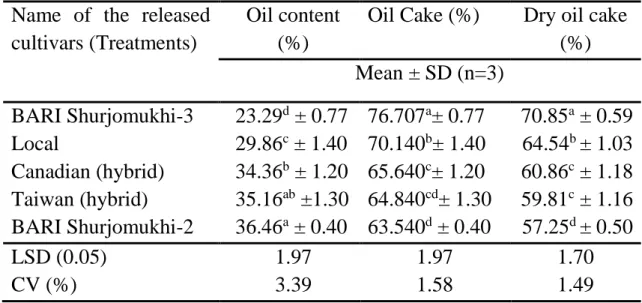
Different sunflower genotypes varied significantly in terms of oil content.
The oil content of different sunflower genotypes was varied from 23.29 ± 0.77% to 36.46 ± 0.40% (Table 2). The highest amount of oil content was found (36.46 ± 0.40%) to BARI Shurjomukhi-2, which was statistically similar (35.16 ± 1.30%) to Taiwan (hybrid) and followed (34.36 ± 1.20%) by Canadian (hybrid). The lowest amount of oil content was observed (23.29 ± 0.77) by BARI Shurjomukhi-3, which was followed (29.86 ± 1.40) by Local variety. The present values were accepted by the reported values of (Akkaya et al., 2018). Earle et al. (1968) found that the oil% sunflower genotypes was ranged from 21.00% to 51.40%. The reason of such variation among genotypes for fluctuation of temperatures which have inverse relationship with oil content during seed