©Daffodil International University
FEASIBILITY AND SENTIMENT ANALYSIS OF DEPLOYING APP-BASED TRANSPORTATION SYSTEM FOR RICKSHAW
BY ALI EMRAN ID: 152-15-6093
This Report Presented in Partial Fulfillment of the Requirements for the Degree of Bachelor of Science in Computer Science and Engineering
Supervised By
MD. Abbas Ali Khan
Lecturer Department of CSE
Daffodil International University
Co-Supervised By
MD. Sadekur Rahman
Assistant Professor Department of CSE
Daffodil International University
DAFFODIL INTERNATIONAL UNIVERSITY DHAKA, BANGLADESH
DECEMBER 2019
©Daffodil International University
ii
©Daffodil International University
©Daffodil International University
iv
ACKNOWLEDGEMENT
First I express my heartiest thanks and gratefulness to almighty Allah for his divine blessing made me possible to complete the final thesis successfully.
I really grateful and wish my profound my indebtedness to Mr. Md. Abbas Ali Khan, Department of CSE, Daffodil International University, Dhaka. Deep Knowledge & keen interest of my supervisor in the field of “Data Mining, System Analysis and Machine learning” to carry out this thesis. His endless patience, scholarly guidance, continual encouragement, constant and energetic supervision, constructive criticism, valuable advice, reading many inferior draft and correcting them at all stage have made it possible to complete this thesis.
I would like to express our heartiest gratitude to Dr. Syed Akhter Hossain and Head, Department of CSE, for his kind help to finish my project and also to other faculty member and the staff of CSE department of Daffodil International University.
I would like to thank our entire course mate in Daffodil International University, who took part in this discuss while completing the course work.
Finally, I must acknowledge with due respect the constant support and patients of my parents and brother.
©Daffodil International University
ABSTRACT
In recent years it is noticeable that App Based Transportation System like Ride Sharing (uber or patho) has become popular day by day. So I have thought different way. For our daily life, Rickshaw is most important for short distance. If we add this vehicle in our ride sharing system, it will very much helpful for us specifically for rainy days. In Rainy Day most of the time in our city, other vehicle like CNG, Car, and Bike and so on become unused because roads go under water. It will be good system to find a Rickshaw for those day. So I collect data from Student, Teacher, Businessman, Job holder and so on. For this purpose I have took the Feasibility Analysis. This analysis is a process of a selected project to regulate whether it is possible and should go forward.
By feasibility analysis, we have able to predict this project how much run to start before and will it good or bad? A feasibility analysis is used to regulate the validity of an idea like ensuring a project is legally and technically feasible and economically justifiable [3]. By using this process I have come to know that this work worth in the investment and may be doable. I am also able to publish the position of people opinion by counting that how many reviews are Good, Bad, and Average comparative to with each. As all collected data is based on text document, it has been very perfect work in all terms and condition for Sentiment Analysis.
©Daffodil International University
vi
TABLE OF CONTENTS
CONTENS
PAGEBoard of examiners i
Declaration ii
Acknowledgements iii
Abstract iv
CHAPTERS
CHAPTER 1: INTRODUCTION
1-41.1 Introduction 1
1.2 Objectives 2
1.3 Motivation 2
1.4 Rationale of the Study 2
1.5 Research Questions 3
1.6 Expected Output 3
1.7 Report Layout 3
Chapter 2: BACKGROUND
5-7
2.1 Introduction 5
2.2 Feasibility analysis and Sentiment analysis 5
2.3 Related Works 6
2.4 Research Summary 6
2.5 Scope of the Problem 6
2.6 Challenges 7
©Daffodil International University
Chapter 3: RESEARCH METHODOLOGY
8-213.1 Introduction 8
3.2 Research Subject and Instrumentation 8
3.3 Data Collection Procedure 9
3.4 Implementation Requirements 9
3.4.1 Indicating the Pre-Processing Step of Research procedure 9
3.4.2 Knowledge Discovery Database 10
3.4.3 Data Pre-Processing 10
3.4.4 Data Analysis 11
3.4.5 Remarks or Comments 15
3.4.6 Sentiment Analysis Procedure 15
Chapter 4: EXPERIMENTAL RESULTS AND DISCUSSION
22-29
4.1 Introduction 22
4.2 Experimental Results 22
4.3 Descriptive Analysis 28
4.4 Prediction 29
CHAPTER 5: CONCULATION AND FURTHER STUDY
3-325.1 Summary of the Study 31
5.2 Conclusions 31
5.3 Recommendations 32
5.4 Implication for Further Study 32
REFERENCES
33©Daffodil International University
viii
LIST OF FIGURES
FIGURES PAGE NO
Figure 3.4.1: Research procedure 9 Figure 3.4.2: KDD process is used basic pre-processing 11 Figure 3.4.4.1: Average agree or disagree according to age 11 Figure 3.4.4.2: Agree or disagree according to occupation 12
Figure 3.4.4.3: Percentage of Comments or Remarks 12
Figure 3.4.4.4: Vehicle effectiveness when roads go under water 13 Figure 3.4.4.5: Possibilities of engine damage when roads go under water 13 Figure 3.4.4.6: Can Rickshaw puller handle the System? 14 Figure 3.4.4.7: How to make suitable the system for puller? 14
Figure 3.4.6.1: Supervised Machine Learning process 17
Figure 3.4.6.2: Control flow of the process 18
Figure 3.4.8.1: Naïve Bayes algorithm process 19
Figure 3.4.8.4: Output decision tree of the model 21
Figure 4.2.1: Pie chart show the percentage of Agree or Disagree. 22
Figure 4.2.2: Weka software processing. 23
Figure 4.2.3: Weka screen shot for Decision Tree results 24 Figure 4.2.4: Decision Tree constructed for the Train Dataset 25 Figure 4.2.5: Screen shot of Weka tool for support vector 26
Figure 4.4: whole process of finding prediction 30
©Daffodil International University
LIST OF TABLES
TABLES
PAGE NOTable 3.4.5: Shows the feature position of top ten reviews 15 Table 4.2: Average accuracy of different class in different algorithm 28
Table 4.3: Shows the Comment text 29
©Daffodil International University
x
LIST OF ABBREVIATION
DIU – Daffodil International UniversityCSE – Computer Science and Engineering ML – Machine Learning
RQ – Research Question FA –Feasibility Analysis SA –Sentiment Analysis
CHAPTER 1 INTRODUCTION
1.1 Introduction
Now a day’s people has started to use different type of mobile apps for ride, transport, delivery food and so on in the internet. Of them, “App Based Transportation System”
apps is one of them. In the latest years it’s observed that ride sharing apps like ‘Pathao’
and ‘Uber has become popular day by day [2, 5]. With the passing of the time Everything’s in the world are getting changed. In this modern era the communication system also changing. In this time people can go very easily here and there through the modern Transportation system. In respect of technological and modern evolution
‘Pathao’ and ‘Uber’, the Bangladeshi new transport system with mobile application is giving a new dimension of the public Transportation. Actually, the whole system is being controlled by a mobile application.
In this research work, I took a step forward through combining users review for App Based Transportation System development such as if we apply App Based Transportation System in rickshaw, is it good or bad?. As this model is based on a textual content record, so it will be prefect work in all terms and condition. Because text report indicates nearly the best predicting result of persons Sentiment. Actually this research based on analysis for prediction. Here I have worked for two analysis- Feasibility Analysis and Sentiment Analysis. Feasibility analysis is a technique where we check proposed project -it is doable and should go ahead [3].On the other hand, Sentiment analysis is the automated process that uses AI to identify positive, negative and neutral opinions from text. Sentiment analysis is widely used for getting insights from social media comments, survey responses, and product reviews, and making data- driven decisions.
By using Machine learning, we can analyze all analysis easily. Machine learning is an application of artificial intelligence that helps the ability to automatically learn and improve from experience without having to explicitly program the system. Machine learning focuses on the development of computer programs that can access data and use it for own learning. It is very important to predict. There are two type of machine
2 learning -supervised and unsupervised machine learning. In supervised learning, you train the machine using well labeled data. In it some data is already tagged with the correct answer. It can be compared to learning method that takes place in the presence of a supervisor. By using labeled training data a supervised learning algorithm helps you to predict outcomes for unforeseen data. Unsupervised learning is also a machine learning technique where mainly deals with unlabeled data. In this method, you do not need supervise the model rather then you need to allow the model to work on its own to discover information.
Here, I have selected all the valid text which only are in English. Then I build a supervised Learning model to predict the level of assessment text in this study, I took a step by way of combining person evaluate text review which is collected from the different person like student, teacher and job holder. By building a model that may expect an overview of Good, Bad and Average. By counting these categories of text review if the good category is more than bad category then easily it can say that it is users friendly and this service is good otherwise vice-versa.
1.2 Objective
To study how to use App Based Transportation System in Rickshaw.
To develop this platform that will be good or bad.
To take decision by feasibility analysis collecting data from user.
1.3 Motivation
Research with Data collection is very interesting. In this area any researcher can find the different types of smart tool for achieving solution of the prominent problem. The most important things are that, almost there are no work on transportation system in rickshaw in the perspective of Bangladesh. This base gives me the inspiration to work on it. The most vital moment that clearly inspired me that these are almost no work had been performed primarily base on Bangladesh transport in Rickshaw.
1.4 Rationale of the Study
The current transport system of Bangladesh is highly dependent on App Based Transportation System [6]. The new challenges is how to use it in rickshaw. Of this experimental way how to fulfill the goal by using the different learning methods. In experimental Data collection is very interesting to know the observation of different people. Here any researcher can find very unique way for achieving their desired goal.
The most vital thing that honestly motivated me that there is almost no research has been accomplished based on Bangladeshi transport about rickshaw. I have taken on hand with that because it will helpful for both poor and rich user. It will also helpful for the poor puller to earn more money. I think that it will be unique experiment from others.
1.5 Research Question
I have selected some question as my research work which is being answered stepwise.
Who will be benefited by using App Based Transportation System in rickshaw?
How beneficial is the App Based Transportation System in rickshaw?
What are the challenges of using App Based Transportation System in rickshaw?
What are the risks and requirements for designing a system for rickshaw?
1.5 Expected outcome
Throughout this research, I planned to perform a qualitative analysis according to the research questions and expected to find my-
Strength and power of App Based Transportation System.
Challenges for puller to handle the system.
Difficulties for using if it apply in rickshaw.
Will take the people easily this App Based Transportation System using Rickshaw with other vehicle.
1.7 Report layout
Report layout describes a summary of all chapters. A brief summary of all chapters are given below:
Chapter 1: Discusses about my thesis motivation, Rationale of the Study, Research Question and Expected Outcome.
Chapter 2: Introduce with the Background history of the research. It additionally gives us the facts of related works this research. Challenges also are mentioned right here.
Chapter 3: Discusses approximately the technique of my research work. Details works of data mining, machine learning technique. Here also mentioned approximately about the rate collection processes.
4 Chapter 4: Discuss details of the result outcome and mentioned about as and out of that’s project with experiment and result.
Chapter 5: Discuss my research with future scope that can be performed and conduct the thesis.
CHAPTER 2 BACKGROUND 2.1 Introduction
There are different type of App Based Transportation System in the world like Uber or Pathao [4]. By using App Based Transportation System, people can easily go from here to there. In Modern Transportation System, companies are being used App Based Transportation System in CNG, Car, Bike and Bicycle for their transportations. We can also use App Based Transportation System in rickshaw. It will helpful for Dhaka city because in rainy day, most of roads go under water and other vehicle become useless.
So I have took a feasibility analysis by collecting data from people that how to doable this work and is this actually helpful for us? However, some query has been raised for these project –
How to describe the theory of App Based Transportation System where Users &
Customers can play all type of their role according to system interactively?
How to make it more effective and useful for whole Bangladesh especially for cities like Dhaka?
How to make it effectively running in the lower price for the Rickshaw puller with all type of high facilities?
How can the users be benefited using this system in different type of situation?
In this reason, an expensive project will be done in the area of App Based Transportation System
Platform to participate in the city of Bangladesh.
2.2 Feasibility analysis and Sentiment Analysis
Feasibility analysis is a technique where we check proposed project -it is doable and should go ahead [3].On the other hand, Sentiment analysis is the automated process that uses AI to identify positive, negative and neutral opinions from text or comments.
Sentiment analysis is widely used for getting insights from social media comments, survey responses, and product reviews, and making data-driven decisions [7].
By using Machine learning, we can analyze all analysis easily. Machine learning is an application of artificial intelligence that helps the ability to automatically learn and improve from experience without having to explicitly program the system. Machine
6 learning focuses on the development of computer programs that can access data and use it for own learning. It is very important to predict.
2.3 Related work
It is the matter of sorrow that many works on this field has accomplished but they are about only the effect of ridesharing in transport system and economy [1, 2] and App Based Transportation System mechanism of other vehicle except Rickshaw. After reading many paper, I have come know that there are many work abut dynamic or static App Based Transportation System [4]. But I have showed here when it we apply in rickshaw, will it good or bad for us? I have took data different type of people like student, teacher, and job holder and so on. I have also showed here, is this possible or not according to Analysis?
2.4 Research Summary
This Research study make me known that my research is about Feasibility and Sentiment analysis with Supervised Machine learning and it is also a Classification Model Problem [3].
For this, I have learned Feasibility analysis and Machine learning very deeply with Classification Model [4] and the related Algorithms. For this purpose, I have collected more than 500 data from different place like University, Market and Office and so on.
There are many Tools and Technique which is suitable for analysis. I have also found out which technique is better for the completion of my research work. I have learned different kinds of tools to complete my research. I have got several types of tool and the technique to accomplish my research.
2.5 Scope of the Problem
The working scope of my research is absolutely very broad. I can use algorithm to measure the analysis. As my dataset is almost very new and no work had been done yet, there is a big opportunity to find out the problems and to solve it. By using data, I can show the clustering and correlation between agree or disagree of people against of age or occupation. It can be future business prediction model or recommendation.
.
2.6 Challenges
To find out the Algorithm selection and model selection is a massive venture. I have took all valid datasets this is fully correct. Collecting more than five hundred data was not easy work.
Feature choice become additionally a lot crucial for this study. Algorithm use was additionally an important challenge. For this research which set of rules could be very suitable, finding this was not an easy task.
When a Beginner go for a research, basically he/she needs to go with very new things.
So, keep patience for studying or working it can be a challenge.
8
CHAPTER 3
RESEARCH METHODOLOGY
3.1 Introduction
Reaching the expected goal is very important to the analysis. For this, I need to learn the goal-how to quantify the goal, obtain the alternative solution to satisfy the goal, compute cost vs benefit of each alternative solution, prepare a system proposal for the potential user of the system. This analysis is the process of determining whether an idea is workable. It is preliminary evaluate of an idea, conducted for the proposed of determining whether an idea is worth pursuing. Step of analysis is: Note down deficiencies, Set goals to remove deficiencies, calculate goals, find alternative solutions to meet goals, Evaluate analysis of alternative solutions, Rank order alternatives and discuss with user. Prepare a system proposal for management approval.
3.2 Research Subject and Instrumentation
My research aim could be very unique. I have done a work where no one work before in Bangladesh. So, it's very difference concept for all of us. For this I had taken the way to analysis, I have used the people comments and used the FA and SA rules about each data and additionally the relation of every data of a comments then I built a classification model that's why my research perspective is to constantan amazing by using all collected data. After that, I have learnt to use FA and SA technique for this purpose.
But here I have normally used the classification of data according to age and occupation.
I have analyzed more than five hundred data for my task.
FA and SA are very popular to predict the goal by using the data. The important of analysis is that I can use algorithm to sort the data.
Here, in my research all about analysis procedure and data were executed by classification task. My goal is model prediction by using FA and SA. It is also very interesting and amazing to collect data to predict a goal by using different type of data. I have seen here co relation of different data according to age and occupation.
3.3 Data Collection Procedure
Data collection was very hard challenging task for my research studies. I have gathered data from different type of occupation’s people and different type of age’s people like student, teacher, businessmen and job holder and so on. I used a form with the five point such as age, occupation, agree, disagree and remarks to collect data from students and others. I also asked some people in market place to collect the data.
For those purpose, I have took more than five hundred data from different type people.
I have to find out The FA and SA. After finding FA and SA, I have able to predict this system is may be runnable, doable and profitable
3.4 Implementation Requirement
For archiving my aim, I have maintained a few steps. Those all are very related with each other. Describe Figure is given below:
3.4.1 Indicating the pre-processing steps of research procedure.
Figure 3.4.1: Research Procedure
Total Performance Expected Output
Classification Task
Applying Method Model evaluation
Creating and selecting task Apply process
Data Pre-Processing Data tokenizing
Comment Selection
Data Collection Comment Collection
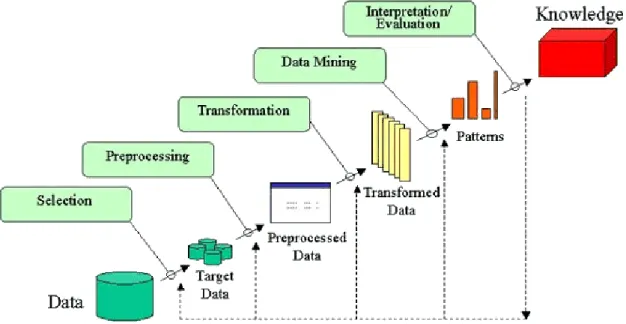
10 3.4.2 Knowledge Discovery in Database
KDD process is the fundamental step for extracting knowledge from raw data. For extracting knowledge from data set this system is being use globally. For any kind of machine learning Problem, I also observed KDD process to complete my work. There have some steps of knowledge discovery from dataset:
Data Cleaning: The noise and inconsistent is eliminated.
Data Integration: More than one information assets are blended.
Data Selection: Fact applicable to the analysis are retrieved from the dataset.
Data Transformation: Information is converted or consolidated into from suitable for mining by means of appearing praises or aggregation operation data mining.
Data Mining: Smart techniques are applied so one can extract fact patterns Pattern Evaluation: Information styles are evaluated.
Knowledge Presentation: Knowledge representation steps the following diagram shows of knowledge discovery.
3.4.3 Data pre-processing:
I have selected the Training dataset on the basis of the quality of the data. I found different types of comments. Some of the comments were in Bangla but written with the English Word which are meaningful like "valo hoy mama","bojaya diley parmu".
Generally, I try to avoid this type of data which creates confusion to the analysis. So, in my dataset, I tried to modify this type of data into English comment.
Describe Figure 3.4.2- KDD process [4] is used here for basic preprocessing
Figure 3.4.2: KDD process for basic preprocessing
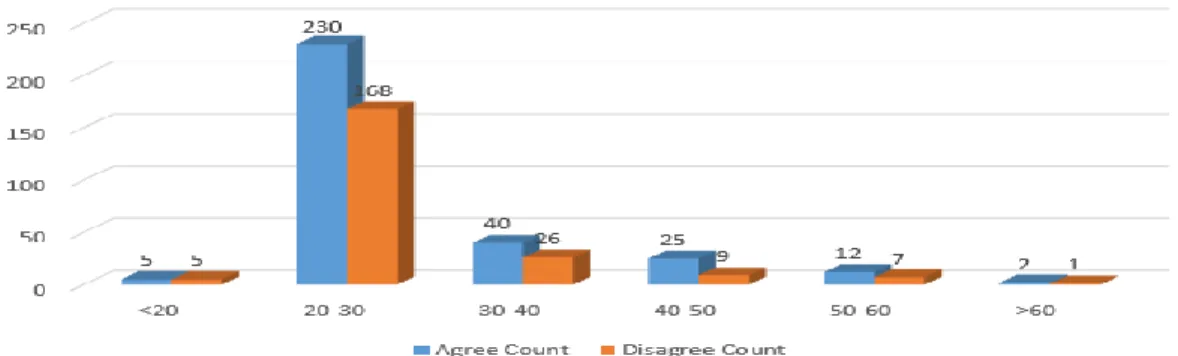
3.4.4 Data Analysis:
For this my research purpose, I have taken data different type of people and different type age and different type of occupation. In this feasibility research, I have able to find out agree or disagree according to age.
Figure 3.4.4.1: Average Agree or Disagree according to age
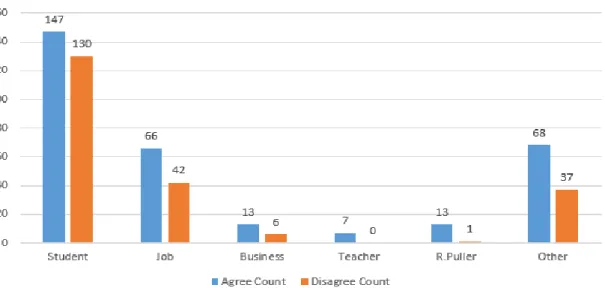
12 I have also able to find agree or disagree according to occupation and comments. From this I can easily find out this feasibility research goal is possible or not possible.
Figure 3.4.4.2: Agree or Disagree According to Occupation
Different people give different opinion about using APP base transportation system in rickshaw. Agree or disagree according their comments or remarks is given below:
Figure 3.4.4.3: Pie Chart Percentage of comments or remarks.
After little raining, roads of Dhaka goes under water. That time most of vehicle become useless. Feasibility of vehicle effectiveness when roads go under water.
Figure 3.4.4.4: Vehicle effectiveness when roads go under water.
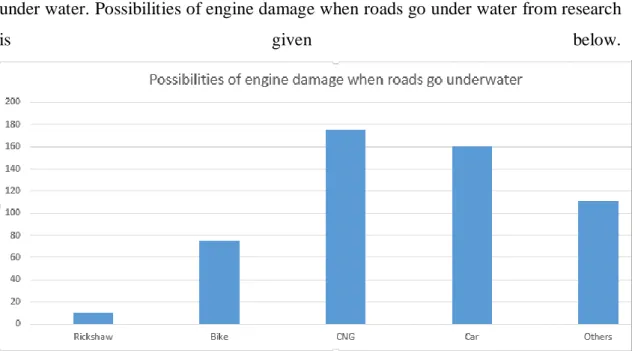
It is high risk of possibility of engine damage, if you drive your vesicles when roads go under water. Possibilities of engine damage when roads go under water from research
is given below.
Figure 3.4.4.5: Possibilities of engine damage when roads go under water.
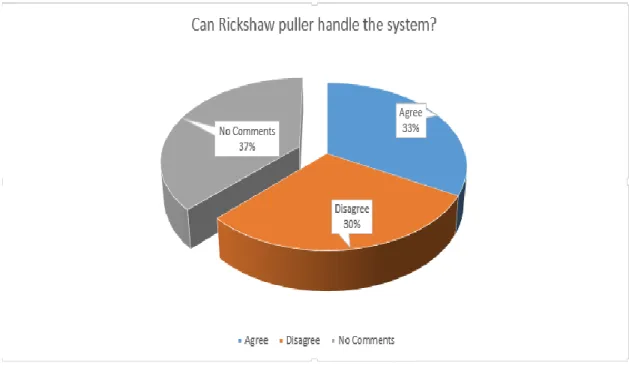
14 Wil Rickshaw puller handle this problem? About this question, I have got different type of answer from the people. Some says that they will able to do and some says they will not able to do. Ratio of their comment is given below:
Figure 3.4.4.6: Can puller handle the system.
We can make this project so easy for them by giving training .We can also make customize device for them so that they can easily use. People review about this is given below:
Figure 3.4.4.7: How to make them suitable for the system.
3.4.5 Remarks or comments
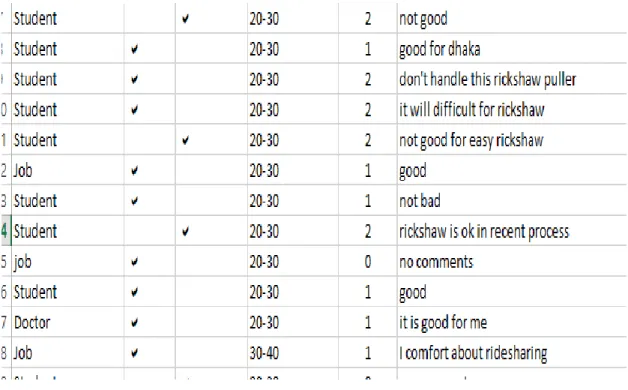
Table 3.4.5: Shows the feature position of top ten reviews
3.4.6 Sentiment Analysis Procedure
Sentiment analysis is the automated process that uses AI to identify positive, negative and neutral opinions from text. Sentiment analysis is widely used for getting insights from social media comments, survey responses, and product reviews, and making data- driven decisions [8].
There are many methods and algorithms to implement sentiment analysis systems, which can be classified as:
1. Rule-based systems that perform sentiment analysis based on a set of manually crafted rules.
2. Automatic systems that rely on machine learning techniques to learn from data.
3. Hybrid systems that combine both rule based and automatic approaches.
16
Rule-based Approaches
Usually rule-based approaches define a set of rules in some kind of scripting language that identify subjectivity, polarity, or the subject of an opinion.
The rules may use a variety of inputs, such as the following:
•Classic NLP techniques like stemming, tokenization, part of speech tagging and parsing.
•Other resources, such as lexicons (i.e. lists of words and expressions).
A basic example of a rule-based implementation would be the following:
1. Define two lists of polarized words (e.g. negative words such as bad, worst, ugly, etc and positive words such as good, best, beautiful, etc).
2. Given a text:
i. Count the number of positive words that appear in the text.
ii. Count the number of negative words that appear in the text.
If the number of positive word appearances is greater than the number of negative word appearances return a positive sentiment, conversely, return a negative sentiment.
Otherwise, return neutral.
Automatic Approaches
Automatic methods, contrary to rule-based systems, don't rely on manually crafted rules, but on machine learning techniques. The sentiment analysis task is usually modeled as a classification problem where a classifier is fed with a text and returns the corresponding category, e.g. positive, negative, or neutral (in case polarity analysis is being performed).
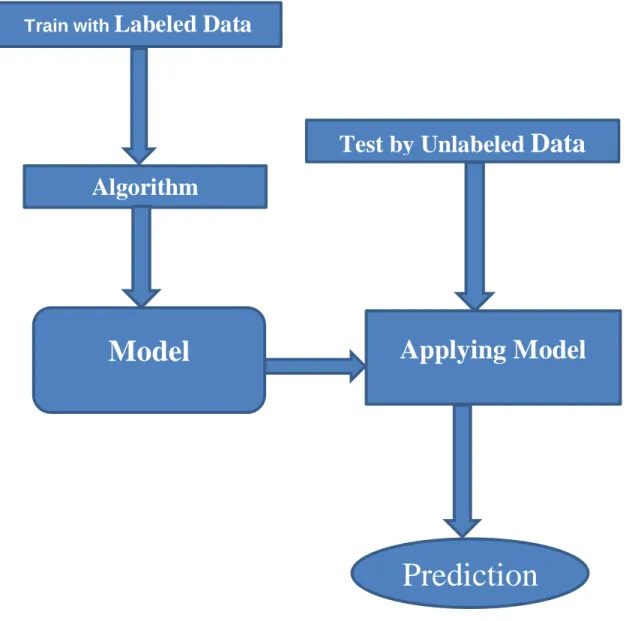
Machine learning is about learning from the structure of data. Two main categories of machine learning algorithms are Supervised and Unsupervised. In this paper, two popular supervised machine learning algorithms were used for sentiment analysis. A general supervised machine learning approach for Sentiment Analysis is shown in figure 1. Supervised machine learning algorithms will be provided with labelled data
as a training set. The algorithm learns and outputs a trained model. Effectiveness of this model will be evaluated on the unseen data i.e., the unlabeled data set.
Figure 3.4.6.1: Supervised Machine Learning process.
Sentiment analysis or Review (Text) analysis is a supervised learning task [10], which means that each training document or text will have a class label. In feature extraction, a sentence or document is broken into words to build up the feature matrix. In the matrix, each sentence or document is a row and each word form a feature as a column, and the value is the frequency count of the word in the sentence or document. Feature matrix is then passed to each classifier and their performance is evaluated. The control flow of the system proposed in this paper is shown in figure 2. DT classifies data into different classes by recursively separating the feature space into two parts and assigning different classes based upon which region in the divided space a sentence is, based on
Train with
Labeled Data
ining with Labeled Data
Algorithm
Model Applying Model
Test by Unlabeled Data
Algorithm led Data
Prediction
18 its features. The SVM classifies data by maximizing the margin between the support vectors, which are the boundary for the classification.
Figure 3.4.6.2: Control flow of the process
3.4.7. Datasets
I have found out Sentiment Analysis after finding feasibility analysis. To find the Sentiment Analysis, I have taken public reviews from my survey of FA datasheet. Then I trained the dataset the output other dataset sentiments are-Randomly split reviews into 2 parts (75% and 25%). It was a “Survey Data Set” which consists of 531 REVIEWSs of positive and negative category. All samples were chosen. The training and test data consists of 75% samples. Three fold cross validation was used to evaluate the performance of the classifiers.
3.4.8. Implementation Requirements
I have applied some algorithms. They are Naïve Bayes algorithm, Logistic Regression, SVM, Confusion Matrix.
3.4.8.1 Naive Bayes Algorithm
Naive Bayes algorithm is an arrangement of directed learning calculations dependent on applying Bayes‟ hypothesis with the naive presumption of freedom between each match of highlights. Execution have been assessed utilizing holdout approach (75% - preparing, 25%- testing). This theorem will predict the result.
Text Feature
Evaluation
DT
SVM
The Naive Bayes (NB) algorithm is an arrangement strategy dependent on Bayes' theorem with the presumption that all highlights are free of one another.
Bayes’ theorem is represented by the following equation:
P(A|B) =P(A|B)P(B) /P(A) (1) Where A and B are features
● P(B|A) is the probability of B given A.
● P(A|B) is the probability of A given B.
● P(B) is the prior probability of B.
● P(A) is the prior probability of B.
The NB equation can be written as follows:
P(B|A)=P(a1|B) P(a2|B) …….P(an|B) P(B) (2) Where A = (a1, a2,… an) represents a vector of n features.
Figure 3.4.8.1: Naïve Bayes algorithm process
20 3.4.8.2 SVM
Support vector machine is supervised learning model. SVM uses a subset of training points in the decision function called support vectors, so it is also memory efficient. It is a set of regulated learning techniques utilized for grouping, relapse and exception discovery. It attempts to discover a hyperplane that can viably partition the given preparing information into two sections. The significant preferred standpoint of help vector machines is viability in high dimensional spaces. Additionally it utilizes a subset of preparing focuses in the choice capacity called bolster vectors, so it is likewise memory proficient. The one disadvantage in SVM is when preparing information is profoundly lopsided, coming about model has a tendency to perform well on larger part information however perform terrible on minority information. It executes the multi class grouping utilizing one against one methodology.
3.4.8.3 Confusion Matrix
The Confusion Matrix is obtained by using Confusion Matrix() library function. Using matrix classifies a clear conception about positive negative or neutral values on a data set. It is basically a table that can be generated for a classifier on a binary data set and can be used to describe the performance of the classifier. It shows false True Positive (TP), True Negative (TN), False Positive (FP) and False Negative (FN) Values. It just gives a ratio doing predictive values calculating from data set. Like I have a disease or I never have a disease. Here two types of values occur either he have a disease or he have not. There is a true positive or a false positive answer occur. Accuracy can be measured in parameter and it is calculated by number of correctly predicted reviews divide by total number of reviews present in the corpus.
3.4.8.4 Decision Tree
Decision Tree algorithm belongs to the family of supervised learning algorithms.
Unlike other supervised learning algorithms, decision tree algorithm can be used for solving regression and classification problems too. The general motive of using Decision Tree is to create a training model which can use to predict class or value of target variables by learning decision rules inferred from prior data (training data).The understanding level of Decision Trees algorithm is so easy compared with other classification algorithms. The decision tree algorithm tries to solve the problem, by
using tree representation. Each internal node of the tree corresponds to an attribute, and each leaf node corresponds to a class label.
Figure 3.4.8.4: Output decision tree of the model
22
CHAPTER 4
EXPERIMENTAL RESULTS AND DISCUSSION
4.1 IntroductionFor gaining a good result, my research project depends on analysis and the perfect model. To find Sentiment Analysis, I took the train data and trained the machine. Then I took the test data for test. After that I can input text. For building a model by using data and finding proper result is very necessary. That will predict a project which is doable and not doable.
4.2 Experimental Results
For reaching the expected goal of my analysis, I have used here FA and SA rules. For FA, I took a lot of data from different type of people like student, job, teacher and others. Pie chart for FA according to percentages of agree or disagree is given below:
Figure 4.2.1: Pie chart show the percentage of Agree or Disagree.
After getting the ratio, I have got agree is greater than disagree. It mention that the project is runnable and can go ahead.
For SA, I have used the comments that I have got from different type of people in my datasheet. Then I have used Weka tools for this. WEKA [9], an open source tool is a collection of machine learning algorithm.
Figure 4.2.2: Weka software processing.
24 Figure 4.2.3 presents the screen shot of Weka tool with Decision tree results. By DT percentage of correctly classified instance was 61.39% and 38.60% for incorrectly classified instance.
Figure: 4.2.3 Weka screen shot for Decision Tree results
Decision Tree constructed using train data set is shown in figure 4.2.4
Figure 4.2.4: Decision Tree constructed for the Train Dataset
26 Figure 4.2.5 presents the screen shot of Weka tool with Support Vector Machine results.
By SVM percentage of correctly classified instance obtained was 59.88% and 40.11%
for incorrectly classified instance.
Figure 4.2.5 Screen shot of Weka tool for support vector
Cross-validation also called rotation estimation, is a way to analyze how a predictive model will perform on an unknown dataset, i.e., how to generalize the model.
According to take Time and accuracy results are shown in table 4.2. From the results it is observed that DT takes less time to build the model. Detailed accuracy results by class are shown in table 2 for different algorithms. From the results it is observed that DT J48 algorithm is most appropriate for this type of analysis because its TP high and FP low, Precision high, Recall and F-Measure is also high.
True Positive (TP): The sentiment is fully positive.
True Negative (TN): The sentiment is slightly positive.
False Positive (FP): The sentiment is slightly negative.
False Negative (FN): The sentiment is fully negative.
Precision: precision is the piece of related instances among the retrieved instances.
High precision means that an algorithm returned substantially more relevant results than irrelevant ones.
𝑃𝑟𝑒𝑐𝑖𝑠𝑖𝑜𝑛 = 𝑇𝑃
𝑇𝑃+𝐹𝑃 *100% (3)
Recall: Recall is the piece of relevant instances that have been retrieved over the total amount of relevant instances. High recall means that an algorithm returned most of the relevant result.
𝑅𝑒𝑐𝑎𝑙𝑙 = 𝑇𝑃
𝑇𝑃+𝑇𝑁 *100% (4)
F-measure: F-measure is a measure of test’s accuracy by considering both precision and recall. It is a harmonic average of precision and recall.
𝐹 − 𝑚𝑒𝑎𝑠𝑢𝑟𝑒 = 2 ∗𝑃𝑟𝑒𝑐𝑖𝑡𝑖𝑜𝑛∗𝑅𝑒𝑐𝑎𝑙𝑙
𝑃𝑟𝑒𝑐𝑖𝑡𝑖𝑜𝑛+𝑅𝑒𝑐𝑎𝑙𝑙∗ 100 % (5)
28 Accuracy: Accuracy refers to the familiarity of the measured value to a known value.
𝐴𝑐𝑐𝑢𝑟𝑎𝑐𝑦 = 𝑇𝑃+𝑇𝑁
𝑇𝑃+𝐹𝑁+𝐹𝑃+𝑇𝑁∗ 100% (6)
False Positive Rate: False positive rate refers that our proposed method predict the textual format is slightly positive. Calculate the false positive rate by the given equation:
𝐹 − 𝑚𝑒𝑎𝑠𝑢𝑟𝑒 = 2 ∗𝑃𝑟𝑒𝑐𝑖𝑡𝑖𝑜𝑛∗𝑅𝑒𝑐𝑎𝑙𝑙
𝑃𝑟𝑒𝑐𝑖𝑡𝑖𝑜𝑛+𝑅𝑒𝑐𝑎𝑙𝑙∗ 100 % (7)
Table 4.2: Average accuracy of different class in different algorithm
Result of different algorithms
Sr. No Parameters Naïve Bayes
SVM J48 REP
Tree
Random Forest
Decision Stump
Random Tree
1 TP Rate 0.597 0.599 0.614 0.599 0.561 0.608 0.569
2 FP Rate 0.600 0.559 0.513 0.588 0.539 0.549 0.546
3 Precision 0.513 0.560 0.590 0.543 0.534 0.579 0.536
4 Recall 0.597 0.599 0.614 0.599 0.561 0.608 0.569
5 F-Measure 0.471 0.528 0.558 0.488 0.537 0.538 0.536
6 MCC -0.07 0.061 0.115 0.023 0.025 0.090 0.027
7 ROC Area 0.534 0.520 0.519 0.507 0.476 0.517 0.475
8 PRC Area 0.544 0.532 0.535 0.522 0.494 0.533 0.500
4.3 Descriptive Analysis
For measuring the overall performance, I have used data. It’s possible to measure any kinds of prediction and also it can validate the result by using algorithm. To find analysis comment like good or bad is very much necessary.
Table 4.3: Shows the comment text
In this research, I have also shown the percentage of total number of Good, Bad and No comment of remarks. By this, I can easily measurement of the importance of the project.
On the contrary, to find the Sentiment Analysis of my research procedure was 75%
were train data and 25% were test data. I have used some algorithms. The algorithms are SVM, confusion matrix, naive Bayes and decision tree. Naive Bayes Algorithm is a quick, profoundly versatile calculation. Naive Bayes can be used for Binary and Multiclass grouping. I have used this algorithm for prediction of Sentiment Analysis. I have used Confusion matrix. Confusion matrix is a system for outlining the execution of a classification algorithm. Confusion matrix shows that the sentiment is positive, negative, true positive and true negative. I have used the SVM to analyze data for classification and regression analysis. Then I have got prediction.
4.4 Prediction
After preprocessing my data, at first I have found out the feasibility analysis and then made a dataset model by using Naïve Bayes algorithm and it will predict the
sentiment analysis of my comments. Describe figure 4.4.1 finding prediction is shown [1].
30 Figure 4.4: Whole process of finding prediction
CHAPTER 5
CONCLUSION AND FURTHER STUDY
5.1 Summary of the Study
To complete my Research Work, I have studied how the Machine learning techniques are used for getting the solution of various types of machine learning problem. There are two kinds of Machine learning process that is Supervised Machine Learning and Unsupervised Machine learning. This Study make me known that my research is about Supervised Machine learning and it is also a Classification Model Problem.
I have also studied how the FA and SA are used for getting the solution from the various type of data. I studied about prototype, clustering, correlation of data, classification task, classification method, and data testing.
5.2 Conclusion
For the Beginners, Machine Learning is very good research area. In the basis of our Country related work like user’s opinion classify using different type of data. I have tried to establish a model which is able to predict from the collected data. By this, I will take some powerful step in future before starting this project. Basically, I used all the remarks or comments that I was collected from user which has been considering very important for my work. This comments is only that expression what they want this or do not want this. The Pointing things is that all of the data which I have already collected from people with respect of the time that the people want to receive the services where I have considered their comments what they feel about the service if it will make or not.
I tried to describe all the operating techniques, Working procedure, models and also the method with Table and Figure. I have a plan to make this with extra requirements. I have additionally confronted loads hassle to complete this research. There became so noisy facts. All the Procedures have been tremendous in sum so it took a lot of time to understand and put in force this in my studies. For collecting the data from the people,
32 I went with the hassle. I have experienced a few different problem that were in the beginning of my research.
5.3 Recommendations
Though I mention some related work. It was very hard to collect data from people to people. I understand all the research process and work style after that I started to fix my research goal. I took more than five hundred data. After a hard effort by doing all of the work step by step finally, I am at a stage what can be said it is my expected research goal. So, for making this kind of research work it need a tremendous work for guiding us through the right path of research. I have experienced some different problems that was inside the starting of my research. I have also stuck with the mastering of the large field of Data mining and Machine Learning. With the total journey if this research Work my supervisor Mr. Md. Abbas Ali Khan helped me a lot and guided me for making this research project successful.
5.4 Implementation for further study
o Adding more categories in this project, can make this more efficient. Try to implement for business purpose.
o Using more classifiers on this dataset, can get a better understanding on which classifier can be the best for this work.
o After collecting that data, it will be stored in a database. It’s possible to categories all the data. And hope so users will be capable to use these system by using Android Mobile Application.
o Plan to implement this project and make customize device for Rickshaw Puller.
REFERENCES
[1] Dspace.daffodilvarsity.edu.bd, available at <<http://dspace.daffodilvarsity.edu.bd>>, last accessed on 01-11-2019 at 03:02:07 pm
[2] Ijeecs.iaescore.com, available at <<http://ijeecs.iaescore.com>>, last accessed on 01-11-2019 at 03:32:03 pm
[3] En.wikipedia.org, available at <<https://en.wikipedia.org/wiki>> last accessed on 01-11-2019 at 03:32:01 pm
[4] Geeksforgeeks.org, available at <<https://www.geeksforgeeks.org/>> last accessed on 01-11-2019 at 03:48:09 pm
[5] Marsdd.com, available at <<https:// https://www.marsdd.com />> last accessed on 01-11-2019 at 03:52:06 pm
[6] Thedailystar.net, available at <<https://www.thedailystar.net/lifestyle/uber-grows-dhaka- 1405597>> last accessed on 01-11-2019 at 03:58:06 pm
[7] Dspace.daffodilvarsity.edu.bd/, available at<<http://dspace.daffodilvarsity.edu.bd>>, last accessed on 30-11-2019 at 05:26:06 pm
[8] Monkeylearn.com, available at<<https://monkeylearn.com/sentiment-analysis/>> last accessed on 30-11-2019 at 05:29:06 pm
[9] Umadevi V, “Sentiment Analysis Using Weka”,International Journal of Engineering Trends and Technology (IJETT) – Volume 18 Number 4 – Dec 2014
[10] Sarah Alhumoud, Tarfa Albuhairi and Mawaheb Altuwaijri, “Arabic Sentiment Analysis using WEKA a Hybrid Learning Approach”,IEEE Transl. J. Magn. Japan, 1 August 2016.
34 PLAGARISM REPORT