BREAST CANCER PREDICTION USING MACHINE LEARNING ALGORITHMS BASED ON WISCONSIN BREAST CANCER DATASET
BY
MD. SAZITH SHYONTON ID: 172-15-9843
AND MOUMITA PAUL
ID: 172-15-9850
This Report Presented in Partial Fulfillment of the Requirements for the Degree of Bachelor of Science in Computer Science and Engineering
Supervised By
Mr. Md. Azizul Hakim Sr. Lecturer
Department of CSE
Daffodil International University
Co-Supervised By
Ms. Nusrat Jahan Sr. Lecturer Department of CSE
Daffodil International University
DAFFODIL INTERNATIONAL UNIVERSITY
DHAKA, BANGLADESH
JANUARY 2022
©Daffodil International University ii
APPROVAL
This Project titled “BREAST CANCER PREDICTION USING MACHINE LEARNING ALGORITHMS BASED ON WISCONSIN BREAST CANCER DATASET”, submitted by MD. SAZITH SHYONTON and MOUMITA PAUL to the Department of Computer Science and Engineering, Daffodil International University, has been accepted as satisfactory for the partial fulfillment of the requirements for the degree of B.Sc. in Computer Science and Engineering and approved as to its style and contents.
The presentation has been held on 5 January 2021.
BOARD OF EXAMINERS
Dr. Sheak Rashed Haider Noori (SRH) Chairman Associate Professor and Associate Head
Department of CSE
Faculty of Science & Information Technology Daffodil International University
Md. Tarek Habib (MTH) Internal Examiner
Assistant Professor Department of CSE
Faculty of Science & Information Technology Daffodil International University
Md. Reduanul Haque (MRH) Internal Examiner
Assistant Professor Department of CSE
Faculty of Science & Information Technology Daffodil International University
©Daffodil International University iii Dr. Mohammad Shorif Uddin External Examiner Professor
Department of Computer Science and Engineering
Jahangirnagar University
©Daffodil International University iv
DECLARATION
We hereby declare that, this project has been done by us under the supervision of Mr. Md.
Azizul Hakim, Sr. Lecturer, Department of CSE Daffodil International University. We also declare that neither this project nor any part of this project has been submitted elsewhere for award of any degree or diploma.
Supervised by:
Mr. Md. Azizul Hakim Sr. Lecturer
Department of CSE
Daffodil International University Co-Supervised by:
Ms. Nusrat Jahan Sr. Lecturer
Department of CSE
Daffodil International University Submitted by:
Md. Sazith Shyonton ID: -172-15-9843 Department of CSE
Daffodil International University
Moumita Paul ID: -172-15-9850 Department of CSE
Daffodil International University
©Daffodil International University v
ACKNOWLEDGEMENT
First we express our heartiest thanks and gratefulness to almighty God for His divine blessing makes us possible to complete the final year project/internship successfully.
We really grateful and wish our profound our indebtedness to Mr. Md. Azizul Hakim, Sr.
Lecturer, Department of CSE Daffodil International University, Dhaka. Deep Knowledge
& keen interest of our supervisor in the field of “Machine Learning” to carry out this project. His endless patience ,scholarly guidance ,continual encouragement , constant and energetic supervision, constructive criticism , valuable advice ,reading many inferior draft and correcting them at all stage have made it possible to complete this project.
We would like to express our heartiest gratitude to Dr. Touhid Bhuiyan, Professor and Head, Department of CSE, for his kind help to finish our project and also to other faculty member and the staff of CSE department of Daffodil International University.
We would like to thank our entire course mate in Daffodil International University, who took part in this discuss while completing the course work.
Finally, we must acknowledge with due respect the constant support and patients of our parents.
©Daffodil International University vi
ABSTRACT
Cancer is deadly disease which is caused due to uncontrolled growth of the cells and forms from the extra mass tissue known as tumor. There are over 200 types of cancer. Breast cancer represents one of the diseases that make a high number of deaths every year. It is the most common type of all Cancers. Breast cancer is the second leading cause of cancer death in women. The chance that a woman will die from breast cancer is about 1 in 39 (about 2.6%) [1]. In 2020, there were 2.3 million women diagnosed with breast cancer and 685 000 deaths globally [2]. When detected in its early stages, there is a 30% chance that the cancer can be treated effectively, but the late detection of advanced-stage tumors makes the treatment more difficult [3,4]. By using Machine Learning we have built a model which can predict the possibility of having breast cancer. The model that we have built was trained by Wisconsin Breast Cancer dataset (WDBC) for breast cancer diagnosis prediction. On experiment, these data were processed and analyzed by various data pre-processing techniques. Then Some classic Machine Learning algorithms like Naive Bayes, Random Forest, Logistic Regression, K-Nearest Neighbors, Support Vector Machine (SVM), Decision Tree and Neural Network were used for building the model and the performance of each of them was measured using metrics like prediction accuracy on the testing and training data, Precision, Recall, F1 score and Support. Overall Support Vector Machine (SVM) performed better than others. So, the Support Vector Machine model was chosen for the prediction of the disease.
©Daffodil International University vii
TABLE OF CONTENTS
CONTENTS PAGE
Board of examiners ii-iii
Declaration iv
Acknowledgements v
Abstract vi
CHAPTER
CHAPTER 1: INTRODUCTION
1-61.1 Introduction 1-2
1.2 Motivation 2
1.3 Research Questions 2-3
1.4 Expected Output 3
1.5 Project Management and Finance 3
1.6 Report Layout 3-4
CHAPTER 2: BACKGROUND
2.1 Preliminaries/Terminologies 5-6
2.2 Related Works 6-7
©Daffodil International University viii
2.3Comparative Analysis and Summary 7-8
2.4 Scope of the Problem 8
2.5 Challenges 8
CHAPTER 3: RESEARCH METHODOLOGY
3.1 Research Subject and Instrumentation 9
3.2 Data Collection Procedure/Dataset Utilized 9-10
3.3 Statistical Analysis 10-11
3.4 Proposed Methodology/Applied Mechanism 11-12
3.5 Implementation Requirements 12-13
CHAPTER 4: EXPERIMENTAL RESULTS AND DISCUSSION
4.1 Experimental Setup 14-26
4.2 Experimental Results & Analysis 26-27
4.3 Comparative Analysis 27-28
4.4 Discussion 28
CHAPTER 5: IMPACT ON SOCIETY, ENVIRONMENT AND SUSTAINABILITY
5.1 Impact on Society 29
©Daffodil International University ix
5.3 Ethical Aspects 29
5.4 Sustainability Plan 29
CHAPTER 6: CONCLUSION
6.1 Summary of the Study 30
6.2 Conclusions 30
6.3 Implication for Further Study 30-31
APPENDIX
REFERENCES
32-33©Daffodil International University x
LIST OF FIGURES
FIGURES PAGE NO
Figure 3.3.1: Correlation Matrix 11
Figure 3.4: Proposed Methodology 12
Figure 4.1.2.1: Working Principle of Random Forest. 16
Figure 4.1.3: Sigmoid Function Graph 18
Figure 4.1.3.1: Confusion Matrix of Logistic Regression 19
Figure 4.1.4.1: Euclidean Distance 20
Figure 4.1.4.2: Confusion Matrix of KNN Model 21
Figure 4.1.6.1: Working Process of Decision Tree 23
©Daffodil International University xi
LIST OF TABLES
TABLES PAGE NO
Table 3.2: DATASET ATTRIBUTE AND VALUE TYPE of WDBC 10
Table 4.1.1.2: Performance of Naïve Bayes Model 15
Table 4.1.2.2: Performance of Random Forest Model 16
Table 4.1.3.1: Performance of Logistic Regression Model 18 Table 4.1.4.2: Performance of K-Nearest Neighbors Model 21 Table 4.1.5.1: Performance of Support Vector Machine Model 22
Table 4.1.6.2: Performance of Decision Tree 23
Table 4.1.7.2: Performance of Neural Networks 24
Table 4.2.1: Performance of Algorithm on Testing Data 26-27 Table 4.2.2 : Performance of Algorithm on Training Data 27
Table 4.3.1: Comparative Table 28
©Daffodil International University 1
CHAPTER 1 INTRODUCTION
1.1 INTRODUCTION
Cancer is indeed the leading cause of death worldwide. Cancer occurs when cells in the body begin to proliferate convulsing. Cells in nearly any part of the body can develop into cancer, which can then spread to other parts of the human body. Cancer of the breast is the second most common cancer in women, after skin cancer. Almost every country in the world has breast cancer among women after puberty, but the prevalence of this disease increases with age. Breast cancer is currently the world's most common cancer. As of the end of 2020, there were 7.8 million women alive who had been diagnosed with breast cancer in the previous five years, making it the most common cancer in the world. The American Cancer Society's projections for breast cancer in the United States in 2021 are as follows: There will be approximately 281,550 new cases of invasive breast cancer diagnosed in women, and approximately 43,600 women will die from breast cancer. Breast cancer is still the most common and deadly cancer among women in Bangladesh. It has become a hidden burden, accounting for 69 percent of women's deaths. The incidence rate of breast cancer in Bangladesh was approximately 22.5 per 100,000 females. Breast cancer has been reported to have the highest prevalence rate (19.3 per 100,000) among Bangladeshi women aged 15 to 44. Most breast cancers allocate in one to two months, so by the time you acknowledge a cancerous lump, the cancer has been in your body for two to five years. As a logical consequence, this is not a disease that we can afford to overlook.
This is where Machine Learning comes useful. We are living in the age of data. But data is only useful when we process and put them into work. Machine learning does this exact same thing. A component of the framework of Artificial Intelligence is machine learning that performs based on training and experience without any human intervention. The use of Machine Learning in healthcare is very promising and effective [5]. So, if we can process the previous data of breast cancer patients and apply Machine Learning to them then our machine can predict whether a person will have breast cancer or not in the future which may save the life of that person and the lives of countless others as well. People don’t
©Daffodil International University 2 usually notice early breast cancer symptoms because they resemble symptoms of other health problems. So, detection is a crucial step to consider in terms of health prospects.
This is why we thought to build a Machine Learning based model that can take data from user and make a prediction whether the user has a possibility of having breast cancer or not. Breast cancer at a young or old age is very much unfortunate although not unusual. So doing something about breast cancer is definitely a logical thing to do and early detection of this disease is the first step we can take and Machine Learning is the cornerstone of this detection. The goal of this study is to create a Machine Learning model that can predict the likelihood of breast cancer.
1.2 MOTIVATION
The World Health Organization estimates that there will be 2.3 million cases of breast cancer and 685 000 deaths in 2020. In Bangladesh, 22.3 per 100000 females of all ages suffered from breast cancer. Ages between 15 to 44 years, the rates increase, estimated to be 19.3 per 100000.Untreated breast cancer can lead us anxiety, depression. Bangladesh is a developing country. The cost we need to bear for treatment of breast cancer in Dhaka is about 6.5 lakh BDT, which is increasing day by day. But the majority of our population lives under the poverty line. So, detection is a crucial step to consider in terms of both health and economic prospects. This is the reason why we thought to make a Machine Learning based model which can predict whether the patient has a possibility of having breast cancer or not. Breast cancer at any age is very much unfortunate although not unusual. So, doing something about this disease is definitely a logical thing to do and early detection using Machine Learning is the very first step we can take. And as we are Machine Learning researchers, it’s motivated us to do this research.
1.3 RESEARCH QUESTIONS
“Using the Wisconsin Breast Cancer Original dataset, how can we predict breast cancer so that patient can take proper precautions within time and lead a better life?” that’s the sole question of this research and the answer we have got as a computer science student is by Machine Learning.
©Daffodil International University 3
1.4 EXPECTED OUTPUT
We pre-process the data after collecting it. Then we'll use the algorithm we've chosen. One or two of the applicable algorithms may provide the best results for predicting Breast Cancer.
1.5 PROJECT MANAGEMENT AND FINANCE
This is our initiation of a project into the subject. That's why deciding which dataset to use and how to proceed was so difficult for us. Our supervisor's modest mentorship is greatly appreciated. We gathered data from the UCI Machine Learning Repository and completed the study flawlessly under the supervision of our supervisor. As for the data, it was gathered via the internet, as was other study material. We are completing the project at no cost to anyone.
1.6 REPORT LAYOUT
i. We talked about our research in Chapter 1. This section contains a quick introduction to the project as well as our motivation for undertaking it. There is also information on what the major motivation is and how to handle our research effort.
ii. We examined the research's basis in Chapter 2. This section also includes an overview of the results of other research publications as well as a comparison of those research efforts. You can also learn about the scope of the problem and the difficulties we encountered while doing the research.
iii. We spoke about our research methods in Chapter 3. This chapter covers which instruments are required for the study, how we obtained data, statistical analysis of the dataset, and proposed approach.
©Daffodil International University 4 iv. In Chapter 4, we examined the algorithms utilized in this study, how they were
applied, and how the algorithms' results were summarized.
v. In Chapter 5, we explored the project's social impact and long-term viability.
vi. Finally, in Chapter 6, we wrap up our research and reach a conclusion.
©Daffodil International University 5
CHAPTER 2 BACKGROUND
2.1 TERMINOLOGIES
2.1.1. BREAST CANCER
Breast cancer is a disease in which the cells in the breast grow rapidly and uncontrollably.
It is determined by the cells in the breast that develop into cancer. Breast cancer actually begins in various parts of the breast. A breast is divided into three sections. The lobules, ducts, and connective tissue are examples of these structures. Breast cancers usually start in the ducts of the lobules.
Breast cancer can spread outside the breast via blood and lymph vessels. It's widely recognized as metastasized. The most common types of breast cancer are:
1. Invasive ductal carcinoma: It’s begun in the ducts and then grow and spread beyond the ducts into other areas of the breast
2.Invasive lobular carcinoma: The above cancer cell begins in the lobules and accumulates to nearby breast tissues. The most dangerous aspect is that it can spread to other parts of the body.
After skin cancer, breast cancer is the second most common cancer in women. Breast cancer affects almost entirely women in the majority of cases, but men can get it as well.
It refers to a malignant tumor that has arisen from breast cells. But the main fact we felt or x-ray scan shown the breast tumor as a lump. Most of the breast lumps are benign and malignant (not-cancer).
©Daffodil International University 6
2.1.2. ARTIFICIAL INTELLIGENCE
The ability of a machine or computer to learn is referred to as artificial intelligence (AI) from example and experience to imitate the capabilities of the human mind. The main goal of Artificial Intelligence is to make a computer which can automatically learn, plan and solve problem. Though we tried to more than a half century, AI still hasn’t shown us that much progress. We are still unable to make the computer as intelligent as human being.
But in recent year Artificial Intelligence shown us a great potential. And the used of AI is increasing day by day.
2.1.3. MACHINE LEARNING
Machine Learning is an application or branch of Artificial Intelligence, furthermore renowned as AI. The principle of Machine Learning is by which a computer can learn from previous data, recognizing patterns and able to make proper decision with no help from human. Machine Learning derived from the combination of computational statistics and data science.
The use of Machine Learning on ML in health care is very promising and effective [5].
However, there are many different types of Machine Learning Algorithms, they can be classified into three categories.
1. Supervised Learning: In this algorithm, the model trained on a labelled dataset or the dataset which have both input output parameters. There are numerous supervised learning algorithms, including Linear Regression, Nave Bayes, Decision Trees, and others.
2. Unsupervised Learning: In Unsupervised Learning, the model learns how to categorize data that is provided without output parameters. K-Means Clustering is an example of an unsupervised learning algorithm.
©Daffodil International University 7 3. Reinforcement Learning: In this algorithm we use a agent. By using his own behaviors and experiences, the agent learns in an interactive environment which is input on it.
2.2 RELATED WORKS
Following is the summary of some related research works that were relevant and useful for our research.
Hiba Asri et al. [6] have worked on Wisconsin Breast Cancer (Original) dataset and applied support vector machine (SVM), Decision Tree (C4.5), Naïve Bayes (NB) and K - Nearest Neighbours (K-NN) for predicting Breast Cancer. They have done a good amount of data pre- processing. Among those mentioned algorithms, The support vector machine (SVM) provided the highest accuracy while having the lowest error rate.
So, they have managed to achieve a good prediction accuracy. But there a lot algorithm left which might give us a lot better accuracy than this. That’s why we looked for other works that have achieve much better accuracy.
Md. Toukir Ahmed et al.[7] applied Naïve Bayes, Support vector machine (SVM), Multilayer perception (MLP), J48 and Random Forest on Wisconsin breast cancer dataset for predicting breast cancer. For comparing the result they used performance metrics, Accuracy, Kappa statistic, precision, recall, F-measure, MCC, ROC area. Among them Naïve Bayes gave the best result. We kept looking for others.
Borges et.al.[8] analysis the Wisconsin Breast cancer dataset using Machine learning for breast cancer detection. In this process they used only two algorithms. That’s are the Bayesian Networks algorithm and J48. Among them the Bayesian Networks algorithm achieved the best accuracy.
Vikas Chaurasia el al. [9] also worked in Wisconsin breast cancer dataset. They used only three algorithms which were the Naïve Bayes, RBF Networks and J48. Among this three
©Daffodil International University 8 algorithms Naïve Bayes was the best predictor. This four-research paper achieved an outstanding prediction accuracy. But there are still a lot of algorithms left to test. So this is the area and topic we picked up for this research.
2.3 COMPARATIVE ANALYSIS AND SUMMARY
We were unable to perform study in a specific area because we obtained our data from an internet resource, the UCI Machine Learning repository. We've categorized all of the research papers we've looked at into one category. The entire study was based on the Wisconsin Breast Cancer dataset. This dataset has been the subject of a lot of research.
However, there is a lot of opportunity for development. Many algorithms that could produce substantially better results were not used in the test. That is why I chose the finest algorithm that might provide us with the greatest results. This is where I believe my research will be useful.
2.4 SCOPE OF THE PROBLEM
After reviewing all the above research paper we can understand that breast cancer prediction and detection with Machine learning is one of the most sought after research topic. We can also understand that there a lot of path still left we can improve. We believe that there is still a lot more room for research on this topic, we can move forward.
2.5 CHALLENGES
The most difficult aspect of the project was gathering data on breast cancer patients. We couldn't gather data personally because to the COVID-19 epidemic, and if we did, we'd have to conduct the survey while taking a lot of health risks. Our supervisor, on the other hand, was gracious enough to provide us with the opportunity to use an online dataset.
However, there are numerous and diverse datasets on Breast Cancer. It was a little more difficult to get the right and suitable dataset because this was our first research on Breast Cancer and we didn't know much about it. However, with the assistance of our supervisor, we were able to overcome this obstacle.
©Daffodil International University 9
CHAPTER 3
RESEARCH METHODOLOGY
3.1 RESEARCH SUBJECT AND INSTRUMENTATION
We are doing this research on the previous data of breast cancer. We collected this data from online. For analyzing and to create model, we used python as the programming language and Google Colab and Jupyter Notebook as the programming environment.
3.2 DATA COLLECTION PROCEDURE
We obtained information from the UCI Machine Learning Repository [10]. It is called the Wisconsin breast cancer (Original) dataset [11]. This dataset is available for everyone for research [12]. The total number of records in this dataset is 684. There are 11 attributes.
The first attribute is id number which is not needed for research work. That’s why we removed it from dataset. For representing the class value we used the number 10 which have two value 2 and 4. Where 2 represent bening and 4 represent maligant. All the rest attributes are ranged from 1 to 10.
©Daffodil International University 10 Table 3.2: DATASET ATTRIBUTE AND VALUE TYPE of WDBC
Attribute Value Clump-thickness 1-10 Uniformity-cell-size 1-10 Uniformity-cell-shape 1-10 Marginal-Adhesion 1-10 Single-Epithelial-cell-size 1-10 Bare Nucleoli 1-10 Bland-Chromatin 1-10 Normal-Nucleoli 1-10
Mitoses 1-10
Class 2 for bening, 4 for malignant
3.3 STATISTICAL ANALYSIS
3.3.1 DATA PRE-PROCESSING
I. The first thing I did during the data pre-processing phase was check for null values..
One of the most significant roadblocks to building a good model is null values.
There are numerous options for resolving this issue. One of them is to take the mean value of the null-valued feature. However, there are no null values in the dataset I have.
II. I tested whether or not my dataset was imbalanced in the following step of data pre- processing. An imbalanced dataset is one with a large margin of unequal target class distribution.
III. Finding correlations between the target feature and the independent features is critical for data pre-processing and, in the long run, prediction accuracy. It's also crucial for comprehending the dataset's features.
©Daffodil International University 11 Figure 3.3.1: Correlation Matrix
3.4 PROPOSED METHODOLOGY
Below is a description of our methodology:
1.At first, we collected the from UCI Machine Learning Repository.
2.Then we make the dataset suitable for applied the algorithms.
3.Then we applied different Machine Learning Algorithm that we have mention later.
4.We separately measure the accuracy of each of the algorithm
©Daffodil International University 12 Figure 3.4: Proposed Methodology
3.5 IMPLEMENTATION REQUIREMENTS 3.5.1. PYTHON
Python is a popular programming language now-a-day. Python is an interpretable, object- oriented, dynamically semantic, high level programming language. In the present world python is used everywhere. Guido van Rossum first released python in 1991. It supports multiple programming paradigms. In presents days, researchers and engineers solely choose and used python for Artificial Intelligence and Machine Learning. We also used python for our research project.
3.5.2 JUPYTER NOTEBOOK
The Jupyter Notebook has substituted the IPython Notebook. It is an interactive software platform in which code execution, rich text, mathematics, graphs, and rich media can all be combined. Jupyter Notebook is a type of web application that is developed for Machine Learning and Data Science tasks. It was utilized by researchers all over the world for machine learning, data analysis, data visualization, statistical analysis, and other purposes,
©Daffodil International University 13 either directly or indirectly. The majority of the experiments I conducted for this study were done in Jupyter Notebook.
3.5.3 GOOGLE COLAB
For conducting research product, Google created the Google Colab or Collaboratory. The amazing thing about it is that it allows us to write and execute arbitrary Python code directly from the browser. We can also use the great computing resources from Google, like as GPUS and TPUS without any cost. Moreover, we don’t need to go through any types of setup or tedious process for installing Python packages. We can use it any time whenever we want.
©Daffodil International University 14
CHAPTER 4
EXPERIMENTAL RESULTS AND DISCUSSION
4.1 EXPERIMENTAL SETUP 4.1.1 NAIVE BAYES
The Bayes Theorem is the foundation of the Nave Bayes algorithm, which is a probabilistic machine learning algorithm. It is used in a wide range of classification tasks as well as the supervised learning principle. It is commonly used for classification types problems. It can predict by calculating an object's probability. Furthermore, it is a family of algorithms that all share a common principle, namely that every pair of features being classified is independent of each other. As the principle of Naïve Bayes derived from Bayes Theorem, so a brief introduction to it is necessary. The Bayes theorem uses conditional probability principle. It is used to calculate the likelihood of a hypothesis. The formula for Bayes theorem is as following: -
P(A/B) = (𝑃(𝐵 ∩ 𝐴) 𝑃(𝐴))/(𝑝(𝐵)) P(B/A) = (𝑃(𝐵 ∩ 𝐴) 𝑃(𝐴))/(𝑝(𝐴))
Where,
P(A/B) = Posterion Probability P(B/A) = Likelihood Probability P(A) = Prior Probability
P(B) = Marginal Probability
Now, the working principle of Naïve Bayes can be describe by the following
4.1.1.1 ALGORITHM:
Step1: Converting the dataset into frequency table.
Step2: Find the probabilities of given features.
©Daffodil International University 15 Step3: Use Bayes Theorem principle.
Step4: Calculate the posterior probability.
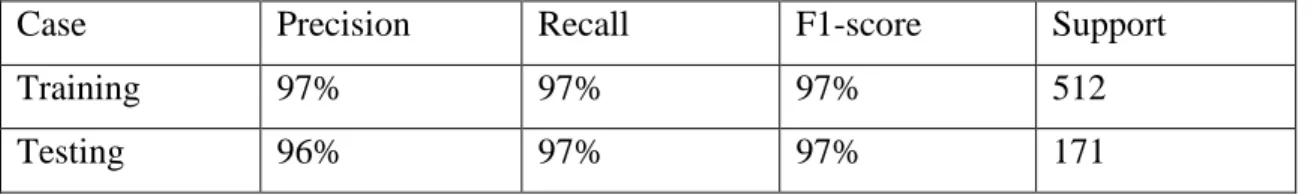
4.1.1.2 RESULT:
The result I got from doing Naïve Bayes is given below
Table 4.1.1.2: Performance of Naïve Bayes Model
Case Precision Recall F1-score Support
Training 97% 97% 97% 512
Testing 96% 97% 97% 171
Prediction result come 97%
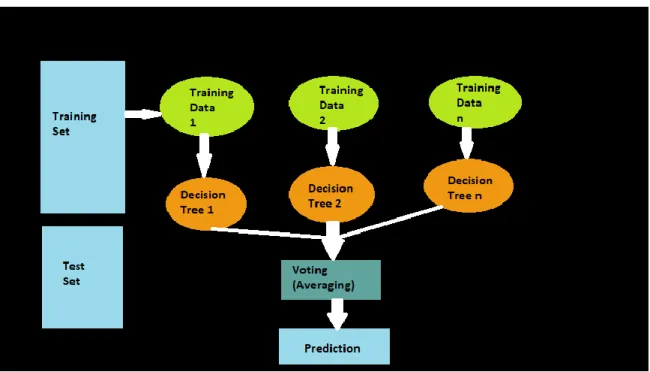
4.1.2 RANDOM FOREST:
A random forest is a classification algorithm made up of many decision trees. In Machine Learning, we can use it for both classification and regression problems. Random forest uses the supervised learning principle. Random forest also uses Ensemble Learning technique.
We use Ensemble Learning method for boosting predictive performance. Ensemble Learning method uses multiple learning algorithm for boosting predictive performance.
Thats the reason Random Forest able to create multiple decision trees on the samples of data. The Random Forest collects the prediction result from each of them separately. Then depends on the majority number of votes of prediction. It delivers the final output of prediction. We can also describe the process which Random Forest follow in another way.
Random Forest primarily operates in two stages. The first phase involves constructing the random forest by combining N decision trees, and the second involves making predictions for each tree. Which is the result of the first phase. The Random Forest mechanism is as follows:
4.1.2.1 ALGORITHM
Step1: Choose n samples randomly.
Step2: Give a decision tree.
©Daffodil International University 16 Step3: Select the feature randomly.
Step4: Split the node.
Step5: Repeat step 1 to 4 k times.
Step6: Tree provides majority votes.
Step7: Make prediction depend on step 6.
The working Principle of Random Forest is illustrated in the following figure :
Figure 4.1.2.1: Working Principle of Random Forest.
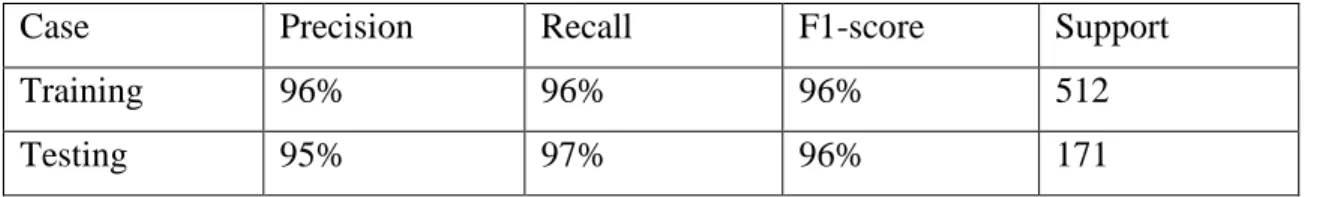
4.1.2.2 RESULT
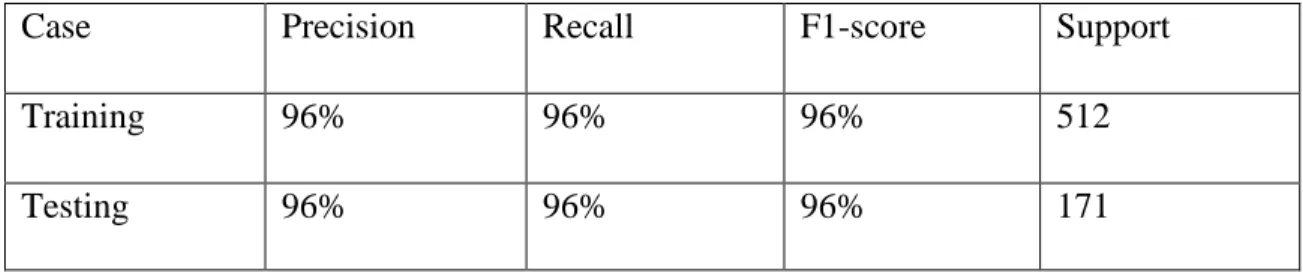
:Table 4.1.2.2: Performance of Random Forest Model
Case Precision Recall F1-score Support
Training 96% 96% 96% 512
Testing 95% 97% 96% 171
4.1.3 LOGISTIC REGRESSION
©Daffodil International University 17 Logistic Regression is one of the most widely used Machine Learning algorithms. This technique was adapted from the field of statistics by machine learning. Logistic Regression is a supervised learning technique. With a given set of independent variables, Logistic Regression can predict the categorical dependent variable. This means that there are only two possible classes. We must obtain a categorical or discrete value as a result. Yes or No, 0 or 1, True or False, and so on. However, it does not give the exact values of 0 and 1, but rather the probabilistic values between 0 and 1. We can see that Logistic Regression is similar to Linear Regression. The main distinction between them is how they are used.
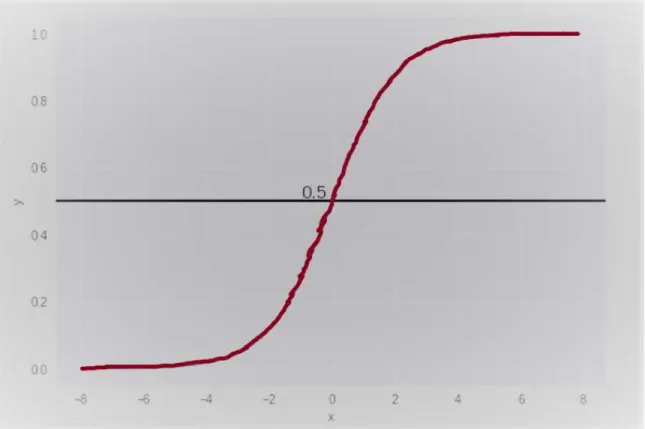
Logistic Regression is used to solve classification problems. Logistic Regression uses a sigmoid curve to classify data, which is calculated using a cost function. Logistic Regression performs classification using a sigmoid curve, which is calculated by a cost function known as the "Sigmoid Function." The logistic regression hypothesis can be stated as follows:
𝟎 ≤ 𝒉𝜽 ≤ 𝟏
where The cost function should be constrained to values between 0 and 1.
The sigmoid function formula can be expressed as, 𝒇(𝒙) = 𝟏
𝟏 + 𝒆−𝒙 and the formula of logistic regression is as follows:
𝒉𝜽(𝑿) = 𝟏
𝟏 + 𝒆𝒓−(𝜷𝟏+𝜷𝟎𝑿) Where,
Β1+β0X is Linear equation.
©Daffodil International University 18 Figure 4.1.3: Sigmoid Function Graph
4.1.3.1 RESULT
The result I got from doing Logistic Regression is given below
Table 4.1.3.1: Performance of Logistic Regression Model
Case Precision Recall F1-score Support
Testing 97% 97% 97% 171
©Daffodil International University 19 Figure 4.1.3.1: Confusion Matrix of Logistic Regression
4.1.4 K-NEAREST NEIGHBORS
K-Nearest Neighbor is one of the simplest algorithms which we used in Machine Learning.
We used K-Nearest Neighbors algorithm based on Supervised Learning technique. We can easily implement the K-Nearest Neighbor algorithm. The K-Nearest Neighbor algorithm is capable of solving both classification and regression problems. The K-Nearest Neighbor algorithm is extremely simple. We can easily put it into action. Furthermore, we do not need to create a model. The K-Nearest Neighbor algorithm is flexible. It is suitable for classification, regression, and search. But main disadvantage of K-Nearest Neighbor algorithm is when the number of example or predictor or independent variables increase, it becomes slower. We need to calculate two important things in K-Nearest Neighbor : 1.At first, we need to calculate the value of K. Here, K represent the number of nearest neighbors which are considered while classifying a new data point.
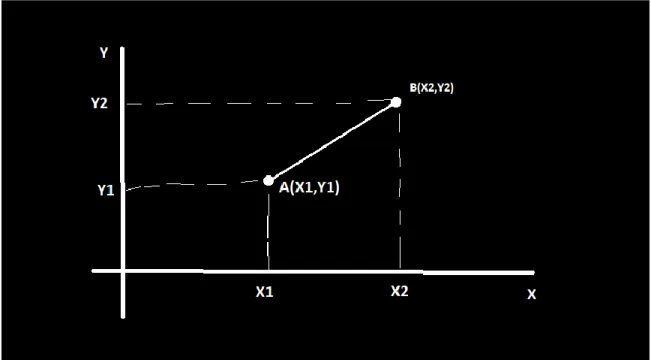
2.After that, we calculate the distance from each nearest neighbor. This calculation, we solve it by using the Euclidean Distance formula.
©Daffodil International University 20 Euclidean Distance between A1 and B2 is given below
√(𝑋2 − 𝑋1)
2+ (𝑌2 − 𝑌1)
24.1.4.1 ALGORITHM:
An algorithm which summarizes the working principle of K-Nearest Neighbor is given below:
Step1: Load the data.
Step2: Select the number K of the neighbor.
Step3: For each instance in the data.
Step4: Determine the Euclidean Distance.
Step5: To an ordered collection, add the distance.
Step6: Sort the ordered list.
Step7: Select the first K items from the sorted set.
Step8: Get the labels for the K entries you've chosen.
Step9: If there is a regression, return the mean of the K labels.
Step10: Return the mode of the K labels if classification is true.
Figure 4.1.4.1: Euclidean Distance
©Daffodil International University 21
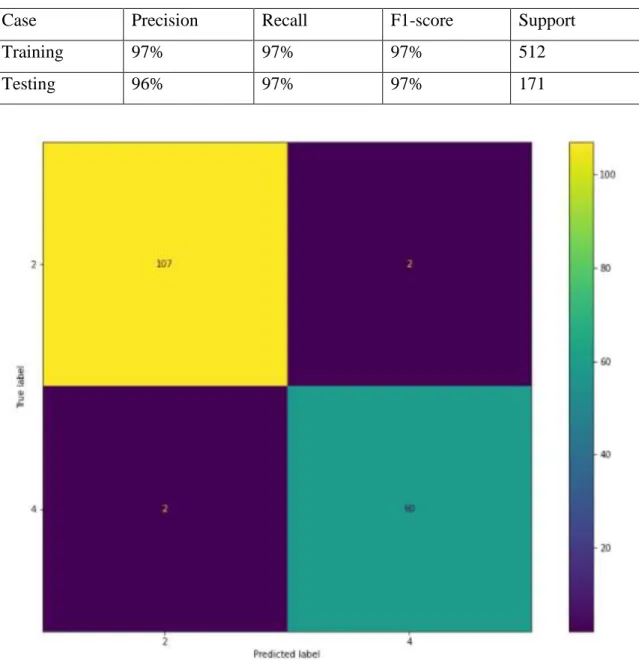
4.1.4.2 RESULT
The result I got from doing K-Nearest Neighbors is given below
Table 4.1.4.2: Performance of K-Nearest Neighbors Model
Case Precision Recall F1-score Support
Training 97% 97% 97% 512
Testing 96% 97% 97% 171
Figure 4.1.4.2: Confusion Matrix of KNN Model
©Daffodil International University 22
4.1.5 SUPPORT VECTOR MACHINE (SVM)
Another powerful yet configurable Machine Learning algorithm is the Support Vector Machine. Support Vector Machine also used the Supervised Machine Learning technique.
The support vector machine algorithms can be used for both classification and regression.
The implementation of the support vector machine begins in the 1960s. But in 1990 it got refined. The noticeable thing is, Support Vector Machine have its own unique way of implementation compared to another Machine Learning Algorithm.
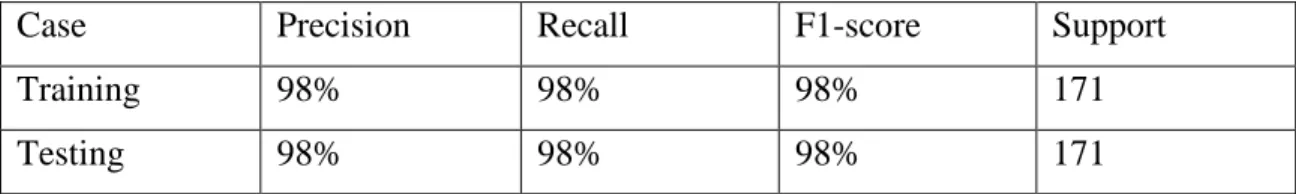
4.1.5.1 RESULT:
The result I got from doing Support Vector Machine (SVM) is given below
Table 4.1.5.1: Performance of Support Vector Machine Model
Case Precision Recall F1-score Support
Training 98% 98% 98% 171
Testing 98% 98% 98% 171
4.1.6 DECISION TREE:
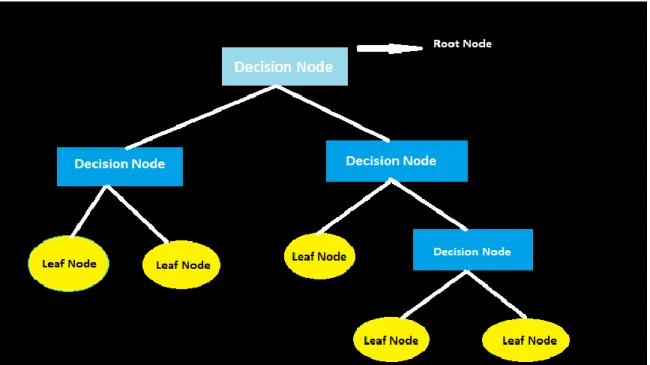
Another well-known Machine Learning algorithm is Decision Tree. It is also used supervised learning technique. We can use decision tree for both classification and regression problems. But in general, most of the time it is preferred for solving classification problems. The decision tree is very simple to grasp. The process that a decision tree follows is the same as the process that a human follows when making a decision in real life.
An Algorithm is given below to summarize the principle of Decision Tree.
4.1.6.1 ALGORITHM
Step1: Start the tree from root Node S.
©Daffodil International University 23 Step2: Using the Attribute Selection Measure (ASM), select the best attribute from the dataset.
Step3:
Step3.1: Subdivide S into subsets.
Step3.2: S contains a list of possible values for the best attribute.
Step4:
Step4.1: Generate the decision tree node.
Strp4.2: The best attribute is found in the decision tree node.
Step5: Step 3 is followed by a recursive creation of a new decision tree using a subset.
Step6: Continue the process until classify the final node as leaf node.
Figure 4.1.6.1: Working Process of Decision Tree
4.1.6.2 RESULT
The result I got from doing Decision Tree is given below
Table 4.1.6.2: Performance of Decision Tree
Case Precision Recall F1-score Support
Training 92% 93% 93% 171
©Daffodil International University 24
Testing 93% 92% 93% 171
Best Criterion: Entropy, Accuracy 97.66% at depth = 4
Decision Trees Accuracy on Training Data with best parameters after 10 Fold Cross Validation is : 0.9299019607843138 = 92%
4.1.7 NEURAL NETWORK
The neural network, and more specifically Artificial Neural Networks, are a popular Machine Learning Algorithm (ANNs). A set of algorithms is used to simulate the human brain. The neural network is divided into four components: inputs, weights, a bias or threshold, and an output. The algebraic formula is written as follows:
∑ WiXi + bias = W1X1 + W2X2 + W3X3 + bias
𝑚
𝑖=1
Neural Networks is less complex. We can easily design and maintain it. Moreover, Neural Network is one way propagation that’s why it is fast and speedy. It is highly responsible to noisy data. The basic unit of neural network is neurons. The working method followed by neurons is taking input, do some math with them and produces one output. And actually, a branch of neurons connected together and combined as a neural network. A simple neural network can be illustrated as bellow:
4.1.7.2 RESULT:
The result I got from doing Neural Networks is given below
Table 4.1.7.2: Performance of Neural Networks
Case Precision Recall F1-score Support
Training 96% 96% 96% 512
Testing 96% 96% 96% 171
After data calculation we find out that all the iteration among the best is was iteration .001 and .01 which stands for 96%.
©Daffodil International University 25 4.1.8 PERFORMANCE METRICS
This section goes over performance metrics that I used to evaluate the models.
4.1.8.1 PRECISION
Precision is defined as the proportion of genuine positives to the total of true positives and false positives. How many of our positive predictions were correct? Precision is the number of positive predictions that our model got correct out of all of them. Precision looks at how many false positives were included in the mix. If there are no false positives (FPs), the model is 100 percent accurate. The more FPs that are added to the mix, the dirtier the precision becomes. The formula for calculating it is as follows.
𝑷𝒓𝒆𝒄𝒊𝒔𝒊𝒐 = 𝑻𝒓𝒖𝒆 𝑷𝒐𝒔𝒊𝒕𝒊𝒗𝒆
𝑻𝒓𝒖𝒆 𝑷𝒐𝒔𝒊𝒕𝒊𝒗𝒆 + 𝑭𝒂𝒍𝒔𝒆 𝑷𝒐𝒔𝒊𝒕𝒊𝒗𝒆
I. True Positive: In this case, both the value that is actual and the value that is being predicted are true.
ii. False Positive: In this case, the actual value is false but the value that is predicted is true.
4.1.8.2 Recall
Recall goes in a different direction. Instead of focusing on the number of false positives predicted by the model, recall takes into account the number of false negatives in the mix.
When a false negative is expected, the recall rate suffers. The equations are diametrically opposed because the penalties for precision and recall are diametrically opposed. Precision and recall are the yin and yang of assessing the confusion matrix. The number of times our model got it correct out of all the actual positive values is called recall. The formula given below is used to calculate it.
©Daffodil International University 26
𝑹𝒆𝒄𝒂𝒍𝒍 = 𝑻𝒓𝒖𝒆 𝑷𝒐𝒔𝒊𝒕𝒊𝒗𝒆
𝑻𝒓𝒖𝒆 𝑷𝒐𝒔𝒊𝒕𝒊𝒗𝒆 + 𝑭𝒂𝒍𝒔𝒆 𝑵𝒆𝒈𝒂𝒕𝒊𝒗𝒆
I. True Positive: In this case, both the value that is actual and the value that is being predicted are true.
ii. False Negative: In this case, the actual value is true but the value that is predicted is false.
4.1.8.3 F1 Score
The F-score, also known as the F1-score, is a model accuracy metric that measures how accurate a model is on a given dataset. It is used to evaluate binary classification systems that categorize examples as 'positive' or 'negative.' The F-score is a technique for combining the model's precision and recall. It is defined as the harmonic mean of the model's precision and recall. The F1 Score is calculated using the equation below. It is used to find the optimal balance of precision and recall.
4.2 EXPERIMENTAL RESULTS & ANALYSIS
In the table below, I summarize the performance of the algorithms that I employed based on the aforementioned analysis.
Table 4.2.1: Performance of Algorithm on Testing Data
Algorithm Precision Recall F1-score Support
Naïve Bayes 96% 97% 97% 171
©Daffodil International University 27
Random Forest 95% 97% 96% 171
Logistic Regression
97% 97% 97% 171
K-Nearest Neighbors
96% 97% 97% 171
Support Vector Machine
98% 98% 98% 171
Decision Tree 93% 92% 93% 171
Neural Network 96% 96% 96% 171
Table 4.2.2: Performance of Algorithm on Training Data
Algorithm Precision Recall F1-score Support
Naïve Bayes 97% 97% 97% 512
Random Forest 96% 96% 96% 512
K-Nearest Neighbors
97% 97% 97% 512
Support Vector Machine
98% 98% 98% 171
Decision Tree 92% 93% 93% 171
Neural Network 96% 96% 96% 512
4.3 COMPARATIVE ANALYSIS
In the table below, I summarize the performance of the algorithms between our and others research.
©Daffodil International University 28 Table 4.3.1: Comparative Table
Algorithm Accuracy (others) Accuracy(our)
Naïve Bayes 95% 97%
Random Forest 95% 97%
Logistic Regression 96% 97%
K-Nearest Neighbors 97% 97%
Support Vector Machine 96% 98%
Decision Tree 94% 93%
Neural Network 96% 96%
4.4 DISCUSSION
After Applying all the Models like KNN, Logistic Regression, Random forest & Support Vector Machine, we have all the confusion matrix plot and the classification report of the models.
From the summary of all model Support Vector Machine (SVM) is best it for it
©Daffodil International University 29
CHAPTER 5
IMPACT ON SOCIETY, ENVIRONMENT AND SUSTAINABILITY
5.1 IMPACT ON SOCIETY
If I view my research in the context of Bangladesh, I believe it will have a positive impact on society. Breast Cancer affects a large percentage of Bangladeshi women, and many of them are young women. Detecting Breast Cancer at an early stage using Machine Learning could save a person's life and help to extend their lifespan in the long term. The majority of Bangladesh's populace is unconcerned about their health. I believe it will have a significant long-term impact on Bangladeshi society.
5.2 ETHICAL ASPECTS
My research was conducted in a perfectly ethical manner. The data I collected from the internet was only for the context of this research. More importantly, the whole effort that I have completed will benefit humanity. As a result, I do not believe this research is unethical.
5.3 SUSTAINABILITY PLAN
I began my research with a long-term strategy in mind. Several of these plans, I believe, have been completed. I couldn't complete this research effectively the way I thought because I was almost alone in the thick of a pandemic. However, if I can solve these issues in the future, this project will undoubtedly improve
©Daffodil International University 30
CHAPTER 6
CONCLUSION
6.1 SUMMARY OF THE STUDY
Breast Cancer is extremely common in Bangladesh, and young people are no exception.
The similar conclusion was reached in my research. Breast Cancer detection at an early stage is critical to a patient's ability to live a healthy life. I created a Machine Learning- based model for this purpose. Seven classic Machine Learning algorithms were employed in the model-building procedure. Support Vector Machine (SVM) was the model that performed the best.
6.2 CONCLUSIONS
This research is an important aspect of my Bachelor's degree curriculum. I didn't know much about Artificial Intelligence and Machine Learning and how they're implemented in the medical and healthcare disciplines when I started this research. While working on this project, I learnt a lot and began to like the field of AI. I'm still learning and growing because I enjoy it. I am optimistic that this research will be valuable in the fields of diabetes and machine learning, and that the people of Bangladesh would benefit in the long future.
6.3 IMPLICATION FOR FURTHER STUDY
The doors have been thrown open. In the disciplines of breast cancer and machine learning, more rigorous and in-depth research is required, particularly in the perspective of Bangladesh. Even my own research has a lot of opportunity for improvement. Machine
©Daffodil International University 31 Learning works extremely well with a large number of data, hence a large amount of data should be collected. Other advanced Machine Learning algorithms and more advanced AI techniques, such as Artificial Neural Networks and Deep Learning, can be utilized to create a model that is far more intelligent and efficient. With more features and advanced techniques, the model can be used in manufacture.
©Daffodil International University 32
REFERENCES
1.American Cancer Society, available at << https://www.cancer.org/cancer/breast-cancer/about/how- common-is-breast-cancer.html>>, last accessed on 12.02.2021 at 6.13PM.
2.World Health Organization, available at << https://www.who.int/news-room/fact-sheets/detail/breast- cancer>>, last accessed on 12.02.2021 at 6.13PM.
3. Elmore JG, Nakano CY, Koepsell TD, Desnick LM, Ransohoff DF: International variation in screening mammography interpretations in community-based programs. J Natl Cancer Inst 95(18):13841393, 2003.
4. Veronesi U, Boyle P, Goldhirsch A, Orecchia R, Viale G: Breast cancer. Lancet 365:17271741, 2005.
5. A. Callahan and N. H. Shah, “Machine learning in healthcare,” in Key Advances in Clinical Informatics.
Elsevier, 2017, pp. 279–291
6.Hiba Asria,Hajar Mousannifb and Hassan Al Moatassimec,"Using Machine Learning Algorithms for Breast Cancer Risk Prediction and Diagnosis",Procedia Computer Science 83,y Elsevier Bpp, pp 1064 – 1069,2016
7.Md. Toukir Ahmed, Md. Niaz Imtiaz and Animesh Karmakar,"Analysis of Wisconsin Breast Cancer original dataset using data mining and machine learning algorithms for breast cancer prediction”, Journal of Science, Technology and Environment Informatics, 09(02), pp 665-672, July 2020
8.Lucas Borges, “Analysis of the Wisconsin Breast Cancer Dataset and Machine Learning for Breast Cancer Detection”, Proceedings of XI Workshop de Visão Computacional, researchgate, pp 15-19, October 2015
9.Vikas Chaurasia, Saurabh Pal and BB Tiwari, “Prediction of benign and malignant breast cancer using data mining techniques”, Journal of Algorithms & Computational Technology, Vol. 12(2), pp 119–126, 2018
10. UCI Machine Learning repository, available at << https://archive.ics.uci.edu/ml/index.php l >>, last accessed on 12.02.2021 at 6.13PM
©Daffodil International University 33 11. Kaggle, available at << https://www.kaggle.com/rival2all/ucibreastcancerwisconsincleaned/code>>, last accessed on 12.02.2021 at 6.13PM
12.UCI Machine Learning Repository, available at << https://archive.ics.uci.edu/ml/datasets/breast+
Cancer+Wisconsin+(diagnostic)>>, last accessed on 12.02.2021 at 6.13PM.
©Daffodil International University 34
©Daffodil International University 35