DEPRESSION DETECTION FROM SOCIAL NETWORK DATA THROUGH MACHINE LEARNING TECHNIQUE DURING COVID-19 SITUATION
By
SADIA ISLAM SMRITY ID: 201-25-868
This report presented in partial fulfilment of the Degree of Master of Science in Computer Science and Engineering
Supervised By Assistant Professor Narayan Ranjan Chakraborty
Department of CSE
Daffodil International University
DAFFODIL INTERNATONAL UNIVERSITY DHAKA, BANGLADESH
12 September,2021
©Daffodil International University i
APPROVAL
This project Titled “Depression detection from social network data using machine learning technique during Covid-19 situation”, submitted by SADIA ISLAM SMRITY, ID: 201-25-868 to the Department of Computer Science Engineering has been accepted as satisfactory for the partial fulfilment of the requirements for the degree of M.Sc.
in Computer Science and Engineering and Engineering and approved as to its style and contents. The presentation has been held on 12th September 2021.
BOARD OF EXAMINERS
Dr.Touhid Bhuiyan Chairman
Professor and Head
Department of Computer Science and Engineering Faculty of Science &Information Technology Daffodil International University
Dr. Md. Ismail Jabiullah Internal Examiner Professor
Department of Computer Science and Engineering Faculty of Science & Information Technology Daffodil International University
Dr. Sheak Rashed Haider Noori Internal Examiner Associate Professor and associate Head
Department of Computer Science and Engineering Faculty of Science & Information Technology Daffodil International University
Dr. Mohammad Shorif Uddin External Examiner
Professor
Department of Computer Science and Engineering Jahangirnagar University
©Daffodil International University ii
DECLARATION
I hereby that, this project has been done by us under the supervision of Narayan Ranjan Chakraborty, Assistant Professor, Department of CSE, Daffodil International University. I also declare that neither this Thesis nor any part project consciously has been submitted elsewhere for award or any other degree.
Supervised by:
Narayan Ranjan Chakraborty Assistant professor
Department of CSE
Daffodil International University
Submitted by:
Sadia Islam Smrity ID: 201-25-868 Department Of CSE
Daffodil International University
©Daffodil International University iii
ACKNOWLEDGEMENT
To being with, I express my sincere gratitude and appreciation to the All-powerful God for His favours that empowered me to effectively complete the year thesis.
After a long battle to discover a subject and advisor, I have come to the conclusion of the ultimate year of our postgraduate masters. I really grateful, thankful and also wish my indebtedness to my honourable teacher Narayan Ranjan Chakraborty, Assistant professor of Computer Science and Engineering Daffodil International University, Dhaka, Bangladesh. The thing that helped me the most in continuing this thesis was my supervisor’s deep knowledge, interest in “machine learning” and his supervision. Without his help, it would not have been possible to conclude this thesis. Thanks a lot for all the time dedicated to my interesting and fantastic research topic. His endless patience, scholarly guidance, continual encouragement, constant and energetic supervision, valuable advice, reading many inferior drafts and correcting then at all stage have made it possible to complete this work.
I would like to express my heartiest gratitude to the almighty God and Head, Department of CSE, for his kind to finish my thesis and also to other faculty members and the staff of the CSE department of Daffodil International University.
I would like to thanks my all-course mate in Daffodil International University, who took part and help me in this discuss while completing the course work.
Finally, I must acknowledge with due respect the constant support and patients of our parents, family and beloved persons.
©Daffodil International University iv
ABSTRACT
Coronavirus outbreaks have had a Signiant impact on human life. This thesis considers the detection of depression by applying a system that can effectively detected depressing text from various post in covid situation. The pandemic has an indirect effect on human mental health, which is irreversible but difficult to assess. One of the most frequent mental ailments is depression. More than 300 million individuals are said to be depressed over the world.
This equates to about 4.4 percent of the global population. Facebook is great platform for people to express their emotions. We focused on the depressing post obtained from Facebook and how many individuals reacted to them in this article. We build the dataset for the training purpose by manually labelling 1000 Bengali and 1000 English Facebook post. In this study, we use machine learning algorithm, which has over-performing aspect on my classifications and a method weighing input properties implies on their importance.to classify our data and notice greater accuracy, we applied python and several common machine learning approaches.
©Daffodil International University v
TABLE OF CONTANTS
CONTENTS PAGES
Board of Examiners i
Declaration ii
Acknowledgement iii
Abstract iv
CHAPTER 3: RESEARCH METHODOLOGY
3.1 Introduction 19
3.2 Research Subject and Instrumentation 20
3.3 Data Collection Procedure 21
3.4 Statistical Analysis 22
3.5 Implementation 33
CHAPTER 1: INTRODUCTION
1.1Introduction 1
1.2 Motivation 4
1.3 Rationale of the Study 5
1.4 Research Question 6
1.5 Report Layout 7
CHAPTER 2: BACKGROUND
2.1 Introduction 9
2.2 Related Work 14
2.3 Research Summery 16
2.4 Scope of the problem 16
2.5 Challenges 17
©Daffodil International University vi
CHAPTER 4: EXPERIMENTAL RESULT AND DISCUSSION
4.1 Introduction 34
4.2 Experimental Result 34
4.3 Descriptive Analysis 34
4.4 Summery 44
CHAPTER 5: SUMMERY, CONCLUSION, RECOMMENDATION, AND IMPLECATION FOR FUTURE RESEARCH
5.1 Summery of the study 47
5.2 Conclusion 47
5.3 Recommendation 47
5.4 Implication of further study 48
REFERENCES
49©Daffodil International University vii
LIST OF FIGURES
FIGURES PAGE
Figure 2.1.1 Number of social media users 9
Figure 2.1.2 percentage of each social media site’s user who get news there
10
Figure 2.1.3 Rate of depression according country 11
Figure 2.1.4 Depression rate by age 12
Figure 3.1.1 System model for depression Detection 18
Figure 3.3.1 Fetches data from Facebook using face pager tool 22
Figure 3.3.2 Depression data set 23
Figure 3.4.1 High Data Gain 26
Figure 3.4.2 poor Data gain 27
Figure 3.4.3 KNN representation 28
Figure 3.4.4 Working procedure of SVM model 31
Figure 3.4.5 Working procedure of ensemble model 33
Figure 3.4.6 Flow Chart for working Procedure 34
Figure 4.3.1 Density count for parent comment 39
Figure 4.3.2 Density count for created time 39
Figure 4.3.3 Density count for like reaction 40
Figure 4.3.4 Density count for ha-ha reaction 40
Figure 4.3.5 Density count for wow reaction 41
Figure 4.3.6 Density count for sad reaction 41
Figure 4.3.7 Density count for angry reaction 42
Figure 4.3.8 Co-relation between reaction & label 43
©Daffodil International University viii Figure 4.3.9 Comparison of accuracy between machine learning
classifier
44
Figure 4.3.10 Reactions of depressive and non-depressive post 45
Figure 4.3.11 Word cloud from consideration 45
©Daffodil International University ix
LIST OF TABLES
TABLES PAGE
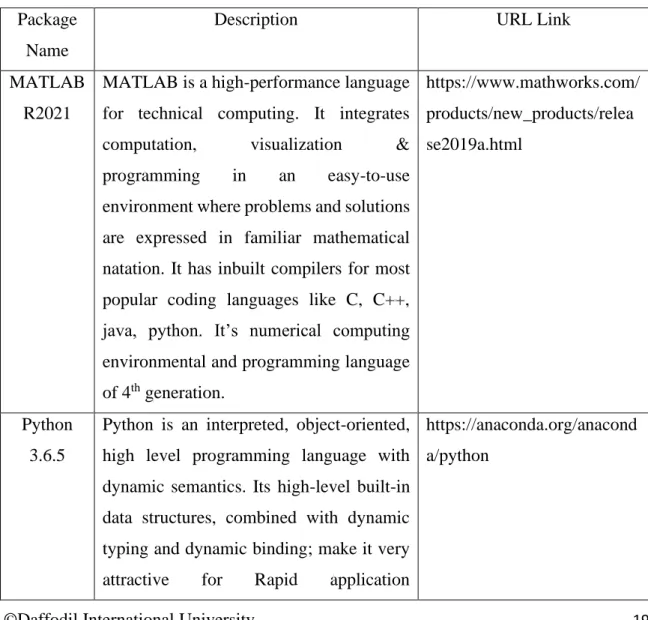
Table 3.2.1 Open-source software/ project found different Enterprise Repository Online
19
Table 3.3.1 Information of Depression Dataset 22
Table 3.4.1 Example of depressed and non-depressed dataset 24 Table 4.3.1 Accuracy obtain by machine learning classifier (python) 36 Table 4.3.2 Accuracy obtain by classifier machine learning classifier
(MATLAB)
26
©Daffodil International University x
LIST OF ABBREVIATIONS
OSN Online Social Network
ML Machine Learning
SBM Support Vector
KNN K-Nearest Neighbour
DT Decision Tree
TP True positive
FN False Negative
FP False Positive
©Daffodil International University 1
CHAPTER 1 INTRODUCTION
1.1 Introduction
Depression that words we throw around so easily nowadays. Depression is a state of low mood and aversion to activity. It can affect persons thoughts, behaviour, motivation, feelings, and sense of well-being. That word uses to describe anything from bad day to an overwhelming inability to live life. But as anyone with depression knows, it is much more anyone word can describe. Depression is a serious mental health problem for people all ages.
Episodes of coronavirus (COVID -19) recently human has been incredibly influenced. The current COVID -19 pandemics influence individuals of all ages over the world both physically and mentally. In this situation, the mental problem of the people is becoming more and more serious. Bereavement, isolation, loss of income, and fear trigger menta health conditions or exacerbate existing ones. Many people may be facing increased levels of alcohol and drug use, insomnia, and anxiety. They are becoming more and more depressed. The problem may come from various reasons such as unemployment status, stay-at-home policy, fear for the virus, and so forth.
People around the world use the internet in January 2021, up by 316 million (7.3 percent) since this time last year. Global internet penetration now stands at 59.5 percent. At the beginning of 2021, there were 4.20 billion social media users worldwide, accounting for more than 53 percent of the world’s population. In this age of modern communication and technology, social networks have been developed as a great point for its user to communicate with their interested friends and share their opinions, photos, and videos reflecting their moods, feelings, and sentiments.
Depression detection is the task of predicting depression in the text. This study aims to perform depression analysis on Facebook data collected from an online public source. To investigate the effect of depression detection, we propose a Machine learning technique as an efficient and scalable method. Data science/ machine learning is a great tool that enables researchers and psychiatrists to detect patient stress risk level and support personalized medical decision making.
©Daffodil International University 2 Depression: The main depressive disorder is the feeling of sadness and loss of interest in activities that you once enjoyed. It can lead to a variety of mental and physical problems and reduce your ability to work at work and at home. Symptoms of depression can vary from mild to severe and can include feeling worthless or guilty.
Symptoms can vary from mind to server and can include insomnia, increased fatigue, and an increase in purposeless physical activity.
Type of Depression:
There are five kinds of depression, despite the fact that there are many different diagnoses for depression. Each kind has its own set of contributing causes and sings.
• Major Depression: Major depression is a term that most people are acquainted with.
Many people with severe depression describe it is a “global gloom”. They are lost interest in most activities, even those they previously loved. Sleep issues, a loss of appetite or weight, a lack of vitality, and feelings of worthlessness are some of the other symptoms. There are also be thoughts of death or suicide.
• Persistent Depressive Disorder: Dysthymia was the old name for the persistent depressing illness. As the name indicates, this form of depression is characterized by persistent or continuing symptoms that last at least two years. Although the symptoms are persistent, they are not severe enough to be classified as serious depression. Many persons with chronic depressive illness are able to cope with day- to-day task. They, on the other hand, rarely display signals of excitement or contentment. Changes in hunger, energy, self-esteem, and sleep habits are also likely to occur.
• Bipolar Disorder: The term “manic-depressive disorder” is often used to describe bipolar disorder. This kind of depression is characterized by mood swings and
“reverse” actions. Bipolar disorder patients have moments of great energy followed by bouts of exhaustion and depression.
• Seasonal Affective Disorder (SAD): Seasonal effective disorder is a kind of depression that occurs during the (SAD). Seasonal Affective disorder is a characterized by mood swings that occur as the seasons change. Sad is thought
©Daffodil International University 3 caused by changes in the body’s rhythm, as well as alterations in the function of chemical messengers like serotonin.
• Postpartum Depression: postpartum depression is mood condition that effect one out of every seven new moms. Postpartum depression causes acute ness, worry, and exhaustion in mothers, which can make it difficult for them or other to accomplish daily care chores.
Symptom of Depression:
• Signs and symptoms depression impairs a person’s capacity to think, focus, and exhibit oneself through causing cognitive impairment or trouble concentrating.
• Some individual with depression is so excited that they almost rush (for example, they can’t sit still, move, roll with fists, wear impaired vision clothes, or other things).
• Body aches, headaches, joint pain, stomach discomfort, and other aches and pains often accompany depression.
• Changes in behavioural signs and symptoms hunger, in most cases of depression, the appetite decreases, the food seems boring and excessive.
• Frustrating is related to the amount of time the response to the verb is expected, the degree of confusion, the amount of speaking, or degree of isolation or isolation.
• People with depression can sometimes feel weak even if they don’t work hard.
• For depression, sleep is frequently interrupted.
• The loss or increase of weight is a common sign of depression.
• Depressed individuals frequently experience unpleasant and exaggerated guilt.
Depression during covid situation:
With the rapid spread of corona virus around the world, it has caused a considerable degree of fear, anxiety and concern among the population, especially among the elderly, caregivers and people with underlying health problems.
With the introduction of new systems and effects, especially isola5tion and normal activeness, its impact on daily life or livelihood of many people, loneliness, depression, harmful use of alcohol and drugs, and many more have increased.
©Daffodil International University 4 Machine Learning: Machine learning is a type of data analysis is that automates that creation of analytical models. It’s subset of artificial intelligence predicted on the notion that machines ca learn from data, recognize patterns, and make judgments with little or no human interaction.
• A Decision process: Machine Learning algorithms are used to create predictions or classifications in general. Algorithm will provide an estimate of a pattern in the data based on certain input data, which can be labelled or unlabelled.
• An Error function: An error function is used to assess the model’s prediction. If there are known instances, an error function may be used to compare the model accuracy.
• A model optimization methodology: Weights are changed to decrease the gap between the know example and the model estimate if the model can fit batter to the data points in the training set.
1.2 Motivation
Depression, often referred to as major depressive disorder is one of the most common mental illness affecting than 300 million people worldwide. This study looks at detection depression based on machine learning using data from social media networks. We have thoroughly analysed the data to define percipients behaviour based on different component of their work, including readers’ spread, time interval, and duration.
The development of the internet over the past decade has identified the emerging dominance of social communication as a platform for human interaction. Now more than ever, anyone with basic access to the internet can express their thoughts and spread their ideas through the online community. Many of the digital practices formed during the lockdown situation, the number of social media users is significant. More than half of the world now uses social media. Social media allows individuals to keep I touch with the friends and extended family.
People use social media connect with people across the globe with like-minded interests, and share their own thoughts, feelings, and insights online. Facebook opens up a space for
©Daffodil International University 5 news and information providers to experiment with new ways to get their message out, interact with the audience to participate.
Facebook is a potential source for our research. Although detecting depression is a psychological matter, in this paper there was an attempt to predict depression using machine learning. Depression detection is the task of predicting depression in text. In this study, we aim to perform depression analysis on Facebook data collection from an online public source. Here we are going to attempt to recognize depression detect by dissecting post.
1.3 Rationale of the study
Researchers have recently utilized social media to detect depression symptoms in people by analysing linguistic data from their post. In this work, we offer a technique for identifying social data as the major predictors of depression. Previous work in comparative themes, for example categorized and compare with the dates. There have been several studies and consistent with the previous ones. This particular problem will be applied in real life so that individual can easily guess their mental state.
Interference with depressing words reduces agility and inhabits a person’s capacity to think, making it difficult for them to concentrate and assess. It affects the brain and generates time or events that causes numerous individuals who suffer from depression to recollect their memories and difficulties. Young people make up 18 percent of the world’s population.
They are the father of all performance or innovation. Depression affects a person psychologically, but it can also affect physical structures. Depression can affect the central nervous system. It can also cause permanent brain damage, so the person has difficulty remembering and concentrating after the disease is over.20 percent of depression patients never fully recovered.
Due to depression, young people are losing their desire to work. They are involved in various immoral activities due to depression. As a result, society has lost many talented young people as criminal activities are on their rise. Depression is most common among 18–25-year-old. If we want to save this young people from the tendency to commit crimes and want to use their talents properly, then it is very important to detect depression. During that period of time, 90 percent of adults between the ages of 18 and 29 years used social networks.
©Daffodil International University 6 So, if we analyse the data that is available for social media platforms like Facebook, we will be able to detect depressed youth people better and we can take action for those suffering from depression among the uses. The purpose of this thesis is to analyse the data that is available for social media platforms like Facebook based on the nature and mentality of the user in their various social media posts.
1.4 Research Questions:
The rapid spread of the coronavirus pandemic throughout the world is creating widespread panic and anxiety among the general public, particularly among the elderly, caregivers, and those with basic health concerns. Especially segregation and its effect on the normal activities, routines or livelihoods of many people. Isolation increases loneliness, depression, harmful alcohol, and drug use.
We have adapted text presentations that can make sophisticated progress in the detection of depression is the purpose of our study.
We have created some research questions that focus on the topics of our project and outline the tasks that needed to be completed. The research question are follows:
▪ What is the need to detect depression?
▪ Why we collect data from Facebook?
▪ Why did we collect reaction?
▪ Why we apply machine learning technique for detect depression?
With the advancement of social media and the continuous advancement of machine learning calculation, the value of social media-based strategies can become more effective and accurate.
We will go through a few quantitative results before moving on to the results. To find keyword, we looked at social media posts. It enhances performance in detecting depression, and we notice more indications of frustration as a result. Word of despondency should include feelings of despondency, frustration, happiness, rage, or harmful tension.
As a result, this research offers insight on how to identify depressive symptoms inwritten texts as quickly as feasible. Depression has been found to impact people’s language using in the past. We looked at the number of machine learning (ML) techniques that have been shown to accurately detect depression.
©Daffodil International University 7 We have been collecting post from Facebook from March 2020 to April 2021 and manually labelling them to understand the minds of the users and to collect the reactions along with the posts to know how other user react to those posts. We’ve tried to detect depression with posts and how these depressing posts affect other users.
We are using machine learning algorithms to detect depression. We compare several machine learning methods that have proven effective.
1.5 Report Layout
Chapter 1 introduction section sheds light the fundamental basic of our thesis. We discuss how users ‘depressing post on social media affected other users. The motivation for the study is discussed in this chapter. The logic of the study and some of our efforts also be discussed. Most significantly, the expected outcome of the thesis is briefly discussed.
Chapter 2 background chapter discusses the background of the study. We talked about where the idea of research came from. Provide a basic overview of global social network analysis. Some of the work associated with it has been reviewed in literary journals. Science then, the scope of our thesis has mostly been focused on the background part in the same place. Also, what challenges need to be addressed to achieve this are also discussed here.
Chapter 3 The main purpose of experimental analysis part is described in the title is to establish a research strategy. This is the main area of discussion here. Since data is the most important aspect of the project it will get most important aspect of the thesis, it will get the most attention. In this chapter, two datasets are examined and explained, for example how to collect data. Which algorithm will be used to analyse the data and how many will be applied?
Chapter 4 Experimental Result and Discussion is the most imperative part this study, all of the mathematical terminology will be discussed briefly here. This part, which will focus on the mathematical concepts of this project, will include experimental findings and descriptions, and the entire section will be presented in a simple straightforward manner at the end of the chapter.
Chapter 5 summery, Conclusion, Recommendation and Implication for future research sheds on whole project will be summarized in this part.in addition, recommendations and
©Daffodil International University 8 future effects will be provided. What is the final conclusion of the study and the same case how the results can be used in an advanced field of machine learning?
©Daffodil International University 9
CHAPTER 2 BACKGROUNG
2.1 Introduction:
The covid-19 pandemic has had a significant influence in our life. Although social distance is important to reduce the benefit of covid-19, it can also make us feel lonely and increase the tension and anxiety. therefore, monitoring people’s mental health during a crisis such as a pandemic is a top priority.
Our lives have changed significantly as a result of the lockdown. At this moment, people are spending more time on social media. Many people have turned away from the rising usage of social media websites and other apps to pass the time during the covid-19 lockdown. .it is no longer secret that the usages of the social media platforms such as Facebook, tiktok, twitter, and WhatsApp has risen needly.
The purpose of this study is to review the result of stress, anxiety and frustration among the general public’s posts on social media during the covid-19 pandemic.
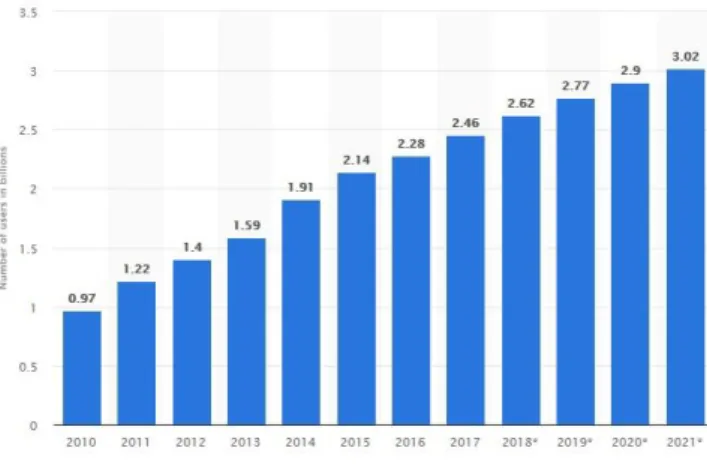
Social Media Analysis: Today the internet is becoming a part of our lives. Over the years we have witnessed rapid development in information technology. This is commonly known as social media. Social media sites have been with us for over two decades. Statistics show the number of global social media users from 2010 to 2021.
Fig 2.1.1: Number of Social Media User
Social media is a computer-based technology that encourages the sharing of thoughts, ideas and data through the reaction of virtual system and communities. According to the plan,
©Daffodil International University 10 social media via computers, tablets or smartphones through web-based computer programs or applications. Social media play a crucial role in connecting people and developing relationships. Social media allows individuals to keep in touch with friends and extended family. Some people will use various social media applications to network and find career opportunities, connect with people across the globe with like-minded interests, and share their own thoughts, feelings, and insights online. Social media user numbers have surged in the past 12 months too, with 521 million new users joining social media in the year to April 2021. Analysis of reginal use of social media shows the wide variation inactive social shows the wide variation inactive social media penetration reaching 66% in Eastern Asia, 74% in North America, 72% in Southern America 79% in both Northern and Western Europe falling to 31% in South Asia, 16% in Western Africa and 8% in Middle Africa.
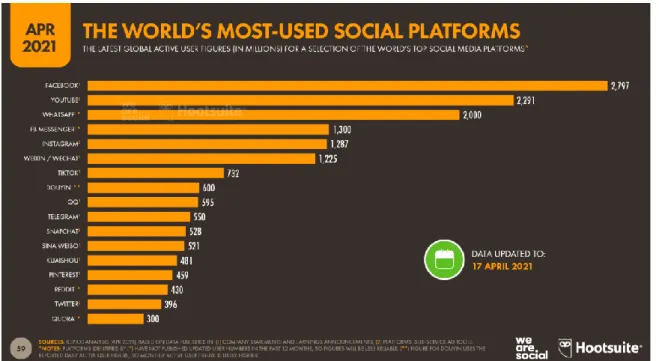
Facebook also has over 1.2 billion monthly active users, Twitter over one billion registered users and Instagram over 300 million. Fig 2.1.2 despite that percentage of each social media site’s user who get news there.
Fig 2.1.2: percentage of each social media site’s user who get news there
Rates of Depression:
The world health organization keeps track of global depression rates. It’s important to remember, though, that depression and other mental health issue are far less common in the world. Low reporting rates might be caused by cultural prejudice, social stigma, and a lack
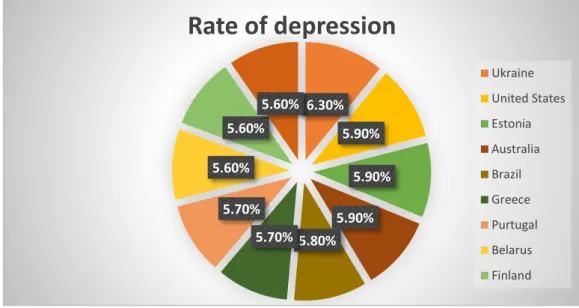
©Daffodil International University 11 of access to screening and treatment. Fig 2.1.3 depicts that according to recent WHO study on world-wide depression rates indicates that the following countries have the highest rate of depression:
1. Ukraine (6.3%) 2. United states (5.9%) 3. Estonia (5.9%) 4. Australia (5.9%) 5. Brazil (5.8%) 6. Greece (5.7%) 7. Portugal (5.7%) 8. Belarus (5.6%) 9. Finland (5.6%) 10. Lithuania (5.6%)
Fig 2.1.3: Rate of depression according to country
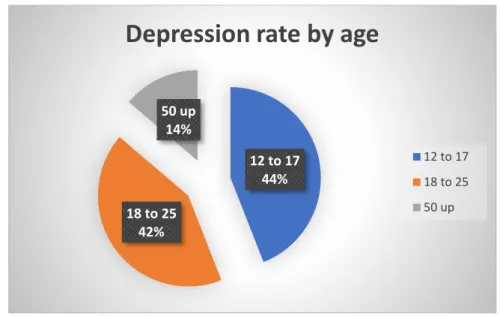
Depression Rate by age: Depression is amental disease that is one of the most frequent health issues among adolescents and young adults. Anxiety and sadness in young people can be splitting up, unemployment, recent deaths, abuse or neglect are just a few examples.
Fig 2.1.4 depicts that depression rate by age
• Adolescents between the ages of 12 and 17 had the greatest prevalence of major depressive episodes (14.4%),
6.30%
5.90%
5.90%
5.90%
5.80%
5.70%
5.70%
5.60%
5.60%
5.60%
Rate of depression
Ukraine United States Estonia Australia Brazil Greece Purtugal Belarus Finland
©Daffodil International University 12
• Followed by those between the ages of 18 and 25 (13.8%).
• The rate of major depressive episodes was lowest among those aged 50 and up (4.5%).
Fig 2.1.4: Depression Rate By age
Depression Detection: Detecting depression is the task of predicting depression in the text.
This is an important step to sentiment analysis. Considering the prevalence and challenges of depression in sentiment carrying texts. This process can also be referred to as a computational approach that predicts whether a given text is frustrating or non-frustrating satire. For example, “reality is not easy to accept”. This example form is a frustrating post
• It contains a depressing sentiment that explains how difficult the reality is.
• The assessment in the statement actually refers to how much depression there is about “life”.
Several linguistic studies have described different aspect of depression.
Data Analysis in python:
Python is being taught as programming language to data science consulting firms’ teams of developers and data scientists. Python has become the most popular programming language in a short period time. Data scientists must handle huge volumes of data, which is referred to as big data. Python has been a popular choice for processing large data due to its ease of use and vast range of python modules.
12 to 17 44%
18 to 25 42%
50 up 14%
Depression rate by age
12 to 17 18 to 25 50 up
©Daffodil International University 13
• Data manipulation, data visualization, statistics, arithmetic, machine learning, and natural language processing are just a few of the open-source python modules available.
• The more popular python becomes, the more users will offer feedback on their experiences, resulting in additional support items being available without assistance.
• It’s no surprise that python is becoming increasingly popular.to summarize these reasons, python is simple to use.
• There are many open-source python libraries, such as data manipulation, data visualization, statics, mathematics, machine learning, and natural language processing.
• Python can help the programmers complete their work with fewer lines of code.
• Fortunately, python has a large user base and is widely used in academic and business, so there are many useful analysis packages.
• This is an open-source project. Python is open source, which means that it is available and developed by the community for free. Python is a great tool for programmers to get started because it is easy to learn.
• It is very adaptable. If you want to try some ne3w ideas, python is a programming language that can be used.
• Python is designed to run on windows and Linux system.
• It is not difficult to understand that python has a gradual and relatively low learning curve due to its emphasis on simplicity and readability
• More and more data analysts and data scientists recognize it, creating a self- sustaining acceptance cycle.
Data analysis in MATLAB:
• MATLAB includes a deep toolbox that gives easy MATLAB instructions for building and linking the layer of a deep neural network.
• Matrix operations are the basics of linear algebra and are utilized in the description of many ML method.
• They are employed in the development of algorithms and procedures.
©Daffodil International University 14
• Inverse matrix operations are used to solve system of linear equations while transpose operations are used t5o flip the dimension of the matrix.
Point of using Facebook to collect data:
• Facebook is the mostly user-friendly website, even a 14-year-old youngest can readily comprehend that it has all of the functions.
• In addition to connecting individuals, is a major source of information, allowing users to read news and publications about current events across the world.
• More update functionalities have been added to the website since it was established to make it more useful to people and to help it acquire user awareness and recognition.
2.2 Related Work:
A large emergency, such as the coronavirus diseases 2019(covid-19), would especially sharply increase people’s mental health problem, not only from the emergency itself, but also from the subsequent social outcomes such as unemployment shortage of resources and financial crisis.[1]
Author build the EmoCT dataset for classifying covid-19 related tweets into different emotions to study the mental health problem and they apply BERT (ft) model from single label classification task to predict the emotion label on randomly picked 1 million English tweets data on April 7, 2010.[2]
Their analyses provide insights on the evolution of social sentiment over time and topic themes connected to negative sentiment of Weibo posts. Therefore, analysing post with negative sentiment from social media could contribute to understanding the experiences of Chinese general public during the outbreak of COVID-19 and offers examples for other countries. Results from Weibo posts provide constructive instructions o public health responses, that transparent information sharing ang scientific guidance might help alleviate public concern.[3]
This evaluation is based on depression based on images and videos. Machine learning technique are used to create an identification model. Because the great majority of population is affected by this issue such a system urgently needed. This research looked at
©Daffodil International University 15 depression indicators as well. Many people are affected by depression, which is the most prevalent kind of physiological or mental illness.
Machine learning uses a variety of approaches to identify sadness in people using sound or video recordings. It’s been used in medical diagnostics and to classify and diagnostic and to classify and diagnose a verity of illness including neurodegenerative disease.
Picture/videos can be used to extract facial information and to analyse the features of the machine learning to detect depression. [4]
The proposed method has surpassed the previously proposed accuracy due to the diversity and richness of its feature set. The frequency words are selected according to the higher frequency felling for user. The feelings are calculated for each tweet using sentence feeling, and then the average of all tweets is calculated for user mixed sentences. [5]
The proposed system detects depression in the user through machine learning techniques.
The algorithm takes reading of emotion from the input text given by the user before it announces if there is any depression found in the text. The user can access the system in the comfort of his privacy, which protects him from surrounding social stigma. [6]
In this article, twitter is regarded as the source of analytical data, in the form of user tweets.
Compared with image and video data, the memory storage size is significantly smaller.
Twitter has fixed limit on the number of characters allowed in a single tweet, and it has proven to be the best platform for applying emotional artificial intelligence to detect depression.[7]
This paper offers a methodology for obtaining usernames from user posting on social media and determining the amount of depression risk. 50 Facebook users were invited to contribute their most recent year’s posts, which were then used in machine learning model.
It has been established that depression may lead to major mental illness or even suicide, as well as how to detect depression using machine learning approaches.
A systematic methodology for determining how annoyed people is with the social media messages. Because the algorithm collects tweets using keywords rather than Facebook posting, it is unable to establish a person’s level of frustration. The depression criterion may be divided into six ranges using th3e machine learning model (normal, mild, moderate sere and extreme).[8]
©Daffodil International University 16 On reddit, look for postings on depression. According to authors, people with certain personalities or demographics are more likely to post their mental health diagnoses on social media. The MLP classifier had the best performance in recognizing the presence of sadness in the reddit social network in our study, with an accuracy of 91%. The MLP classifier achieved a score of 91%, demonstrating the combined feature’s strength and efficiency.[9]
2.3 Research Summary:
The results show that our proposed method can significantly improve the accuracy of performance. In this study, we tried to detect the presence of depression search through social media posts on Facebook and for effective performance increase depression detection solutions. In this thesis, we have analysed how users’ frustrating posts influence other Facebook users and how they react to these posts. We have extracted the textual features for our specific research problem and explained in details the lessons learned from each type of use. For feature training we used both python and machine learning method.
The appropriate training method for classifying each feature is done using DT (Decision Tree), KNN (K Nearest Neighbour), Ensemble, SVM and Random Forest. Identification performance is an assessed with different machine learning (ML) subclasses.
2.4 Scope of the problem:
The ability to detect depression in the text is important for influencing analytics system that have a wide range of applications. People sitting home during the lockdown are suffering from depression- like students are depressed about their studies, young people are worried about their job or career, businessman are worried about their business.
The article focuses on application that will take input in the form of a lecture or text and determine the most appropriate response or recommendation. This technique assesses if the person is depressed and if there are any underlying issues, as well as the causes of depression. Because the system has been taught by the user’s input, it begins tailoring recommendations and a response that address the root problem.
The thesis goal is to build a proof of concept that can cater to the requirement of everyone suffering from depression. Will create and suggest a text model that is both computationally and computationally efficient. The objective is for everyone to be able to participate in the
©Daffodil International University 17 project. The project’s goal is to inspire individual and, in turn, dissuade them from choosing drastic actions like suicide. Data will be transmitted in secure manner and will be transmitted in a secure manner and will not be made public. This also tries to identify domestic violence and other concerns that people are reluctant to discuss. The application will walk you through the actions.
2.5 Challenges:
Textual information is the foremost broadly utilized form of communication that gives numerous feature that make it the most excellent choice for analysing data to detect depression.
The challenges of this thesis are to
• Collection of depression data of covid 19 circumstance from post and reactions of social media users.
• Facebook post-reaction for detecting depression.
• Analysis the mostly used algorithm for detect depression.
• Work with both English and Bengali data.
In this paper, we try to present a structural model that identifies the level of depression of users from their social media posts. Much like text summarization, machine translation, depression detection involves complexity of language and is believed to be a much hard task. Detecting depression for messages in different language is a very difficult and complex task. In addition to the level of complexity in identifying depression during covid- 19 situation through social media platforms, adopting supervised machine learning approach have not been widely accepted due to the difficulties in obtaining sufficient amounts of annotated training data.
©Daffodil International University 18
CHAPTER 3
RESEARCH METHODOLOGY
3.1 Introduction
Detection depression using machine learning approach by analysing the social media post of users. Facebook posts have been considered. This study determines its applicability to different populations, not just students, but to other regions of the world and not only in English, we will try to identify depression by analysing post in Bengali together and using an inventory that has made semantic observation of Facebook users. We will develop a model that contains features from both depressed and non-depressed classes.
Fig 3.1.1: System Model for Depression Detection
Figure 3.1.1 despite that Frist we collect data from online resources, then we will label the unlabelled data. After labelling we will apply machine learning then we will divide the data set into training and testing data sets and apply the machine learning classifiers to find the accuracy.
Online Resource
Collection Data Unlabelled Data Labelled Data
Training Data
Testing Data Machine Learning
Classifier Accuracy of
depression dataset
Machine Learning
©Daffodil International University 19
• This process of creating raw data for machine learning model know as data preparation.
• When crating machine learning model, this is the first and most important stage.
• When working with data, it is also necessary to clean it and save it in a formatted state.
3.2 Research Subject and Instrument:
The main purpose of this study is to monitor the percentage of depression articles on Facebook and impact of these post on other users. To evaluate performance and effectiveness of our experiment, we applied several software and open-source tools. The experiment was carried out in a computer with windows 10 operating system, programming language python and text editor Jupyter Notebook.
Table 3.2.1: Open-source Software/project found different Enterprise Repository Online Package
Name
Description URL Link
MATLAB R2021
MATLAB is a high-performance language for technical computing. It integrates computation, visualization &
programming in an easy-to-use environment where problems and solutions are expressed in familiar mathematical natation. It has inbuilt compilers for most popular coding languages like C, C++, java, python. It’s numerical computing environmental and programming language of 4th generation.
https://www.mathworks.com/
products/new_products/relea se2019a.html
Python 3.6.5
Python is an interpreted, object-oriented, high level programming language with dynamic semantics. Its high-level built-in data structures, combined with dynamic typing and dynamic binding; make it very attractive for Rapid application
https://anaconda.org/anacond a/python
©Daffodil International University 20 development. Python supports modules
and packages, which encourages program modularity and code reuse. The language provides constructs intended to enable clear programs on both a small and large scale.
The libraries we used:
• Matplotlib
• NumPy
• Pandas
• Sklearn
• Seaborn
• Warnigs
Matplotlib: Pyplot is a set of functions include in the Matplotlib visualization packages.
Its features include adding a line plot label, defining the creation plot area of a shape, and so on.
NumPy: Numeric, which stands for python is NumPy, a collection of multidimensional array objects and algorithms for manipulating them. Arrays can be executed mathematically and rationally using NumPy. NumPy is a python scripting language. It is an abbreviation for “numerical Python”.
Pandas: panda is primarily used to analyse data. Pandas accepts in various file formats such as JSQN, SQL, and Microsoft Excel. Panda supports a variety of data manipulation features, including merging, resetting, selecting, organizing data and corrupting rungs.
Sklearn: Sklearn is perhaps python’s most helpful machine learning library.
Classification, regression, clustering, and dimensionality reduction are just a few of the useful capabilities in the sklearn package for machine learning and statistical modelling.
Seaborn: Seaborn is python data visualization toolkit based on Matplotlib. Then, at the start of your python code, include import seaborn as ans.
©Daffodil International University 21 Warnigs: When the user must be notified of specific conditions in a program, the condition(generally) does not warrant an expectation, and the application is closed, warning messages are often sent.
3.3 Data collection procedure:
Data collection is a technique of obtaining and measuring data on aspects of interest in a structured, exact manner that enables one to address to state research questions, test hypotheses, and assess outcomes.
In the age of internet, people are much more active on social media. people share everything that happened to them on social media. since, Facebook is a popular medium of expression of mind, in this study we have chosen Facebook to collect data for detecting depression.
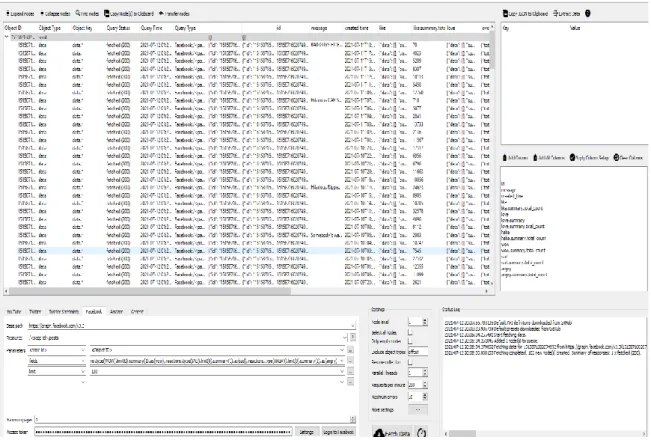
We have collected data from Facebook using face-pager tool.
Face-pager Tool:
Face pager is a web application created by Jakob Junger and Till Keyling for automatic data retrieval (2019).
It can retrieval social media from Facebook and amazon most notably comment tracks. The program comes with a variety of presents that may be tweaked with settings to get the data you want.
Face pager is a web-based tool that helps to extract social media data from Facebook. To collect data from Facebook, the following parameters were utilized.
• id
• message
• created_time
• like.summary.total_count
• love.summary.total_count
• haha.suumary.total_count
• sad.summary.total_count
• angry.summary.total_count
©Daffodil International University 22 Fig:3.3.1: Fetches Data from Facebook using face pager tool
Our data set carries information about the Facebook post, when the post was created and what reactions were made to those posts.
Table: 3.3.1 Information of Depression Data set
Dataset information Quantity
Total number of Facebook post 1500
Depressed post 1200
Non depressed post 300
Table 3.1.1 Shows that total amount of data we have stored is 1500. Here the amount of depressive data is 1500 and non-depressive data is 300.
©Daffodil International University 23 Fig:3.3.2: Depression Dataset
Label encoder:
We generally work with dataset that have numerous labels in one or more columns in machine learning. Label in the from of words or numbers can be used. Training data is frequently labelled in terms to make it understandable or human-readable. Encoding of labels is the process of translating a label into a numeric representation that a computer can interpret. Algorithms that utilize machine learning can batter select how to use these labels.
It is a crucial pre-processing step for structured data sets in supervised learning.
3.4 Statistical Analysis (a)Data Analysis:
Information inquiry is the process of cleaning, altering, and modelling data in order to expose relevant facts. Information examination is a technique for extracting essential facts from data and making decisions based on such data. A basic instance of data inquiry is that whenever we make a decision in our daily lives, we determine the time by recalling what happened recently. It’s only a matter of looking back or forward in the time and making decision based on experiences. To reach the conclusion, we have gathered memories from the past as well as our trust over a lengthy period of time
A data set is a basic form that constrains the user’s ID and text. And ID is a unique identifier and text for each user of social network, showing how people express their thoughts on a social media. At the same time, each text contains some information about the date, time, text, and response to the text.
©Daffodil International University 24 (b)Data processing:
The process of creating raw data for machine learning models is known as data preparation.
When crating a machine learning model, that is the first and most important stage. When working with data, it is also necessary to clean it and save it in a formatted state.
We First collected raw data from Facebook and the information we collected data that was unlabelled. Then we manually labelled the data. For cleaning and pre-processing we used following procedure.
• Removed the stop word.
• Remove the link were present in the comment.
• Find duplicate data and removed it.
• Sometimes the article after deleting the top is empty and has been deleted (c)Building Truth dataset:
The term of dataset refers to a collection of data samples. Multiline images, music, text, digital matrices, and even excel spreadsheets can be used as data. When doing machine learning, it is always need to set of real data. The annotation has been applied to the terrain truth data set, which is similar to the traditional dataset. Note that box drawn above the image, the text identifying the sample, the new column in the spreadsheet, or anything else that the machine learning system must to generate are examples.
Our data set consists of a total 8 column including parent comment, created time, label and all reactions (like, wow, ha-ha, sad, angry).
We used a few steps to create our dataset containing ground-truth dataset. We’ve categorized the comments shared by users into depressed or non-depressed. Labelled by 1 if depressed and by 0 if not depressed.
Table 3.4.1: Example of depressed and non-depressed post
Examples label
Children are bound to feel anxious about returning to school; 1
“I feel terrified when I hear an explosion or the sound of a military plane. “As the world battles COVID-19.
1
©Daffodil International University 25 All over the world, young people are trying to cope with the
challenges of the COVID-19 pandemic. Known that you’re not alone, and we’ll get through this together.
0
Me and my friends live in the same neighbourhood and we used to do lots of things after school.
1
I lost my house yesterday morning due to the storm….I lived there 24 years.
1
These health workers cross rivers, mountains and desert- whatever it takes to deliver vaccines and protect every last child
0 Personally, it’s been difficult to keep a steady mind 1
Table 3.3.3 is despite the example of depressed and non-depressed post of our dataset.
(d)Feature Extraction:
Any machine learning algorithm’s output is heavily influenced by feature extraction. At a fundamental level, the nature of the order in defined by the qualities in the neighbourhood of discovering the features from the currently selected category stored Facebook posting.
There are lexical, hyperbolic, realistic, and other kinds, to name a few.
Descriptions of frustration and performance. In the frustrating post, we showed different features. User psychology, the essence of the post is as follows:
Psychological of characteristics level. such as mental processes, sensory processes, social processes, cognitive processes, perception processes, biological process, kinetic energy, time adaption, theories relatively, personal concerns language processes verbs, sums, other negative grammatical verbs, adjectives, compressions, questions, number calculation these higher-level parts are further divided into gender, phycological-biological processes and health effective processes anxiety, anger, sadness, positive emotions, negative emotions etc. Family, friends me and women understand the process of seeing, hearing and feeling.
(e)Training and Testing data:
A large dataset used to learn a machine learning model is called training data. Although the idea of using training data in machine learning techniques is simple, it is fundamental to how these techniques work. A test set is a collection of impressions used to access how well a show is executed using various execution techniques.
©Daffodil International University 26 For our experiment, we have 70% training data and 30% test data in our data set.
(f)Classification Model DT (Decision Tree):
A Decision Tree is a strategy for identifying strategies for splitting a dataset into numerous parts depending on different factors under non-parametric supervision. It creates a model the presides the value of an ideal variable by derogating the basic decision rules of the data characteristics.
The ID3 (by Quinlan) algorithm is the basic method used I decision trees. The ID3 method uses a top-down, greedy technique to create decision trees. The algorithm chooses the characteristic the best classifies the characteristic that best classifies the local training samples at each node. The procedure is repeated until the tree has been correctly categorized or all characteristics have been used.
Data acquisition is a statistical characteristic that assess how well a feature separates training instances based on its categorization objective.
Fig 3.4.1: High Data Gain
High information gain
©Daffodil International University 27 Fig:3.4.2: Poor Data Gain
As seen in fig:3.4.1 high data gain split information into an uneven number of positive and negative groups, making it easier to distinguish between them but in fig: 3.4.2 a characteristic of poor data gain splits the data fairly evenly and does not move us any closer to a conclusion.
In order to correctly describe information gain, we must first define entropy, a measure of impurity in a set of instances that frequently employed in information theory. It is mathematically defined as:
𝐸𝑛𝑡𝑟𝑜𝑝𝑦: ∑ −𝑝 ∗ log2(𝑝𝑖)
𝑖=1
ID3 algorithm’s simplest version deals with classification that are either positive or negative, we may define entropy as:
𝐸𝑛𝑡𝑟𝑜𝑝𝑦(𝑆) = −𝑝+log2𝑝+− 𝑝−log2𝑝−
S is an example of a training scenario
The proportion of positive example in S is $p_ +$
The proportion of negative example in S is $p_-$
Now data gain has been defined as measure of the effectiveness of a feature in the classification of training data, entropy has been given as a measure of error in training
Low information gain
Pi = probability of classi
©Daffodil International University 28 instances. For, example in relation to a sample of S, the gain of a property of A given as the definition of profit (S, A):
𝐺𝑎𝑖𝑛(𝑆, 𝐴) ≡ 𝐸𝑛𝑡𝑟𝑜𝑝𝑦(𝑆) − ∑ 𝑟𝑎𝑐|𝑆𝑉||𝑆| ∙ 𝐸𝑛𝑡𝑟𝑜𝑝𝑦(𝑆𝑣)
𝑣∈𝑉𝑎𝑙𝑢𝑒𝑠(𝐴)
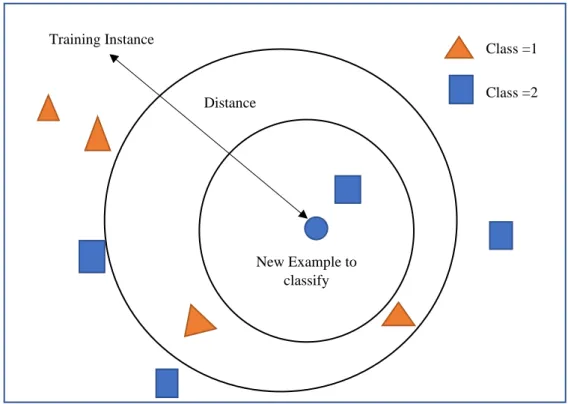
KNN (K- Nearest Neighbours):
K-Nearest Neighbours (KNN) is a simple yet but effective classification method. the goal is to predict the classification of new sample points by using a database to classify data points into separate categories and make them available for KNN classification. A majority of an item’s neighbours vote to classify it, and the object is given to the most common class among the K nearest neighbours.
Fig3.4.3: KNN representation
Fig 3.4.3 despite that the representation of K Nearest Neighbour algorithm. The KNN algorithm is a non-parametric algorithm, which means that it does not make assumptions about the underlying data. It can be used for regression and classification, but is mostly commonly used for classification, but it is most commonly used for classification problems.
New Example to classify Distance
Training Instance
Class =1
Class =2
©Daffodil International University 29 During the training phase, KNN simply saves the dataset and then classifies it when new data is received.
There is no single way for determining the greatest value of “K” we must try a verity of options to find the best one. The value of K that is most commonly used is. Low K values (for example, K=1 or K=2) might induce noise in the model and cause outlier effects.
KNN method that conducts aggressive feature selection and is suited to text classification.
Conceptually, each example is called document x, called an instance, is represented as a vector of length |F|, the size of the vocabulary:
< 𝑤1(𝑥), 𝑤2(𝑥), 𝑤3(𝑥), … , 𝑤𝑓(𝑥) >
Where wj(x) is the weight of the jth term. The cloud of the weight will be set according to different criteria, such as: frequency, or a score assigned to the feature divide the examples into sets of classes.
SVM (Support Vector Machines):
The Support vector Machine (SVM) is a collection of supervised learning algorithms for classification, regression, and outlier identification. The maximum edge classifier or maximum edge hyperplane is the decision boundary generated by SVM. Certain forms of SVM, such as support vector regression (SVR), which is an extension of support vector classification, can be used for specific machine learning challenges (SVC). SVM differs from previous classification algorithms in that it chooses the decision limit in such a way that it chooses the decision limit in such way that it chooses the decision limit in such a way that it optimizes the distance between all classes nearest data points.
©Daffodil International University 30 Fig 3.4.4: Working procedure of SVM model
Fig 3.4.6 shows the working procedure of SVM model. First, we will train the model with training data and predict accuracy. Then we will test the accuracy again with the new data with the testing data and find out the output.
The purpose of SVM in the cases of linear frequency divider hyperplane that clearly distinguishes the two classes. The maximum division margin is equal to the difference between the two division margins. The geometric distance between the two species in space.
Text and hypertext classification are possible for both promotional and conductive methods. It classifies documents into different categories using training information.
Calculate a score for each document and compare it to a predefined threshold number.
When the score of a document exceeds a certain threshold, the document is assigned to specific class. Consider it a general document if it does not exceed the threshold value.
Ensemble: Ensemble modelling improve the accuracy of predictive analytics and data mining application by running multiple related but different analytical models and integrating the results into single score or spread. The ensemble integrates a number of theories to develop good hypotheses. Ensemble method are also called as classifier combination method. Ensemble methods are meta-algorithms which combine combines multiple machine learning techniques into one predict model to do.
Model Training
Prediction
Output
New Data Training Data
Testing Data
©Daffodil International University 31 Fig3.4.5: Working procedure of ensemble method
Fig 3.4.7 shows the working procedure of ensemble method. Ensembel methods can be devided into two groups:
• Sequential ensemble method
• Peralal ensamble method
Two of the most straightforward ensemble procedures are averaging and voting. They are simple to comprehend and apply, with voting being used for classification, and averaging for regression.
In the case of regression, the ensemble prediction is calculated as average member of prediction.
𝑝 =𝑝1+ 𝑝2+ 𝑝3 3
In the case of predicting a class label is predicted using mode of member predictions and the predicting class probability is calculated as the argmax of the summed probabilities for each class label.
A weighted average ensemble methos that allows many models to contribute prediction based on their confidence level or predictive performance. Since the model contribute equally to the prediction, the model average set of limits.
𝑤1+ 𝑤2+ 𝑤3 = 1
Model 1 Model 2 Model 3
Input
Prediction Ensemble
model
©Daffodil International University 32 Most ensemble-based system are not influenced by the base classifier used to build the ensemble, which is a significant advantage since it allows the adoption of a specific type of classifier that known to be most suitable for given application.
Improve to increase the accuracy of the classification by reducing the diversity of classifier output, ensemble-based systems have now been shown to be highly effective in various problem areas where it is difficult to operate model-based system.
Random Forest: It is a machine learning method for solving random forest classification and regression problems. Random forests are many simple and widely used of machine learning techniques that can yield good result without changing hyperparameters. One if the most widely used algorithms is its simplicity and adaptability. We used ensemble learning. This is a strategy that gathers many masters to solve difficult problems.
Random forest is a supervised learning method. It typically learns using a “bagging”
approach to create a “forest” from a collection of induvial trees. The basic premise of the bagging method is that by combining multiple learning models, the end results improved.
The random forest has the advantages of being able to take the advantage of being able to take advantage of all the classification task regression tasks that makeup most of modern machine learning systems. Since taxonomy is often considered building block of machine learning, lets take a look at the random forest of classification.
The result of random forest classification is obtain using an integrated technique. Various decision trees given educational information. Observation and characteristics in this data collection are chosen at random throughout the node splitting process.
Arain forest system employs a variety of decision trees. A decision tree has three sorts of nodes: decision nodes, leaf nodes, and the root node. The leaf node of each tree reflects the final conclusion of the particular decision tree. A majority-voting system is used to choose the final product. In this case, the rain forest system’s ultimate output is the one picked by the majority of decision trees. The figure below shows the sample of random forest classifier.
©Daffodil International University 33 Fig:3.4.6: Working procedure of random forest classifier
Fig 3.4.6 shows the working procedure of random forest classifier.
3.5 Implementation Requirements
We’ve decided a methodology for carrying out the recommended research strategy. The goal of our work is to gather posts from Facebook when people are more active during the lock down. And we’ve gathered feedback from other users in these posts. Our research aims to determine how other people react to depressed post. When users view other people negative posts, they often get depressed themselves.
The whole process is divided into three distinct stages. The whole study project is organized around these three steps:
• Data processing.
• Application of selected method
• Comparison of results.
Dataset
DT DT DT Dt
M1 M2 M3 Mn
M
d
output
©Daffodil International University 34 Figure3.4.7: flow chart of working procedure
To process the data, we first removed the stop words from data set. The data has been tokenizing after removing stop word. The frequency of stop word is extracted after tokenization.
After vectoring from word, we applied some popular machine learning method to find out the accuracy of data set.
After applying the machine learning methods, we got the best accuracy compared to the other method and it discussed in details in chapter four.
Pre-processing (Data Cleaning)
Applying Algorithm (DT, KNN & Ensemble)
Find out best result by comparing result