© Daffodil International University
POPULARITY ASSESSMENT OF CRICKET PLAYER BASED ON BANGLA TEXT IN SOCIAL MEDIA
BY
Yeasir Arefin Tusher ID: 152-15-5944
Md Rubel ID: 152-15-6037
AND Raisa Tabassum
ID: 152-15-6022
This Report Presented in Partial Fulfillment of the Requirements for the Degree of Bachelor of Science in Computer Science and Engineering
Supervised By
Md. Tarek Habib
Assistant Professor Department of CSEDaffodil International University
Co-Supervised By
Md. Sadekur Rahman
Assistant Professor Department of CSE
Daffodil International University
DAFFODIL INTERNATIONAL UNIVERSITY DHAKA, BANGLADESH
MAY 2019
© Daffodil International University iii
ACKNOWLEDGEMENT
First, we express our heartiest thanks and gratefulness to almighty God for His divine blessing makes us possible to complete the final year project/internship successfully.
We are really grateful and wish our profound our indebtedness to Md. Tarek Habib, Assistant Professor, Department of CSE, Daffodil International University, Dhaka. Deep Knowledge & keen interest of our supervisor in the field of “Natural Language Processing”
to carry out this project. His endless patience, scholarly guidance, continual encouragement, constant and energetic supervision, constructive criticism, valuable advice, reading many inferior drafts and correcting them at all stage have made it possible to complete this project.
We would like to express our heartiest gratitude to Dr. Syed Akhter Hossain, Professor and Head, Department of CSE, for his kind help to finish our project and also to other faculty member and the staff of CSE department of Daffodil International University.
We would like to thank our entire course mate in Daffodil International University, who took part in this discuss while completing the course work.
Finally, we must acknowledge with due respect the constant support and patients of our parents.
© Daffodil International University iv
ABSTRACT
Social media has turned into a center field of Data Mining in the most recent decade, in light of the fact that the utilization of internet based Social media has been expanded in all respects quickly. In this research, the most popular social media Twitter has been focused by us, where users can post their opinion, sentiment or expression within 140 characters with various issue of interests, such as Politics, Entertainment, Sports, Lifestyle etc. Twitter is particularly famous on different fields for example sentiment analysis, emotion detection, trend detection and so on. They give API's to data miner which are exceptionally helpful for picking up user’s data for analysis. In our research, we have collected tweets about some cricket players of Bangladesh National Cricket team written in Bengali language. We construct a model to predict whether a tweet is positive or negative and compute player’s popularity by figuring out the complete number of positive tweets about every player. However, sentiment analysis of Bengali text is very difficult and complicated task due to lack of language resource. We used various Machine Learning algorithms and compared them with each other to get the best accuracy.
© Daffodil International University v
TABLE OF CONTENTS
CONTENS PAGES
Board of examiners i
Declaration ii
Acknowledgements iii
Abstract iv
CHAPTER
CHAPTER 1: INTRODUCTION 1-4
1.1 Introduction 1
1.2 Motivation 2
1.3 Rationale of the Study 2
1.4 Research Questions 3
1.5 Expected Output 4
1.6 Report Layout 4
CHAPTER 2: BACKGROUND 5-9
2.1 Introduction 5
2.2 Related Works 6
2.3 Research Summery 8
2.4 Scopes of the problem 9
CHAPTER 3: RESEARCH METHODOLOGY 10-19
3.1 Introduction 10
3.2 Research Subject and Instrumentation 10
3.3 Data Collection Procedure 11
3.4 Statistical Analysis 12
3.5 Implementation Requirements 14
© Daffodil International University vi CHAPTER 4: EXPERIMENTAL RESULTS AND DISCUSSION 20-29
4.1 Introduction 20
4.2 Experimental Results 20
4.3 Descriptive analysis 26
4.4 Summery 29
CHAPTER 5: SUMMARY, CONCLUSION, RECOMMENDATION AND IMPLICATION FOR FUTURE RESEARCH 30-32
5.1 Summary of the Study 30
5.2 Conclusions 31
5.3 Recommendations 31
5.4 Implication for Further Study 32
APPENDIX: A 33
REFERENCES 34-35
© Daffodil International University vii
LIST OF FIGURES
FIGURES PAGES
Fig 3.3.1 TwitterPiCollector 12
Fig 3.4.1 13
Fig 3.4.2 13
Fig 3.5.1 Pre-Processing Ventures 15
Fig 3.5.2.1 Word Embedding 18
Fig 3.5.2.2 Padding 19
Fig 4.2.1 Confusion matrix for Logistic Regression 21
Fig 4.2.2 Confusion matrix of MNB 22
Fig 4.2.3 1D Convolution 23
Fig 4.2.4 Model Architecture 25
Fig 4.2.5 Accuracy, Loss, Confusion matrix 26
Fig 4.3.1 Precision, Recall, F-measure Score 28
Fig 4.3.2 Popularity Score 29
© Daffodil International University viii
LIST OF TABLES
TABLES PAGES
Table 3.5.1.1 Data Cleaning and Pre-Processing 16
Table 3.5.2.1 Ratio of Training and Testing 17
Table 3.5.2.2 Vectorize without N-gram 18
Table 3.5.2.3 Vectorize with Bi-gram 18
Table 4.2.1 Accuracy for logistic regression 21
Table 4.2.2 Accuracy of MNB 22
Table 4.2.3 Accuracy 26
Table 4.3.1 Model accuracy 27
© Daffodil International University 1
CHAPTER 1
INTRODUCTION
1.1 Introduction
Gathering information is an important part of our daily life. Daily we search our news feed what's new on today and also hunting for interesting topics on social media. Social media has been considered as the center region for information mining as it contains the client information as remarks, audits, posts, likes hates and furthermore different stages like Blogs, Forums, bring with heaps of client created information. The information on the social media incorporates the feelings of the client for example how decidedly or contrarily the client is composing his remarks or surveys. The energy and the cynicism include the critical traits portraying client's mind-set and feelings.
Sentiment analysis is an important field in natural language processing in the present world. It enhances its popularity on social media very rapidly. Many works have already been done in this field for example business sector uses sentiment analysis for product review by using a piece of text from social media posts and comments, and reduced the time complexity of an organization.
Sentiment analysis on natural language processing is a process by which we can analyze a person’s opinion, emotion, attitude. It is done by sentiment analyzer tool which is involved with machine learning algorithms. Almost every sentence has some specific words which express whether the sentence is positive or negative or neutral by using sentiment analysis tools which detect the polarity (i.e., positivity, negativity) of a string of sentence. Thus, it provides us sentiment about an individual.
In the present world, Bangla is spoken as the first language by almost 200 million people where 160 million people are Bangladeshi. There are approximately 3 billion people using social media worldwide where 95.13% of people uses Facebook and 1.35% people uses Twitter in Bangladesh. Most of the Bangladeshis are reliable to express and share their thoughts and opinions on microblogging and social networking sites like Facebook, twitter etc. by means of writing blogs, posts, comments which contains a person’s point of view in Bangla Language.
© Daffodil International University 2 Though many works have been done with product reviews, Popularity measurement of a specific individual from social media has been done in English but not done in Bangla yet. So, this is the main purpose of our research. Popularity measurement is the process of finding the popularity of an individual which demonstrates how much an individual is popular in a particular field for example, it would be an athlete, a dancer, a singer, a politician etc. Every person has their own opinion about some popular fellows and they would like to share their opinions in social media which contain positive and negative opinions about the popular ones. So, in our research, we demonstrated a model that can rank popularity of some cricket players.
1.2 Motivation
Cricket is the most popular game in Bangladesh. There is an exhilaration when a tournament is played and people clap their hands when a player scores higher and takes wicket. Thus, they take attraction from people, but the opposite happens when a player cannot do well.
Sometimes we can see the ranking of player by their popularity on the newspaper. But these popularity changes by time and our point is here to take benefit of it. This research will be based on finding popularity of a player of a specific time.
People share their contemporaneous thoughts on social media as well as micro- blogging sites like as Face-book, Twitter, BlogSpot etc. Natural language processing i.e. sentiment analysis is very lengthy and old process. Many works have been done on this field but not in Bengali. So, we get motivated to take a part of enriching Bengali language.
1.3 Rationale of the Study
Dataset for Bengali text is rare. There are some available data, but they are outdated and one more thing is that no work has been done to find popularity of specific person especially Bangladeshi cricket players. To find popularity of a specific time we need updated data.
© Daffodil International University 3 Our first goal is to build a tool which will automatically give us updated data, extract sentiment from them whether it is positive or negative and our second approach is to find popularity of some cricket players of Bangladesh National Cricket team. As no work has been done to finding popularity, so our work on this research will be slightly different and unique from others.
1.4 Research Questions
Every larger problem has been solved by solving the smaller portion of it. Things are being complex by combining the simplest objects. To understand the actual problem of this research we need to first understand the subproblem of this. So, in this section we will try to understand the sub-problems first. We have selected the following problems which will be answered in this paper stepwise.
1.4.1 Data collection
The gist of our all work is the data. So, what is data and how to collect them? It is the most important and the challenging task.
1.4.2 Features of data
After getting data we need to prepare it for future work and find some features for machines to work with it. So how to prepare data and what features we extract from it?
1.4.3 The model
There are many types of way to go with, I.e. Machine Learning is one of them. So how much data we will give machine to learn and how much to test? Another point is which algorithm will give us the best accuracy?
1.4.4 Compare result
To find the most accurate result we need to apply different types algorithms and compare them one with another which is quite difficult task.
© Daffodil International University 4
1.5 Expected Output
The main motive of our research is to find reputation of person I.e. Bangladeshi cricket players and also find a list of ranking by popularity. Our first target is to trace whether the sentence has positive value or negative. The model's efficiency will be experimented by the way of usage of various kinds of machine learning algorithm. We will also test how good algorithms response to testing data. Our research has some sub- objectives such as – to get the most accurate result.
1.6 Report Layout
This paper is organized in a such way that will help us easily to understand the actual goal and the working procedure. It is written by following the standard project reporting template of Daffodil International University which is mainly structured into 5 sections.
Chapter 1, which is this chapter discusses all about our research motivation, rationale of the study, research question and expected outcome.
Chapter 2, the following chapter includes the background details of Bangla Language Processing, also the concise history of Sentiment identification, scope of the problem and its challenges.
Chapter 3 gives us detailed information about our research methodology and techniques which we used including the process of data collection and methods of determining sentiment of a sentence. It also provides statistical analysis of our research.
Chapter 4 brings up the experimental result of applied algorithms and techniques as well as descriptive analysis of our work.
And finally, Chapter 5 tells about limitations, conclusions, future works, and a summary of the research.
© Daffodil International University 5
Chapter 2
Background 2.1 Introduction
Social media has become a core field of data mining in the last decade, because the use of social media has been increased very rapidly. In this research, the most popular social media Twitter has been focused by us, where users can post their opinion, sentiment or expression within 140 characters with various issue of interests, such as Politics, Entertainment, Sports, Lifestyle etc. Twitter is very much popular on various fields e.g. sentiment analysis, emotion detection, trend detection etc. They provide API's for data miners which are very useful for gaining users data for analysis.
In our research, we have collected tweets about some cricket players of Bangladesh National Cricket team written in Bengali language. We build a model to predict whether a tweet is positive or negative and compute players popularity by calculating total number of positive tweets about each player. The proposed system basically extracts tweets in a specific time series for finding the featured players. However, sentiment analysis of Bengali text is very difficult and complicated task due to lack of language resource.
To overcome the complexity and find out the popularity of a single player we firstly labeled each tweet whether it is positive or neutral, as our main goal is to determine popularity; so, we merged other sentiment as neutral. Finally, we have summarized the output in percentage value and sorted the final result.
© Daffodil International University 6
2.2 Related Works
Previous works on English text mining focused on Emotion detection, Sentiment Analysis, Trend Detection etc. In 2009, Paul Ferguson and his group took a shot at paragraph level investigation to expand exactness of report level assumption examination [1]. As of late, two analysts named Pamunkeys and Putri (2017) chipped away at word sense disambiguation for the lexical-based feeling investigation [2]. Till now, a great deal of work has been done on area-based investigation utilizing word library. For instance, Cruz Laura and his group (2017) composed a section about applying lexical library for fixed domain [3].
Devina Ekawati and Masayu Leylia Khodra took a shot at (2017) viewpoint-based survey examination [4]. Sentence-based notion investigation was finished by Alexandre Trilla and Francesc Alías (2013). They attempted to actualize this to improve precision in their content to discourse program [5]. Parinya Sanguansat (2016) attempted to execute paragraph to vector for business information examination from web-based social networking [6]. Huy Nguyen and Minh-Le Nguyen (2017) worked on sentence-level sentiment analysis on different social medias like twitter, and their focus was on the improvement of the accuracy of the sentence-level analysis [7]. They have proposed another technique for the improvement of their outcome.
Specialist Mike Thelwall (2016) chipped away at the opinion quality detection program named SentiStrength that was created amid the Cyber Emotions venture [8]. It was created to identify the quality of assumptions communicated in social Webtexts. In his work, he depicted how SentiStrength works utilizing lexical methodology andusing its own principles and terms. Scientist Soumi Dutta and his group (2015) worked on sentiment analysis of online content using WordNet [9]. S. M. Mazharul Hoque Chowdhury and his group (2019) analyzed paragraph level sentiment with step by step process using lexicon-based approach. They tried to analyze different types of data using existing method which are created by other researchers [10]. In their examination, they proposed a strategy utilizing WordNet to distinguish assumption from various social media. Therefore, it tends to be said that a ton of research has been done and still in process to increment the precision, grow new arrangements, make new instruments.
© Daffodil International University 7 All researches are done a lot on English language and some other languages. Previous works on Bengali text mining focused on Emotion detection, Sentiment Analysis, Trend Detection etc. So, our rest of the research part has contained our mainly focused area which is Bangla language. Md. Al-Amin and his group claimed that they proposed a new approach for extracting sentiment classification from 1600 Bengali comments of blogs and articles. They use word embedding and word2vec approach to obtain word level sentiment and the Unification of the two proposed approach gives them 75.5% of accuracy [11]. Kamal Sarkar and Mandira Bhowmick tried various combination of n- grams and sentiWordNet features to find best combination of features and their observation says that, SVM classifier trained with unigram and sentiWordNet features performed best performance [12]. Sanjida Akter and Muhammad Tareq Aziz applied Machine Learning and Lexicon based Hybrid approach to classify sentiment on facebook group posts and comments [13].
Animesh Kumar Paul and his team first applied Multinomial Naïve Bayes (MNB) and negation handling on Bangla data. They used amazons watches dataset which contains 68356 reviews for both English and Bangla [14]. Shaika Chowdhury and her team constructed a semi-supervised bootstrapping approach to develop a training corpus which do not need manual annotation. Their binary classifier approach did a very good accuracy using various combination of features [15].
Md. Asimuzzaman and his team used some Bangla tweets as their training data and Supervised Adaptive Neuro-Fuzzy Interface System to predict the sentiment [16].
Kamal Sarkar created CNN (convolutional neural network) and DBN (deep belief network) based model on 1000 and 6225 bangla words for comparing with other machine learning approaches [17]. Their experiments revealed that the performance of their proposed CNN (Convolutional Neural Network)-based system is better than their implemented DBN (Deep Belief Network)-based system and some existing Bengali sentiment polarity detection systems.
In trend detection, though a few works have been done which is focused on English language, no work has been done on Bangla language before. So, in this part we represent the appearance of trend detection in English from previous work.
Dhananjay C. Dandapat and his team analyzed the popularity detection of Television media in business intelligence using tweet data [18]. They used TF-IDF weighing
© Daffodil International University 8 scheme to calculate distance between tweets and cluster and then pick the clusters based on highest score.
2.3 Research Summery
By reviewing most, the works on the above 2.2, we can see that Sentiment analysis on social tweets has been done a lot work focused on English text mining but not enough for Bangla text mining. Since our main focus is Sentiment analysis on Bangla tweets.
So, we can see most of the works have been done with tweets, facebook posts, comments etc. One of the studies constructed a corpus from Bengali comments of blogs and articles and applied word embedding method to this corpus [11]. Another work performing machine learning algorithms for finding sentiment from twitters of Bengali languages [12].
Emphasized the pattern of grammar and semantic of the sentences in the field of sentiment analysis in Bangla microblogs [16]. Comparing the performance of proposed CNN-based Bengali sentiment polarity detection model with the DBN-based model [17].
All of the work has been done by mining text and comparing with one method to another method on anonymous tweets which means no work has been done with specific area like trend detection on Bangla. Research is a composed method to discover arrangements of existing issues or issues that no one has dealt with previously. It very well may be utilized for taking care of another issue or it tends to be the extension of past work on a specific field. Our Research is on recognizing assessment extremity and opinion from Bengali content that is related with NLP (Natural Language Processing).
AI (Artificial Intelligence) is testing the person to surpass individual’s execution.
So, in this research, we researched on cricketers to detect how much a cricketer is popular for a specific time period. We collected continuously updated data from tweets named by each cricketer name and then labeled them by giving polarity on each sentence. Each data contains some specific words which denotes for the quantity of popularity. This process has been done by our proposed different algorithms and finally we picked an algorithm which satisfied us with highest accuracy.
© Daffodil International University 9
2.4 Scopes of the problem
Opinion mining from content is from early on a substance-based characterization which expound the idea from Natural Nanguage Processing including Machine Learning too.
Opinion mining is an intriguing field of study. These days, it has been adding qualities to the business as in light of the fact that estimation examination puts together its outcomes with respect to factor that are so naturally sympathetic, it will undoubtedly end up one of the major drivers of numerous business choices in future. Improved precision and consistency in content mining strategies can defeats the present issues.
Right now, as the following influx of information revelation, content examination is accomplishing high business values. In this research, we will break down Bengali content from Facebook status for finding related estimation of each sentence like positive or negative. Detecting popularity of each player, we will at that point attempt to discover particular opinion of each sentence like whether complement of an individual blogger is positive or negative or neutral about an individual cricketer. Every day we are haunting for exciting news and try to find out trendy talking about cricket.
Because of haunting of news feed from electric media, regularly we are searching about new trends by following some micro-bloggers page which consisted of opinion. Not exclusively will wagering sway the connection between associations, betting foundations, information suppliers, and the administration, it's as of now changing the manner in which fans can communicate with diversions. It also easy for a new fan to understand quickly which player is masterpiece for a particular time period and can choose a player to support on gaming period as an inspiration. It is also helpful for business sponsors to detect which player is perfect for them to sponsor and by this way the player can be on the top position of the market value.
© Daffodil International University 10
Chapter 3
Research Methodology 3.1 Introduction
This study aims at finding some cricket players popularity by predicting sentiment from tweets which are written in Bengali texts. This chapter contains detailed outline how the data can be collected and predict sentiment from them. The instrument that is used to extract the sentiment from Bengali text of tweets and also described the procedures that were followed to carry out this data extraction. In this chapter we also provide the methods which were used to analyze the data. Lastly, the implementation issues and requirements that were followed in the process are discussed
3.2 Research Subject and Instrumentation
This problem is in the domain of Natural Language Processing. Although the complete problem extended to popularity measurement of cricket players. The wide thought of the issue is what makes it dynamically exceptional to its sort. The problem can be connected with handle in every language available. Regardless, our research work is compelled to one language only, Bengali. The reason behind picking this language is the need of progress in Natural Language Processing. Various work done previously but it needs more attention as it is one of the most speaking language in the world.
Thusly we picked 'Bengali' as the chosen language for this research work.
For our research purposes, we have gathered 2952 Bengali sentences from Twitter that contains different sentiment. To bring out those tweets we use 'Raspberry Pi ' for running python script that extract twitter data using API key. Our work is to identify positivity or negativity of sentences by applying sentiment analysis techniques. Some well performed algorithm like Naïve Bayes, Logistic Regression, Deep Neural Network, Convolutional Neural Network, etc. are used in case of sentimental analysis.
© Daffodil International University 11
3.3 Data Collection Procedure
Internet based social sites like Twitter, Facebook and so on are a noteworthy center point for clients to express their sentiments on the web. Sentiment analysis which is likewise called opinion mining, includes in structure a framework to gather and analyze conclusions about the item made in blog entries, remarks, or surveys. We analyzed some cricket player’s popularity by their fans tweet. Twitter is very popular for providing API’s to data miner which are exceptionally valuable for picking up users tweets for research. We used twitter's 'STREAMING API' for collect the tweets about 13 different players of Bangladesh Cricket Team.
Twitter's Streaming API is a push of information as tweets occur in real-time. It is used for scrapping real time data. In our research, it is important to scrap real time data because of measuring popularity of a player in specific time. We wrote a python script that search for specific player’s name in twitter with the help of Streaming API key.
When people wrote about those names of players, the API push that tweet in our script and then the data has been saved into the disk in different CSV files. We searched for thirteen different players name in Bengali language from 1st October 2018 till 31st December 2018. The script has been run during 3 months continuously in a 'Raspberry Pi' which was ran in a Debian system. We named this bot as a “TwitterPiCollector”.
The tweets saved into the disk we have searched for, stored into 13 different CSV files.
Only few numbers of people write tweets in Bengali language, so that we didn't get huge amount of data. We have now total 2952 tweets about 13 different players name.
Figure 3.3.1 shows the architecture of TwitterPiCollector.
© Daffodil International University 12 Fig 3.3.1: TwitterPiCollector
In our dataset, we had a big number of positive data and rest of them carried out negative, neutral or any other sentiment. As our main goal is to determination of player’s popularity, so that we need only the positive data. That’s why we labeled positive as 1 and considered rest of them are neutral or as 0. Label annotation has been done and verified by many numbers of peoples.
3.4 Statistical Analysis
We run a python script with twitter streaming API using 'Raspberry PI' to gain data, querying for 13 different players name of Bangladesh cricket team in Bengali language.
We ran the API stream from 01 October 2018 till 31 December 2018. The Python Script Extracted live tweets in the real time when any people written any of the players' names in twitter. Now we have exactly 2952 data for our research. Per player data distribution is given in figure 3.4.1 and 3.4.2
© Daffodil International University 13 Fig 3.4.1
Fig 3.4.2
From those figures, we see that Mashrafee Murtaza (মাশরািফিবনমতু+জা) is the most featured player in social media. We got 617 tweets about him, where almost 280 or 45.3% are positive and rest of data contains other sentiment (e.g. negative, neutral etc.).
Also 439 times tweets about Tamim Iqbal (তািমমইকবাল) where 291 or 66.29% of them are positive tweets. Soumya Sarker (0সৗম3সরকার), Mahmudullah Riyad (মাহমুদু6াহিরয়াদ), Imrul Kayes (ইম8লকােয়স), Taskin Ahmed (তাসিকনআহেমদ) also have more than 50% of positive review in the range of number of tweets about them.
1000 200300 400500 600700
ইমর$লকােয়স
িলটনদাস মাহমুদু1াহ িরয়াদ
মাশরািফ মত56জা 8মেহিদ হাসান…
মুশিফক5ররিহম মু9ািফজুর রহমান
নািসর8হাসাইন সাি:র রহমান
সািকব আল… 8সৗম> সরকার
তািমম ইকবাল তাসিকনআহেমদ
Data distribution for each player
Positive data for each player Neutral Data for each player
20%0%
40%60%
100%80%
ইমর$লকােয়স
িলটন দাস মাহমুদু1াহ িরয়াদ
মাশরািফ মত56জা 8মেহিদ হাসান…
মুশিফক5র রিহম মু9ািফজুর রহমান
নািসর8হাসাইন সাি:র রহমান
সািকবআল হাসান
8সৗম> সরকার তািমমইকবাল
তাসিকন আহেমদ
Data distribution for each player
Positive data for each player Neutral Data for each player
© Daffodil International University 14 We also see that in Figure 3.4.1, Nasir Hossain (নািসর0হাসাইন) and Sabbir Rahman (সাি;ররহমান) has Lowest peak in the chart. That means people do not talk about them in the social media.
This chart provides us a summary of popularity assessment, where as a human being we can decide which player is most popular in this media. But computer cannot understand and decide by itself without knowing any knowledge. So, we need to train computer first about our model which is sentiment analysis based and after that it can understand and decide how to interact with our datasets.
3.5 Implementation Requirements
Above all else, the data was gathered through twitter API using python script and the data stored in CSV (Comma Separated Values) files. In this purpose we used
• Raspberry Pi (running Debian system and connected to the internet)
• Tweepy (to access Twitter API)
We labeled the data from CSV files using Microsoft Office Excel 2016. We build some Sentiment Analysis model on the dataset using Keras (It is capable of running on top of TensorFlow), Sckit-Learn library on python. We also used ‘keras.preprocessing’, NumPy, Pandas, Matplotlib for pre-processing, visualizing and analyzing dataset. We assessed the models by figuring diverse quality estimates like accuracy, precision, recall, f-measure using Sklern. All the usage and method were done in a 64 bit, Windows 10 machine.
For documenting our point, we have kept up a couple of steps. Portray Figure 3.5.1 demonstrating the pre-processing ventures of research methodology
© Daffodil International University 15 Fig 3.5.1: Pre-Processing Ventures
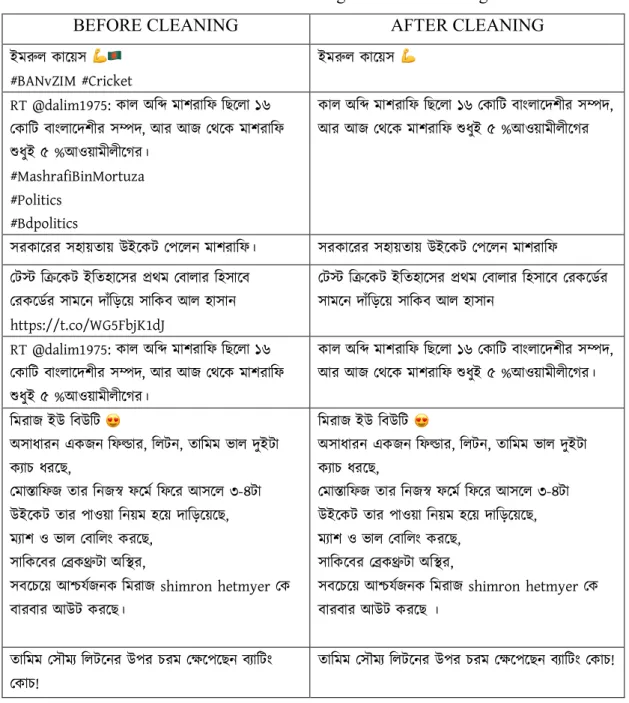
3.5.1 Data Cleaning and Pre-Processing
The noise and conflicting words are wiped out and more than one data resources are mixed. Twitter data also contains huge amount of links and stop words. We removed them but we didn't removed emoticons, because it also contains sentiment. Some tweets were mixture of Bengali and English. We convert the English words to Bengali manually. Hashtag and retweets have been deleted, because it doesn’t contain any sentiment. Extra space, New line and punctuation marks also been delated.
© Daffodil International University 16 Table 3.5.1.1: Data Cleaning and Pre-Processing
BEFORE CLEANING AFTER CLEANING
ইম8ল কােয়স 💪"
#BANvZIM #Cricket
ইম8ল কােয়স 💪
RT @dalim1975: কাল অি= মাশরািফ িছেলা ১৬ 0কািট বাংলােদশীর সDদ, আর আজ 0থেক মাশরািফ
ধুই ৫%আওয়ামীলীেগর।
#MashrafiBinMortuza
#Politics
#Bdpolitics
কাল অি= মাশরািফ িছেলা ১৬ 0কািট বাংলােদশীর সDদ, আর আজ 0থেক মাশরািফ ধুই ৫%আওয়ামীলীেগর
সরকােরর সহায়তায় উইেকট 0পেলন মাশরািফ। সরকােরর সহায়তায় উইেকট 0পেলন মাশরািফ 0টN িOেকট ইিতহােসর Pথম 0বালার িহসােব
0রকেড+র সামেন দাঁিড়েয় সািকব আল হাসান https://t.co/WG5FbjK1dJ
0টN িOেকট ইিতহােসর Pথম 0বালার িহসােব 0রকেড+র সামেন দাঁিড়েয় সািকব আল হাসান
RT @dalim1975: কাল অি= মাশরািফ িছেলা ১৬ 0কািট বাংলােদশীর সDদ, আর আজ 0থেক মাশরািফ
ধুই ৫%আওয়ামীলীেগর।
কাল অি= মাশরািফ িছেলা ১৬ 0কািট বাংলােদশীর সDদ, আর আজ 0থেক মাশরািফ ধুই ৫%আওয়ামীলীেগর।
িমরাজ ইউ িবউিট 😍
অসাধারন একজন িফUার, িলটন, তািমম ভাল দুইটা
ক3াচ ধরেছ,
0মাXািফজ তার িনজY ফেম+ িফের আসেল ৩-৪টা
উইেকট তার পাওয়া িনয়ম হেয় দািড়েয়েছ, ম3াশ ও ভাল 0বািলং করেছ,
সািকেবর 0\ক]টা অি^র,
সবেচেয় আ_য+জনক িমরাজ shimron hetmyer 0ক বারবার আউট করেছ।
িমরাজ ইউ িবউিট 😍
অসাধারন একজন িফUার, িলটন, তািমম ভাল দুইটা
ক3াচ ধরেছ,
0মাXািফজ তার িনজY ফেম+ িফের আসেল ৩-৪টা
উইেকট তার পাওয়া িনয়ম হেয় দািড়েয়েছ, ম3াশ ও ভাল 0বািলং করেছ,
সািকেবর 0\ক]টা অি^র,
সবেচেয় আ_য+জনক িমরাজ shimron hetmyer 0ক বারবার আউট করেছ ।
তািমম 0সৗম3 িলটেনর উপর চরম 0aেপেছন ব3ািটং
0কাচ!
তািমম 0সৗম3 িলটেনর উপর চরম 0aেপেছন ব3ািটং 0কাচ!
Table shows some example of data cleaning and pre-processing. Sometimes people used emoticons without any space. This will be problematic for feature selection. We added extra space for those emoticons.
3.5.2 Splitting Training and Test data
© Daffodil International University 17
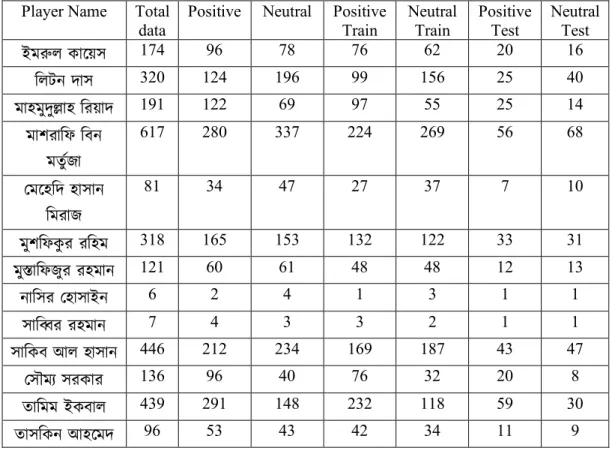
After cleaning and pre-processing we separate positive and neutral data for each player from 13 separate files containing labeled data. After doing that, we took 20% positive and neutral data as testing data from all of those separate files. When train and test split has been done, we combined all training data in a CSV file and also did that thing for testing sets. This procedure preserves the ratio of training and testing for positive and neutral data of each player.
Table 3.5.2.1: Ratio of Training and Testing Player Name Total
data
Positive Neutral Positive Train
Neutral Train
Positive Test
Neutral Test
ইম8ল কােয়স 174 96 78 76 62 20 16
িলটন দাস 320 124 196 99 156 25 40
মাহমুদু6াহ িরয়াদ 191 122 69 97 55 25 14
মাশরািফ িবন মতু+জা
617 280 337 224 269 56 68
0মেহিদ হাসান
িমরাজ
81 34 47 27 37 7 10
মুশিফকুর রিহম 318 165 153 132 122 33 31
মুXািফজুর রহমান 121 60 61 48 48 12 13
নািসর 0হাসাইন 6 2 4 1 3 1 1
সাি;র রহমান 7 4 3 3 2 1 1
সািকব আল হাসান 446 212 234 169 187 43 47
0সৗম3 সরকার 136 96 40 76 32 20 8
তািমম ইকবাল 439 291 148 232 118 59 30
তাসিকন আহেমদ 96 53 43 42 34 11 9
3.5.3 Feature Selection
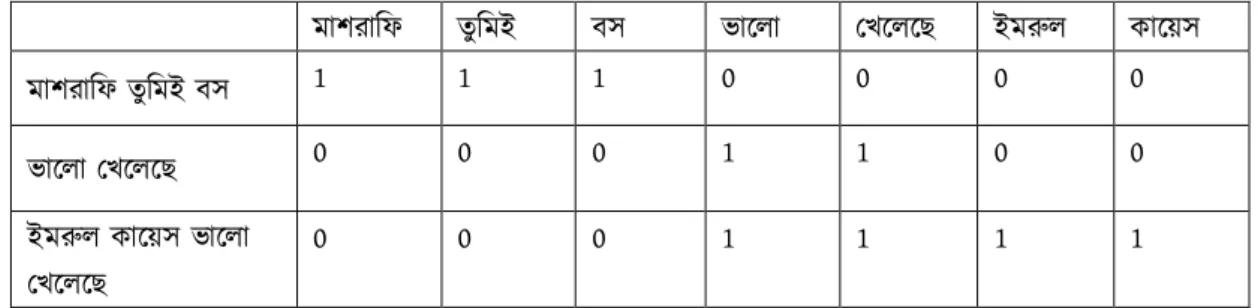
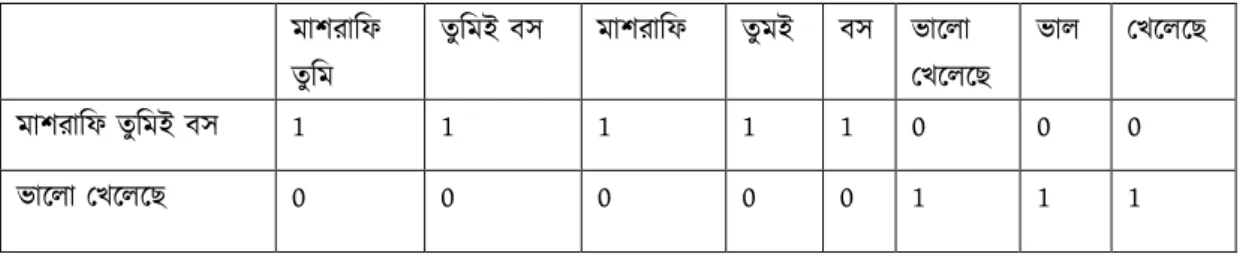
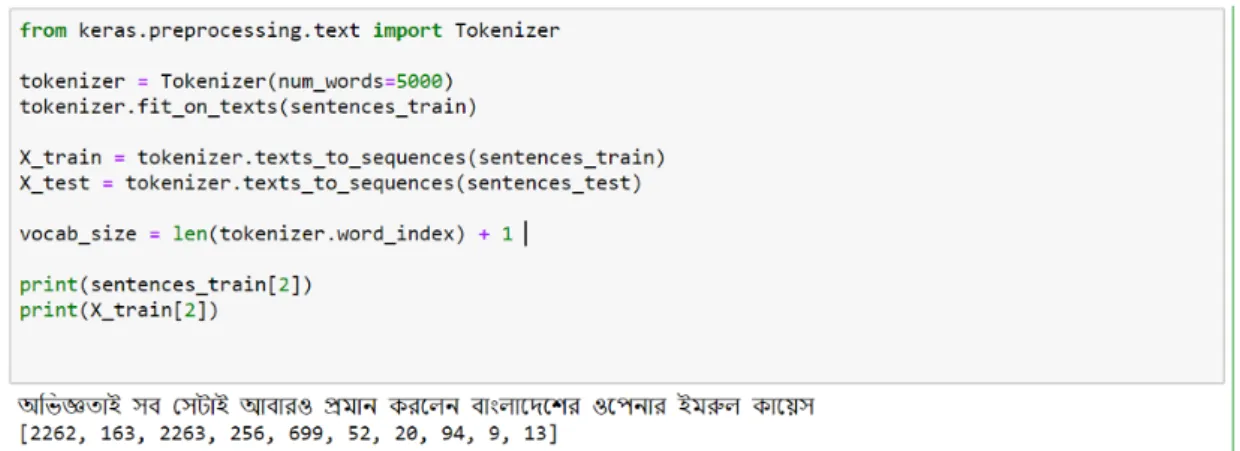
Feature extraction from the pre-preparing dataset is an essential part, to know the capacity of the calculations it helps a great deal. We have used 2952 tweets as our training and testing set. We used quite a few feature selection techniques to find best result. First of all, we used count vectorizer from Scikit-learn which makes spares vector of occurrence count of words. Using this we got 1245 sparse matrix of unique
© Daffodil International University 18 words. Then we tested our model with Bi-gram and Tri-gram features. Bi-gram features perform well then trigram and no n-gram.
Table 3.5.2.2: Vectorize without N-gram
মাশরািফ তুিমই বস ভােলা 0খেলেছ ইম8ল কােয়স
মাশরািফ তুিমই বস 1 1 1 0 0 0 0
ভােলা 0খেলেছ 0 0 0 1 1 0 0
ইম8ল কােয়স ভােলা
0খেলেছ
0 0 0 1 1 1 1
Table 3.5.2.3: Vectorize with Bi-gram
মাশরািফ তুিম
তুিমই বস মাশরািফ তুমই বস ভােলা
0খেলেছ
ভাল 0খেলেছ
মাশরািফ তুিমই বস 1 1 1 1 1 0 0 0
ভােলা 0খেলেছ 0 0 0 0 0 1 1 1
Another feature selection technique has been applied for sequence model through our dataset is “Word Embedding” from ‘keras.preprocessing’. Word embedding is the collective name for a set of language modeling and feature learning techniques in natural language processing where words or phrases from the vocabulary are mapped to vectors of real numbers. Word embeddings don't comprehend the content as a human would, however they rather map the measurable structure of the language utilized in the corpus. Given picture is an example of word embedding.
Fig 3.5.2.1: Word Embedding
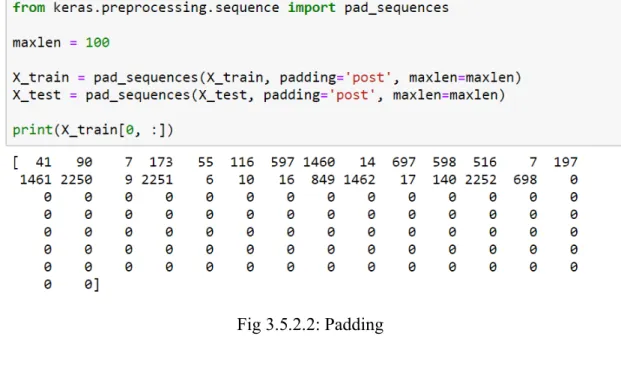
© Daffodil International University 19 One issue that we have is that every content grouping has by and large unique length of words. To counter this, we should use pad_sequence() which just cushions the arrangement of words with zeros. After doing Word embedding and padding with our dataset with sequence model we got maximum accuracy.
Fig 3.5.2.2: Padding
3.5.4 Algorithm
This study is supervised machine learning based where unstructured dataset has been labeled manually and verified by different people. Different classification model has been applied to our dataset to predict sentiment from tweets. We did it is to have a prevalent look at the last yield. This additionally empowered us to have a relative report among the predicting models. We gauged the results of various models dependent on these rules: Accuracy, Precision and Recall.
© Daffodil International University 20
Chapter 4
Experimental Results and Discussion 4.1 Introduction
The research is totally based on experiment however it is important for achieving the expected goal. Experimenting with various algorithm helps us to use perfect model that best fit in our dataset. In this chapter the experimental result and total accuracy has been discussed in details.
4.2 Experimental Results
We ran multiple classification models on our dataset to predict cricket player’s popularity assessment on this study. we did it is to have a superior look at the final output. This additionally empowered us to have a comparative report among the predictive models. We measured the results of various models dependent on these standards: Accuracy, Confusion matrix, Precision, Recall, f1-score and Support.
4.2.1 Logistic Regression
The Logistic Regression (LR) model provides shrinkage for performing text categorization and select features simultaneously [19]. It utilizes a Laplace prior stay away from over-fitting and produces sparse predictive models for text data [20].
estimation of 𝑷(𝒄|𝒇) has the parametric structure of Logistic Regression is:
𝑷(𝒄|𝒇) = 𝟏
𝒛(𝒇)𝐞𝐱𝐩 ((𝝀𝒊,𝒄𝑭𝒊,𝒄(𝒇, 𝒄))
Where normalization function is 𝑷(𝒄|𝒇), 𝝀 is a vector of weight parameters for the feature set [21] and 𝑭𝒊,𝒄 is a binary function. It takes as inputs a feature and a class label.
It is defined as:
𝑭𝒊,𝒄2 = 3𝟏, 𝒏(𝒇) > 𝟎 𝒂𝒏𝒅 𝒄9 = 𝒄 𝟎, 𝒐𝒉𝒆𝒓𝒘𝒊𝒔𝒆
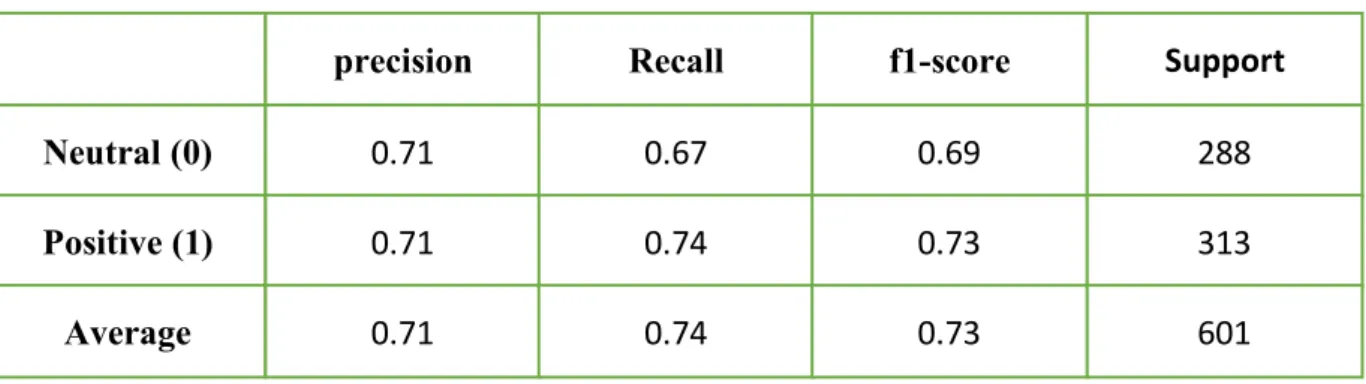
© Daffodil International University 21 When certain features exist, this binary function is triggered. The opinion is guessed with a certain way. For example, if the bigram “ভােলা 0খেলেছ” appears, a feature function might eliminate and the sentiment of the document is guessed to be positive [22]. Figure 4.2.1 and table 4.2.1 shows the confusion matrix, precision, recall, f1-score and support of our dataset after running Logistic Regression.
Fig 4.2.1: Confusion matrix for Logistic Regression
Table 4.2.1: Accuracy for logistic regression
Neutral (0) Positive (1) Average
precision
0.71 0.71 0.71
Recall
0.67 0.74 0.74
f1-score
0.69 0.73 0.73
Support
288 313 601
© Daffodil International University 22
4.2.2 Multinomial Naïve Bayes
This algorithm is a straightforward probabilistic classifier with a solid restrictive autonomy assumption that it is ideal for characterizing classes with highly dependent features [23]. Based on the Bayes theorem Positive or Neutral classes of each tweet has been calculated using the probability. In Bayes’ theorem, 𝑷(𝑪𝒊|𝑬) is the probability that text document E is of class Ci and defines it as follows [23].
𝑷(𝑪𝒊|𝑬) = 𝑷(𝑪𝒊)𝑷(𝑬|𝑪𝒊)
𝑷(𝑬) 𝑪𝒊 ∈ 𝑪
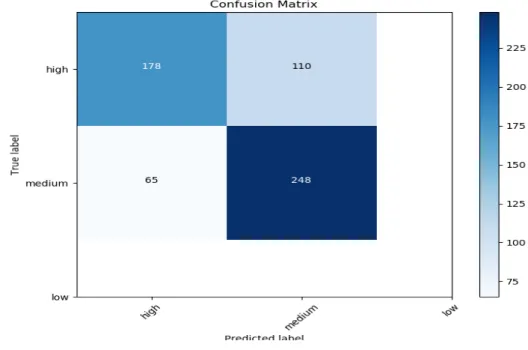
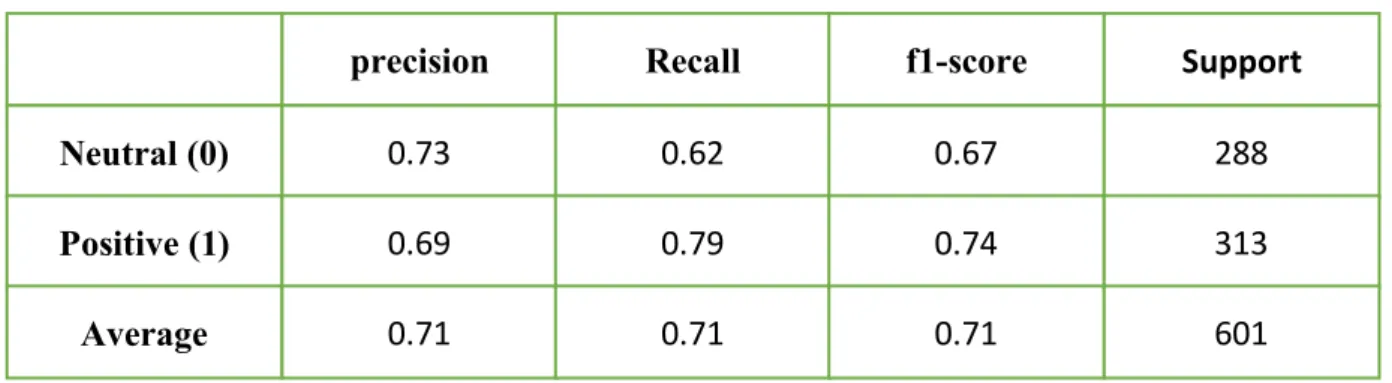
Figure 4.2.2 and table 4.2.2 shows the confusion matrix, precision, recall, f1-score and support of our dataset after running Multinomial Naïve Bayes.
Fig 4.2.2: Confusion matrix of MLB
Table 4.2.2: Accuracy of MLB
Neutral (0) Positive (1) Average
precision
0.73 0.69 0.71
Recall
0.62 0.79 0.71
f1-score
0.67 0.74 0.71
Support
288 313 601
© Daffodil International University 23
4.2.3 Convolutional Neural Networks
Convolutional layer takes a patch of input feature with filter kernel size that take a dot product of the multiplied weight of the filter. One dimensional ConvNets invariant to translations helps certain sequence recognition in different position. When we work with sequential data, like text, we work with one dimensional convolution. The convolutional filter consists of filters which move across the feature vector and then select important features. It takes patch of input features with the size of the kernel. The dot product of the multiplied weights of the filter has been taken with the help of patch.
The one-dimensional ConvNets is invariant to interpretations, which implies that specific sequences can be perceived at a different position. This can be useful for specific patterns in the text.
Fig 4.2.3: 1D Convolution
Patch from input features
TIME/ORDER OF SEQUENCE
Dot product with filter weights OUTPUT FEATURES INPUT FEATURES
Kernel size
© Daffodil International University 24
Pooling:
Pooling is used for reduce the output dimensionality and make fixed size output matrix but keep important features. In this way, we used max pooling on the feature maps.
Feature vectors are actually the output. Be that as it may, every convolution produces feature maps of various shapes. We perform max-pooling on them which creates feature vector for individual feature map. Then we made big feature vector by concatenating them.
Activation Function:
A neuron is active or not is decided by the activation function. We used sigmoid activation function in the feature map. To compute gradient, it needs less computation and its performance is better for binary classifications. The mathematical function of the sigmoid function is given below.
𝒇(𝒛) = 𝟏 𝟏 + 𝒆D𝒛 Where, z is a neurons output.
Fully Connected Layer:
All neurons of the next level have been locally connected to each neuron in the fully connected layer. After then the max-pooled data fed to fully connected layers to calculate accuracy and loss and also probability distribution. Dropout technique has been applied in this layer for avoiding overfitting. SoftMax classifier has been used to calculate probabilities and BinaryCrossEntropy used to calculate loss.
Optimizer:
Optimizers minimizes the gradient by adjusting the weights in the back propagation. In this research we used Adam optimizer for minimize the gradient. Adam Optimizer is computationally proficient, requires less memory, invariant in rescaling the gradients diagonally [24]. It is likewise productive to manage issue like noisy and/or sparse gradients.
© Daffodil International University 25
4.2.3.1 Model Architecture and Results
To get best performance it's important to test with various hyper parameter. We tested with various hyper parameters and compared the obtained accuracy between them. We change the batch size but keep the filter size constant. Also, we keep the default learning rate. Testing with various hyper parameter best accuracy gained in batch size 5. From this observation we can also see that changing in batch size increase or decrease the accuracy.
For calculating the loss function, we use Binary Cross Entropy. Binary cross entropy is just a special case of categorical cross entropy. The equation for binary cross entropy loss is the exact equation for categorical cross entropy loss with one output node. For example, binary cross entropy with one output node is the equivalent of categorical cross entropy with two output nodes. To optimize a machine learning algorithm, a loss function has been used. And performance has been measured by accuracy matrix that described our model's performance and loss function.
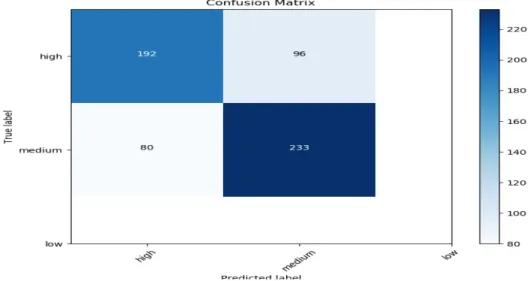
Figure 4.2.4, 4.2.5 shows r the model architecture, Confusion and loss accuracy matrices respectively. Table 4.2.3 shows that the Accuracy of our model.
Fig 4.2.4: Model Architecture Embedding_1:
Embedding Outpu
t None, 100,100
Global_max_poling_1D:
GlobalMaxPooling1D Output None,128
Conv_1D: Conv1D Outpu
t None, 91,128
Dense_1: Dense Outpu
t None,10
Dense_2: Dense Outpu
t None,1
745,029
© Daffodil International University 26 Fig 4.2.5: Accuracy, Loss, Confusion matrix
Table 4.2.3: Accuracy
4.3 Descriptive analysis
In this section a comprehensive study among the classifiers result in our dataset will be shown. We have used four performance measure used for calculating the performance of the algorithms. Confusion matrix for every classifier has been calculated. So, we have all necessary data for measuring performance of the algorithms. Following table 4.3.1 gives us the model accuracy result of all algorithms that we have experimented
Neutral (0) Positive (1) Average
precision
0.80 0.79 0.79
Recall
0.76 0.82 0.79
f1-score
0.78 0.80 0.79
Support
288 313 601
© Daffodil International University 27 Table 4.3.1: Model accuracy
SL no.
Algorithms Result
1. Logistic Regression 70.72%
2. Logistic Regression + bigram 71.38%
3. Multinomial Naïve Bayes 71.54%
4. Multinomial Naïve Bayes + bigram 70.89%
6. Convolutional Neural Network + Word Embedding
+ Padding Sequence 79.12%
As we know that deep learning models perform then other model. Here it is clearly reflected that Convolutional Neural Network performed outstanding performance than other machine learning models.
Another performance measuring, we have used is precision. Precision of any classifier is the measures the percentage of correct assignments among all the documents [25]. 1 is best possible value for precision and 0 is worst possible value. Below equation shows the calculation for precision:
𝑷𝒓𝒆𝒄𝒊𝒔𝒊𝒐𝒏 = 𝑻𝑷 𝑻𝑷 + 𝑭𝑷 Here, TP is True Positive and FP is False Positive.
On the other hand, Recall is the measure to decide the completeness [26]. All the more decisively, it is the rates of the actual positive samples that are labeled as positive [26].
Best and worst values for recall are 1 and 0. Following equation shows the calculation for the recall:
𝑹𝒆𝒄𝒂𝒍𝒍 = 𝑻𝑷 𝑻𝑷 + 𝑭𝑵 Here, TP is True Positive and FN is False Negative.
Another measuring method which is F-measure score is the harmonic mean of precision and recall [27] The F score is utilized to measure a test's accuracy, and it adjusts the utilization of precision and recall to do it. The F score can give an increasingly reasonable proportion of a test's performance by utilizing both precision and recall. The F score is regularly used in document classification performance This score is calculated according to:
© Daffodil International University 28 𝑭𝟏 = 𝟐 𝑷𝒓𝒆𝒄𝒊𝒔𝒊𝒐𝒏 . 𝑹𝒆𝒄𝒂𝒍𝒍
𝑷𝒓𝒆𝒄𝒐𝒔𝒐𝒑𝒏 + 𝑹𝒆𝒄𝒂𝒍𝒍
Figure 4.3.1 bellow describes the precision and recall and f-measure scores that we calculated.
Fig 4.3.1: Precision, Recall, F-measure Score
From this above performance measure score it is clear that the Deep learning model has the maximum accuracy in our dataset. So, Popularity assessment of cricket player has been done from the output result of this algorithm.
4.3.1 Popularity of Cricket Players
After selecting the best model for sentiment classification, it is time to calculate how popular a player is. It can be done by calculating the positive sentiment for each player.
The output result of the classification model is a Numpy array that contains 0's and 1's.
1 denoted to positive sentiment and 0's are for other sentiment. As popularity assessment needs only the positive sentiment that’s why we calculate total number of 1's for each player and divide it by total 1's in the output array.
𝑷𝒐𝒑𝒖𝒍𝒂𝒓𝒊𝒕𝒚𝑺𝒄𝒐𝒓𝒆= P 𝑷𝒑𝒐𝒔
Here, 𝑷𝒑𝒐𝒔 total positive score of each player. After calculated the popularity score of each player we got the following result shown in fig 4.3.2
0.66 0.68 0.7 0.72 0.74 0.76 0.78 0.8 0.82
Logistic Regression MNB CNN
Precision, Recall and f-measure score
Precision Recall F-Measures
© Daffodil International University 29 Fig 4.3.2: Popularity Score
From this figure it is clear that Mashrafee Bin Murtaza (মাশরািফ িবন মতু+জা) has the maximum popularity score. Tamim Iqbal (তািমম ইকবাল) and Shakib Ul Hasan (সািকব আল হাসান) has second and third peak of the chart respectively. In this chart Nasir Hossain (নািসর 0হাসাইন) and Sabbir Rahman (সাি;র রহমান) has lowest popularity score, that means they are less popular in this chart. Here, is most important thing being this popularity chart does not the ultimate ranking. It is just for a specific time period. By changing time, it can be changed due to player’s performance.
4.4 Summery
Section 4.2 shows the experimental results we have experimented. There are 3 algorithms that we applied to fed in our dataset. A comprehensive study shows that CNN model gives us promising accuracy. Thus, we selected as our final model. In section 4.3 we described the architecture of our model and then the loss and accuracy matrix of our model. Finally, we rank some Bangladeshi cricketers with the help of the positive outcome of the model. The ranking was done for a specific time period. It can be changed due to players performance.
100 2030 4050 6070
ইমর$ল কােয়স
িলটনদাস মাহমুদু1াহ িরয়াদ
মাশরািফ মত56জা 8মেহিদহাসানিমরাজ
মুশিফক5ররিহম মু9ািফজুর রহমান
নািসর 8হাসাইন সাি:ররহমান
সািকব আল হাসান
8সৗম>সরকার তািমম ইকবাল
তাসিকনআহেমদ
Popularity Score
Positive output
© Daffodil International University 30
Chapter 5
Summary, Conclusion, Recommendation and Implication for Future Research 5.1 Summary of the Study
In this research we attempted to distinguish popularity from Bengali content utilizing sentiment analysis. Studying different tweets, classifying the expressions into either positive or negative using various Machine Learning algorithms and then determining popularity from that was our main goal.
Popularity of a single person such as a player of Bangladesh National Cricket Team varies from time with their act of playing. We all know that performance of a player does not remain same all time, it's not parallel for measurement. So, to detect popularity of a specific time we need real time data of that explicit time. We have used Raspberry Pi with our own python script to gather Tweets which we ran for three months. We used STREAMING API using Push method from twitter which they provide for publicly use. With this API we caught real time tweets of a user I.e. a fan of a Player.
Though Bengali is the native language of Bangladesh, most of the people do not write Bengali in Twitter, they use English instead. So, it was difficult for us to gather huge amount of data. We have got about ten thousand of tweets, among them only 2952 were appropriate for our work.
Then we leveled each sentence whether it is positive or negative verified by multiple people. Our chosen Machine Learning algorithm detects popularity by calculating the percentage value of each player.
Finally, our proposed research is successful and we have got 80.50% of accuracy.
© Daffodil International University 31
5.2 Conclusions
This undergrad research, despite the fact that in an extremely brief time, has made the issue consummately clear and what has been finished. We have concentrated on making the problem scope clear so it fills in as a stage for basic augmentation to this system. The appraisal of the abilities of the understudies will help the authority of have a solid outline of the students. The research is likewise expected to guarantee appropriate direction and instructional courses for the understudies who are on a poor expertise level. Last consequence of the research is produced by implementing different algorithms, calculations and statistical techniques. Students who had paid attention to their underlying phases of programming have sparkled in pretty much every other area. Learning of center programming causes a great deal to continue in other technical zones. Also, specialized information with relational abilities prompts a balanced career.
5.3 Recommendations
Perfection is all time a work in advancement, there our proposed project is just at its beginning stages. Consequently, a great deal of works can be possible to it. To improve the viability, dependability and proficiency of the study, further collection of data is required. The more the data is, the more dependable the outcomes are. Other than, an approved set is also expected to decrease the over-fitting of the models. Progressively advance models can be applied on the data to investigate further.
© Daffodil International University 32
5.4 Implication for Further Study
Presently days, the interest for data mining expert is exceedingly valued. This is because of presence of enormous amount of information in our environment. It is the opportune time to work with these sorts of complex data, so that a new pattern can be acquainted to resolve different complex problems. Sentimental determining is one of the basic parts of Machine Learning. The experimental study which we have carried out on popularity identification with an attractive result is leaving a solid impression behind our work. We are still dealing with the system and will keep on working on the system furthermore for a superior and more accurate system.
© Daffodil International University 33
Appendices
Appendix A: Machine Learning pre-processing with TensorFlow.
With data pre-processing in Deep Learning getting attention, we ventured to give the TensorFlow Transform (tf.Transform) library a try.
© Daffodil International University 34
References
[1] P. Ferguson, N. O'Hare, M. Davy and A. Bermingham, "Exploring the use of paragraph-level annotations for sentiment analysis of financial blogs," in Workshop on Opinion Mining and Sentiment Analysis, Seville, Spain, 2009.
[2] E. W. Pamungkas and D. G. P. Putri, "Word Sense Disambiguation for Lexicon-Based Sentiment," in 9th International Conference on Machine Learning and Computing, Singapore, Singapore, 2017.
[3] L. Cruz, J. Ochoa, M. Roche and P. Poncelet, "Dictionary-Based Sentiment Analysis Applied to a Specific Domain," in Information Management and Big Data, vol. 656, Cusco, Peru, Springer International Publishing, 2017, pp. 57-68.
[4] D. Ekawati and M. L. Khodra, "Aspect-based Sentiment Analysis for Indonesian," in International Conference on Advanced Informatics, Concepts, Theory, and Applications, Denpasar, Indonesia, 2017.
[5] A. Trilla and F. Alías, "Sentence-Based Sentiment Analysis for Expressive Text-to-Speech,"
IEEE Transactions on Audio, Speech, and Language Processing, vol. 21, no. 2, pp. 223 - 233, 2012.
[6] P. Sanguansat, "Paragraph2Vec-based sentiment analysis on social media for business in Thailand," in 8th International Conference on Knowledge and Smart Technology, Chiangmai, Thailand, 2016.
[7] H. Nguyen and M.-L. Nguyen, "A Deep Neural Architecture for Sentence-Level Sentiment Classification in Twitter Social Networking," in International Conference of the Pacific Association for Computational Linguistics, Yangon, Myanmar, 2018.
[8] M. Thelwall, K. Buckley and G. Paltoglou, "Sentiment Strength Detection for the Social Web,"
Journal of the American Society for Information Science and Technology, vol. 63, no. 1, pp. 163- 173, 2012.
[9] S. Dutta, M. Roy, A. K. Das and S. Ghosh, "Sentiment Detection in Online Content: A WordNet Based Approach," in International Conference on Swarm, Evolutionary, and Memetic
Computing, Hyderabad, India, 2015.
[10] S. M. M. H. Chowdhury, S. Abujar, M. Saifuzzaman, P. Ghosh and S. A. Hossain, "Sentiment Prediction Based on Lexical Analysis Using Deep Learning," in Emerging Technologies in Data Mining and Information Security, Springer International Publishing, 2019, pp. 441-449.
[11] M. Al-Amin, M. S. Islam and S. D. Uzzal, "Sentiment analysis of Bengali comments with Word2Vec and sentiment information of words," in International Conference on Electrical, Computer and Communication Engineering, Cox's Bazar,