MACHINE VISION BASED LOCAL COASTAL FISH RECOGNITION
BY AFIQ RAIHAN ID: 153-15-6456
&
NADEYA NUSRAT ANANNA ID: 161-15-6726
This Report Presented in Partial Fulfillment of the Requirements for the Degree of Bachelor of Science in Computer Science and Engineering
Supervised By Md. Tarek Habib Assistant Professor Department of CSE
Daffodil International University Co-Supervised By
Dewan Mamun Raza Lecturer
Department of CSE
Daffodil International University
DAFFODIL INTERNATIONAL UNIVERSITY DHAKA, BANGLADESH
DECEMBER 2019
©Daffodil International University ii
©Daffodil International University iii
©Daffodil International University iv
ACKNOWLEDGEMENT
First we express our heartiest thanks and gratefulness to almighty God for His divine blessing makes us possible to complete the final year project/internship successfully.
We really grateful and wish our profound our indebtedness to Md. Tarek Habib, Assistant Professor, Department of CSE, Daffodil International University, Dhaka. Deep Knowledge & keen interest of our supervisor in the field of “Computer Vision and Machine Learning” to carry out this project. His endless patience ,scholarly guidance, continual encouragement, constant and energetic supervision, constructive criticism, valuable advice, reading many inferior draft and correcting them at all stage have made it possible to complete this project.
We would like to express our heartiest gratitude to Prof. Dr. Syed Akhter Hossain, Professor, and Head, Department of CSE, for his kind help to finish our project and also to other faculty member and the staff of CSE department of Daffodil International University.
We would like to thank our entire course mate in Daffodil International University, who took part in this discuss while completing the course work.
Finally, we must acknowledge with due respect the constant support and patients of our parents.
©Daffodil International University v
ABSTRACT
In geographically, Bangladesh is situated in the bank of sea of Bay of Bengal. There are many marine resources naturally. Among the resources, coastal fishes which can play a vital role in the growth of economy and can utilize it properly. Due to the natural climate, this is the only birthplace of coastal fish available here.Which is the coastal fish? Where are they from? When can you find them? Many of questionnaires are raised here about the sea salt fishes. Some of the common fishes are known to us but most of the fishes are unknown to all and reduce gradually. In the situation, those fishes can't be save from extinction without learning. Here, data is more crucial part to run it in this project. For training the data, some extraction of features has been used such as Color Analysis, Texture Analysis, Segmentation and three types of classifiers. Various research experiments have been carried out after identification, which can decide whether it is hard enough to identify the coastal fish. This scientific work relates to machine vision, in which case the processing of images is used to identify our local fish. Machine Vision is the only type of technology and methods used to provide automated image-based inspection and analysis for applications such as automatic system, process maintenance, and process control and robot management in industry area.
©Daffodil International University vi
TABLE OF CONTENTS
CONTENTS PAGE
Board of examiners ii
Declaration iii
Acknowledgements iv
Abstract v
CHAPTER
CHAPTER 1: INTRODUCTION 1-5
1.1 Introduction 1
1.2 Motivation 3
1.3 Rationale of the Study 3
1.4 Research Questions 4
1.5 Expected Output 4
1.6 Report Layout 5
CHAPTER 2: BACKGROUND 6-10
2.1 Introduction 6
2.2 Related Works 6
2.3 Research Summary 10
2.4 Scope of the Problem 10
2.5 Challenges 10
©Daffodil International University vii
CHAPTER 3: RESEARCH METHODOLOGY 11-22
3.1 Introduction 11
3.2 Research Subject and Instrumentation 11
3.3 Data Collection Procedure 11
3.4 Work Flow of Recognizing of Coastal Fish 12
3.4.1 Image of Coastal fish 13
3.4.2 Feature Extraction 13
3.4.3 Feature Selection 21
3.4.4 Data Procedure 21
3.4.5 Classifier Testing: 21
3.5 Implementation Requirements 22
CHAPTER 4: EXPERIMENTAL RESULTS & DECISION 23-35
4.1 Introduction 23
4.2 Data Collection 23
4.3 Image Processing 23
4.4 Feature Extraction 25
4.5 Fitting Dataset for Classifier 25
4.6 Experimental Result 25
4.7 Accuracy Model 26
4.8 Descriptive Analysis 35
4.9 Summary 35
©Daffodil International University viii
CHAPTER 5
SUMMARY, CONCLUSION, RECOMMENDATION
& IMPLECATION FOR FUTURE RESEARCH
36-37
5.1 Summary of the study 36
5.2 Conclusions 36
5.3 Limitations 36
5.4 Recommendations 37
5.5 Implication of further study 37
REFERENCES 38-40
APPENDIX 41
PLAGIARISM REPORT SCREENSHOT 42
©Daffodil International University ix
LIST OF FIGURES
FIGURES PAGE NO
Figure 3.4: Figure 3.4: Block Diagram for the coastal fish recognition 12
Figure 3.4.2(a): Thresholding for segmentation 14
Figure 3.4.2(b): Color Image of two fishes after segmentation 15 Figure 3.4.2(c): Height & weight of two coastal fish 16 Figure 3.4.2(d): Fourier Transform of segmented images 18-19
Figure 4.3: Segmented images 24
©Daffodil International University x
LIST OF TABLES
TABLES PAGE NO
Table 2.2(a): Works done on fruits and foods classification 7 Table 2.2(b): Work done on fish recognition and classification 9
Table 3.4.2: The equation of GLCM feature 21
Table 4.7.1: Confusion Matrix of 50% training data for SVM classifier 27 Table 4.7.2: Confusion Matrix of 60% training data for SVM classifier 27 Table 4.7.3: Confusion Matrix of 70% training data for SVM classifier 28 Table 4.7.4: Confusion Matrix of 80% training data for SVM classifier 28 Table 4.7.5: Confusion Matrix of 50% training data for KNN classifier 29 Table 4.7.6: Confusion Matrix of 60% training data for KNN classifier 29 Table 4.7.7: Confusion Matrix of 70% training data for KNN classifier 30 Table 4.7.8: Confusion Matrix of 80% training data for KNN classifier 30 Table 4.7.9: Confusion Matrix of 50% training data for Bagged Tree
classifier
31
Table 4.7.10: Confusion Matrix of 60% training data for Bagged Tree classifier
31
Table 4.7.11: Confusion Matrix of 70% training data for Bagged Tree classifier
32
Table 4.7.12: Confusion Matrix of 80% training data for Bagged Tree classifier
32
Table 4.7.13: Comparison the accuracy for 50% testing data for all classifiers
33
Table 4.7.14: Comparison the accuracy for 60% testing data for all classifiers
33
©Daffodil International University xi Table 4.7.15: Comparison the accuracy for 70% testing data for all
classifiers
34
Table 4.7.16: Comparison the accuracy for 80% testing data for all classifiers
34
©Daffodil International University 1
CHAPTER 1 INTRODUCTION
1.1 Introduction
Bangladesh is a high density populated country comparing the land. According to the statistics, total population of the country is 163.5 million and almost 1,115.62 people live in every square kilometer or 2,889.45 people live in every square mile [1]. The rapid growth of our population is the thread of our economy. The low earning population couldn’t buy their necessary foods and medicines. An average generally healthy man have to eat 56g of protein a day, while an average generally healthy woman needs 46g of protein in a day[2].
Fish is a high-quality protein with low-fat. But they couldn’t afford to eat in daily. The maximum of the fish come from the coastal areas.
Bangladesh have large sea area bordering with India of Bay of Bengal. There are about 32,000 species of fish in the world, and one third of them live in fresh water. There are 401 species of marine fishes in Bangladesh [3]. Fish has large amount of protein, calcium and phosphorus as well as a great source of minerals like iron, zinc, iodine, magnesium and potassium. The fish supplies the maximum of daily protein of a person especially for the low incoming population. A 100 g fish has up to 93% of calories. It also contains omega- 3 fatty acids and some vitamins and minerals in a large amount [4]. Bangladesh is a highly densely populated country. If we consider our country, where the total supply of protein is small comparing population and is particularly important for diets, fish proteins are necessary.Fish oils are important to our health as well. Eating small fish is good for our health, especially for children. The fisheries sector has an important role in the growth of economy where our economy depend on this sector. In a statistics of a paper [5], the 3.69 percent of country’s GDP come from the sector and this is almost 22.6 percent in the agricultural GDP.
As demonstrated in [5], over the 2% of the export value of Bangladesh in a fiscal year comes from the inland fisheries area. Even, fish products supply almost 16% of human diet all over the world [6]. Unfortunately, however, the living place of fishes are becoming a
©Daffodil International University 2 challenge for climate change. Many of the fish species are reducing with the threat of climate. The point is big concern for our country. However, some of the species are critically threatened, some of them are extinct or endangered totally. Some of these coastal fishes are listed in shortly which are given in below.
Balitora, Hora, Kursha, Bul, Kajuli
Nalua Chandra, Lal Chandra
Pangga, Tila, Bamosh
Chela, Nipathi, Koi Bandhi
Nandi, Ek Thota
Kursha, Bhol, Kajuli
In our country, our population is vast and large as the total land. We have to dependent for proteins either land-based crops or fish. As our land is limited, we focus on the fish. But, the fishes are reduced by the changing of climate, environmental disasters or others factor causes. Still our present generation is not conscious about this. Thus, the next generation do not have the enough knowledge about the threatened fishes and this mean a negative sign for our future. We will identify coastal fish by name, color and textures in this project.
Firstly, we study on the theoretically concepts and after all, we will develop the system for the future works. We have to study on various type of papers for the project.After study, we decided that our work procedures would be based on machine vision, which is part of machine learning.
A machine cannot recognized anything from an images or videos if we don’t learn the machine. For example, a person can identify anything from an image what is it. Especially, people can recognize the characteristics of the image. But if we consider a machine or computer, how can it recognize? For that, we have to learn the machine by the machine vision using the machine learning algorithms. Machine Vision plays a major role in delivering the best value in manufactured products, reducing costs and maintaining a high level of customer service. Scanners and tools for image processing allow machine vision to properly inspect. For the purpose, we choose the machine vision to identify the coastal fishes. In this research, we capture the images of fish in both sides and various angles. After that, machine can be learned from the captured images as a training and then, the machine can be recognized the fish if anyone captures any image of any resolution of the same image. In the work, we work on the seven types of coastal fishes such as Poa, Rupchandra,
©Daffodil International University 3 Bailla, Tailla, Loitta, Hilsha and Koral. However, we fulfil the machine learning procedure by the image processing and machine learning in the thesis paper.
1.2 Motivation
Bangladesh is a large and high densely populated country including a lots of problems. In the modern age, we need to calculate the proper measurements and solve this issues to recovery from the situation. If we consider the marine resources, there are a lots of opportunities to utilize the resources such as fish, gas, oil, petroleum and so on.
In coastal area, there are a great opportunity as our country as the bank of Bay of Bengal.
But there are no work on machine vision-based field. There are various type of fishes but we cannot recognize them. From the perspective, if we can recognize by this work, it will be a good work instead of suffering.
From our people perspective, maximum of the people is unknown with the coastal fishes.
They normally can’t identify them and even, they mixture one fish with another. They get confused when they see the fishes. Here, we work on it to make it easy and identify easily as normally. This is the main motivation of our work. Secondly, people can be aware about the resource opportunities of fish and take the right action to safe the fishes from the extinction. If we work on it providing a well environment for their livelihood, it will be a good deal in future. Even fish fulfil our protein demand as daily needed. Fish has a high protein, calcium and phosphorus content with low fat. So, this is another motivation of our research works. In the scenario, we believe that this work is going to solve this kind of problems.
We are live in the age of technology, even technology make our life easier. Technology make our life much easier. But our fish market, there are no such work that make it easier.
Here, we do the project easier by the help of electronic device or mobile device, it make the situation much better. For the perspective, we am interested to do the research-based work by image processing and machine learning.
1.3 Rationale of the Study
There are a lots of research works and automated system in abroad about the coastal and marine resources. They are ahead and much developed in modern era. Truly, there are no work in our country in the field. Our economy can be depended on fisheries sector if we will well-organized and focus on it. The fisheries sector has a vital role in our economy.
Here, 3.69 per cent of the country's GDP comes from the sector, which is almost 22.6
©Daffodil International University 4 percent of agricultural GDP. Over 2% of Bangladesh's export values come from the inland fisheries sector [5].Fish has large amount of protein, vitamins, calcium, and phosphorus as well as a good amount of iron, zinc, iodine, magnesium, potassium and other minerals.The average generally healthy person has to consume 56 g of protein per day, while the average generally healthy woman needs 46 g of protein per day.The fish provides the maximum amount of protein for considering our country.Fish proteins are required in some densely populated countries, where the supply of total protein is low and it is important especially for diets of health.
If we conscious about the area and take the proper measurement, there is a good opportunity. But with the threat of climate, many of the fish species are decreasing. The point is our country's big concern. Some of the species, however, are critically endangered, some of them are completely extinct or threatened. That’s why, there is a great scope to work for modernized in the globe.
1.4 Research Questions
There are raised some questionnaires in the research field. We will strengthen our work from these issues, and anyone can get a clear concept.
Is it only possible to detect coastal fish? Or is it possible for local fish as well?
Can we detect the fish in any background?
If there are more than one fish, can we identify?
When we take pictures of fish at different angles, will these pictures be correctly identified?
If the size of the image is different, how can it be identified?
If there are presence the little big bigger obstacles, can we completely eliminate them?
1.5 Expected Output
Expected outcome of our research project is recognized to the coastal fish. We need to construct an efficient procedure or algorithm that will improve our project as if anyone takes a picture of a coastal fish in any background and uploads it after the process, then this procedure will easily identify the fish if its coastal, otherwise it cannot be possible. If camera resolution is either decent enough or not poor enough, then the fish will be visualized.
©Daffodil International University 5 1.6 Report Layout
The report of our work will be given as follows:
Chapter 1 provides our research-based project with content. First, in this chapter, we introduce everything about our project as well. After that, there's material focused on what inspired us to do this project. Here, why we consider this research important, which will be explained very well in the study rationale. Then some content name is written in the last part of this chapter as research questions and expected outcome.
Chapter 2 involves the discussions of the literature review. In this section, the type of research works have done in past and what is the future aspect of the research field.
However, this section provides the summary of problems and limitations of the area.
Finally, it explains the challenge of the field.
Chapter 3 reflects this research project's conceptual overview. This chapter extends the protocol to promote the use of statistical methods. And last but not least, it describes the processes of data collection and instrumental artifacts that allow us to take original fish images. We will explain our procedure for this research in this chapter and offer an estimate as well. Specifications for implementation will be introduced in the third chapter.
Chapter 4 summarizes experimental results and thoroughly explains the outcomes. We add some innovative tables and pictures in this fourth chapter that demonstrate the process and how we finalize our plan.
Chapter 5 is focused on our research findings. Finally, this chapter includes the constraints and challenges we face in our final work. And if anyone wants to investigate this field in an impressive and descriptive way, this research is a great opportunity for them to help.
©Daffodil International University 6
CHAPTER 2 BACKGROUND
2.1 Introduction
In the section, we summarize the review of the study which is done in past in the field.
After that, the type of works have done in the field in past and what is the future aspects of the area. This section, however, provides an overview of the area's problems and limitations. Finally, it explains the field's challenge.
2.2 Related Works
IUCN Bangladesh (2015a, b) [7] has measured two hundred and fifty-three Freshwater Fishes has been listed. Nearly one-fourth (64 species) of the species are threatened by threatened groups, including 9 critically endangered, 30 endangered, and 25 vulnerable.
Same thing is happening for the sea salt water fishes.Bangladesh has a large sea zone in the Bay of Bengal bordering India. There are nearly 32,000 fish species in the world, and one quarter live in fresh water. In Bangladesh, there are 401 species of marine fish [3]. But it is noticed that most of the species are under threatened or critically threatened to extinction. In Bangladesh, few works are done among them fish are hardly found in the fish recognition sector. But there are some project has been built on the fruits and foods classification. Due to their characteristics, there are adequate works to recognize fruits. In our review, we find that many works has been done with their characteristics and features analysis like color analysis [7], texture features [7], grading system [8], color characterization [9], fruits classification [10], identification of faulty apples [11] and many machine vision functions. Apart from this, some works has been built for food recognition on the machine vision recognition system [12, 13]. We show a demonstrated table in the following Table 2.2. Here we find some works in machine vision system on fruits and foods recognition.
©Daffodil International University 7 Table 2.2(a): Works done on fruits and foods recognition
Work Done / References
Domain Size of data set
Type of Learnin g
No of Feature s
No of fruits / foods
Classifier Accurac y (%)
M. T. Habib et at. [14]
Bangladeh 129 CML 10 1 SVM 90.15
Y. Zhang et al. [10]
China 165
3
Neural network
NA 18 NA 89.1
B. Zhang et al. [11]
China 160 CML 12 1 RVM 95.63
S.
Arivazhagan et al. [7]
India 263
5
CML 2 13 Minimu
m distance classifier
86%
K. Yanai and Y. Kawano et al. [15]
Japan NA Neural
network
NA 100 NA 78.77
F. García- Lamont et at.
[9]
NA 720 Neural
network
NA 12 NA 93.89
In our literature review, we go through the some well works has completed in last few years. They stated many project and demonstrated many future direction for classification sector. According to [16], the author described the images by a two-dimensional function to identify the intensity of image. They used the electromagnetic (EM) spectrum. Images are captured by color machine-vision systems and computer software is used to transmit the electronic signals to an electronic device. They used illumination for better quality of image and also performed the image segmentation, feature extraction. The ANN (Artificial Neural Network) and SVM (Support Vector Machine) and others techniques was performed and shown 99.8% accuracy on seven types of fish. In paper [10], they proposed a hybrid classification technique called fitness-scaled chaotic artificial bee colony (FSCABC) and feedforward neural network (FNN). Firstly, they resized the images 256 x 256 pixels from the captured the images and used the color histogram, texture and shape
©Daffodil International University 8 features of fruits for 18 categories. Secondly, PCA (principal component analysis) was used to minimize the dimensions of features. However, the FSCABC–FNN algorithm gained the 89.1% accuracy for the classification of fruits. As shown by Jing Hu et al. [17], the paper described a novel classifier method to identify the fish species based on color and texture features as well as a multi-class support vector machine (MSVM). The images was captured in 1024 x 768 pixels and cropped the specific area of skin from the main images in 512 x 512 pixels by an automatic cropping program. They converted the images from RGB to HSV color space and extracted the six HSV color features based on the color features as well as statistical and wavelet-based texture features. Two types of texture features such as Grayscale Histogram (GH) and Gray Level Co-occurrence Matrices (GLCMs) were used for the statistical texture features. The author also stated that the Bior4.4 wavelet filter in HSV color space gained the better accuracy in their work.
Apart from this, we find some encouraging works in our country to develop our fisheries sector. In paper [5], the author gave the future direction, scopes, guides and perspective scenario in our country. In paper [18], they stated that they extracted the features based on the size and shape measurements depending on distance and geometrical tools. They focused on the anchor\landmark point detection and presented eighteen features to recognize fishes. They also claimed that the features can be measured by the area of fish, area of length and width for size measurements and the size of mouth, angle of head, caudal fin length, dorsal fin length, caudal angle and the angle between the mouth and the eye for shape measurements. Here, we found that the area and distance from one point to another of fish were measured by the anchor\landmark point detection.They worked on 350 images for neural network and acquired the 86% accuracy. They should increase the large volume of data for this work.
We stated a table on the few works done on fish recognition and classification. We describe the result and the applied methods in the following table 2.2(b).
©Daffodil International University 9 Table 2.2(b): Work done on fish recognition and classification
Work Done/
References
Domain Size of data set
Type of Learning
No of Features
No of fishes
Classifier Accuracy (%)
I. Sharmin et al. [18]
Bangladesh 180 CML 13 6 SVM
KNN Ensemble
94.2 92.6 88 F. Storbeck
and B.
Daan [19]
NA 251 Neural
network
NA 6 NA <95
J. Hu et al.
[17]
China 540 CML 16 6 VBMSVM
DAGMSM LIBSVM
97.96 97.77 95.92 M. K.
Alsmadi et al. [20]
Malaysia 350 Neural network
18 20 NA 86
From the above definition, we can demonstrate that the coastal fish bring the nobility in fishery of Bangladesh but, no research work has been carried out. For addition, the works include the identification of fruit diseases or other recognition types are also little in our country. Here, there is a gap to the procedure of recognizing for the coastal fish. Even, there are not enough resources for the better measurement and the relevant works for it.
We can say that it is clear to see at the research gap between the current states of the works on fish. Then there is not enough resources on this topic to discuss other issues related to it.
©Daffodil International University 10 2.3 Research Summary
The all of discussion in above of various types of related works have been carried out from various research teams. It is being shown to us that no work has been done currently in the field of coastal fish on our country. In our study,Recognition of tropical fish, recognition of sea fish and many different types of identification of fish are demonstrated in various papers. Image processing indicates the length, weight, age, disease, color and others fish characteristics. Here, the all of those works are not in the perspective of our country. Again, we notice that there are many works in fruits recognition, foodsrecognition and so on of those papers.Although there are not enough resources, hopefully this sector will become more resourceful in the days ahead.
2.4 Scope of the Problem
From the articles, we am reviewing above, we find the problems where enormous information cannot continue. With the season of the year, the situation of a fish varies and the geometry changes also occurred.Many of the results similar to the minimum percentage that many issues arise when the neural network is affected by noise detection. The problem with fish identification is seeking useful features based on object segmentation and extraction features.The outcome of research can be affected due to the classifications and other algorithms used in these papers.
2.5 Challenges
The main problem of our research is the dealing with the datasets. We need some qualified approaches to solve this problem to execute it, but sadly there are not enough known approaches to do so. Another one, the images of different angles may sometimes cause of geometrical problems which is difficult to overcome. Then there is not enough raw materials on this area where we can explore other issues related to it.
©Daffodil International University 11
CHATPER 3
RESEARCH METHODOLOGY 3.1 Introduction
This section summarizes the research procedure of our work how the procedure can be complete. Basically, it covers the theoretical information and research procedure of this work. Here, this section make a clear impression throughout the procedure of algorithm.
Making it more convenient to realize that we have shortly gathered some important knowledge. Data is very important to learn the machine learning and data mining. We am therefore explaining the process for collecting data very briefly. In the content of statistical analysis, it represents the calculations and elaborate all data set in order to make it more logical. We will give a clear concept about the method of identifying the fish in this workflow material. In addition to this section, the specifications for implementation are being closed by giving a distinct definition.
3.2 Research Subject and Instrumentation
The representation of the research subject is the field that relate the study of the relevant work and from these anybody can clearly understand this domain. Not only to make it clear, but also the object of research is required to satisfy our demand for several forms of parameters of research. Again, instrumentation refers to the instruments or equipment, the researcher uses.In addition to analysis questions are answered by using instruments such as how to, when to, where to collect data and how to analyze data.Such decisions need to be made as a research-based project program. We help to guide for the achievement of the study goal and answer all sorts of research questions.
3.3 Data Collection Procedure
Data is one of the major factor to our work. Even the target of data collection of this project is to collect the raw data of fishes. We collect the data of images of coastal fishes from the coastal area instead of downloading the images from the internet, because of identifying the fish easily and accurately.
We collect the data from the coastal area of Chittagong, mostspecifically the local markets, fishery ghat where the fishes come from the sea of Bay of Bengal and the bank of coastal area.
©Daffodil International University 12 We select some of the species of fishes and after that, we gather seven type of images of fish. The species of fish are such as Poa, Bailla, Tailla, Rupchandra, Hilsha, Loitta and Koral and all of them are different in category. We capture the image of both sides and different angles of fishes in various background.For all of them, each selected single fish undergoing the same phase, the light and the atmosphere are the same. The total images of the all fishes are more than 800.
3.4 Work Flow of Recognizing of Coastal Fish
The workflow refers to the procedure of data process and how to fix in a sequentially. The procedure make it easier to understand including all the features and there are some scope of limitations that can be identified much easily. In shown Figure. 3.4, the block diagram of fish recognition is going to illustrate.
Figure 3.4: Block Diagram for the coastal fish recognition Color Image of Fish Thresholding for
Segmentation
Mean Value of RGB
Conversion to HSV Image & Mean of HSV Feature
Extraction Classifiers
Giving Output
©Daffodil International University 13 3.4.1 Image of Coastal fish
We put all the coastal fishes in different backgrounds at first to take pictures of them. Using all the backdrop will make the pictures more visible. Few circumstances should be considered when taking photos. Using any angle and dimensions, images can be captured.
Pixels and resolutions are not important to clarify the pictures. But here we use 512 x 512 dimensions to support this research.
3.4.2 Feature Extraction
We mean, the feature extraction is a dimensional reduction process where all elementary data sets of raw variables are needed for processing and reduced this in the functional groups for the identification of data. That’s make the data more informative and non- redundant. However, feature extraction can measure data and generate derived values to reduce the amount of resources needed to describe a large amount of data set. If the input data is too much in an algorithm to disrupt the processing of data, then we differentiate that the data is uneconomical and redundant for it. For this, to make it more efficient and convenient, we need to minimize them and bring them in some features.Machine vision is a very important application of extraction feature that helps to recognize the natures that all kinds of natures a fish has.
Some of the features of fishes are as follows:
Segmentation:
The segmentation of image is the next step in completing this research. Image recognition has many obstacles for researchers because of the distortion, noise, segmentation errors, overlap and occlusion of objects in digital images [20]. We say that segmentation is the method of dividing a digital image into different segments by using pixels. This
simplifies and represents a picture which is more concrete and smooth to examine in order to change it. Image processing is usually more reliably used to identify certain objects and borders like lines, curves, etc. After that, we can see that it can segment the whole image that is extracted from the image collectively. Each pixel is similar in a region with certain characteristics such as color.Segmentation is necessary to find the area where the fish lives.We use the threshold for segmentation in this research. It is the simplest way of segmenting the image.A black pixel can be used to replace each pixel in an image if the intensity of image is smaller than a fixed constant, i.e. Iij < T or a white pixel when the intensity of image is more than constant.
©Daffodil International University 14 There are some category of thresholding which is mentioned in below.
Histogram shape-based method for analyzing peaks, valleys, or histogram curvatures that can smooth out.
The methods of clustering help identify the gray level scale which is responsible for this work.
Entropy-based method can cross entropy between images that are original and binarized.
We use Histogram shape-based method for segmentation in our search because we have identified only one element.
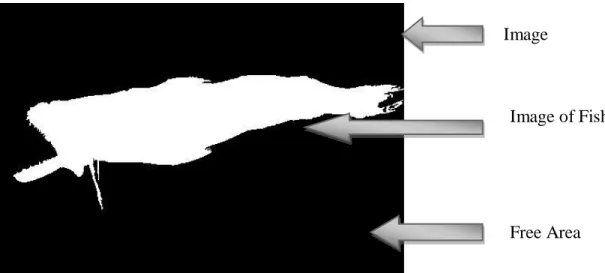
In Figure 3.4.2(a), we are showing the segmented image using the thresholding method.
Figure 3.4.2(a): Thresholding for segmentation
Color Extraction:
Our first priority for extracting features is to do the color model at the very beginning. We need RGB and HSV to shape this research, which is very helpful for us.Not only these prototypes, but we also need to do some color design coverage to make the process for better application.The RGB color model is an integrated color model which has its own three colors. It's: Red, Green, and Blue. They are introduced at the same time to replicate
Image
Image of Fish
Free Area
©Daffodil International University 15 a huge section of color arrays in various ways.The RGB color model is used to identify, reflect and display images in electronic systems such as TV, computer or a device that is the main objective of this application. RGB is a color template that depends on the electrical device. For numerical representation, a color in the RGB color model is represented by indicating how much of each of the red, green, and blue was included. Every color is independently set to zero to the highest values. Because all fishes have different colors, we use RGB color model.We used the following formula to determine the Component of Red, Green, Blue and the RGB Space Mean value. Here, 𝑁𝐹𝐼 represents the number of pixels measured in Fish (FI) color images.
𝜇 = 1
𝑁𝐹𝐼∑(𝑖,𝑗)∈𝐹𝐼𝐼(𝑖, 𝑗) … … … (3.1)
But for color analysis, RGB is not very effective, so we convert the RGB image to HSV space. HSV is the alternative color representation of the RGB system in which human vision imagines color properties to be more precisely categorized. At first, the black color put in the bottom, while white color in the top and the colors of each HSV color template hue organize it around a central axis of neutral colors through a radical slice. There are some contents in color making attributes that make it more comprehensible like hue, radiance, luminance, brightness, lightness, colorfulness, saturation, etc. For color analysis, this color model is very useful.We also use the same formula here to measure components of hue, saturation and brightness in HSV space. The color images of fishes are shown in the following Figure 3.4.2(b).
Figure 3.4.2(b): Color Image of two fishes after segmentation
©Daffodil International University 16 Geometric Features:
Machine learning and computer vision are combined in the methods of extraction of geometric features to solve visual tasks. The main goal of the geometric function is to find a set of reflective features of the geometric shape to store object information and use it for efficient machine learning methods. Geometric function not only solves problems with recognition, but it also has the idea by analyzing them to give exact feedback from the image. A collection of geometric factors such as points, lines, curves or surfaces create geometric features.Such features may include corner features, edge features, blobs, ridges, salient object texture, and so on and feature detection methods can be used to detect those features.
In this study, we get pictures of fishes after segmentation where we place the fish on a backdrop, so geometric characteristics help to show the edges of the fish and measure the region where the fish exits.
In the project, we add six characteristics; height, width, area, solidity, convex area and mean intensity.
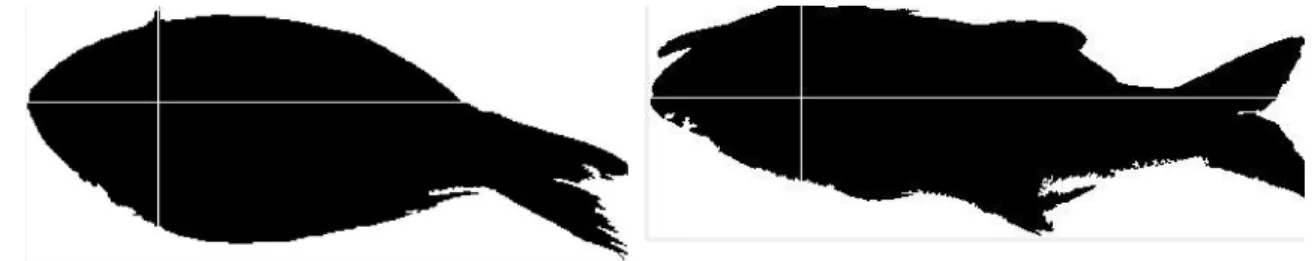
1) Height and Weight:For this analysis, we take seven different fish. The height and length of these fishes are different. So, in the study, we use this feature.
We calculate the pixels of height and width where the fish exits to measure height and width. We show in figure 3.4.2(c) that different species of fish can have different height and width in measurements.
Figure 3.4.2(c): Height & weight of two coastal fish
©Daffodil International University 17 2) In the segmented image, the area is used to measure the fish. This feature will be able to detect all the pixel area with adequate resolution.Area (Ar) is the real pixel number inside the object. Solidity (So) is the pixel ratio that is the convex set.Solidity determines the fraction of circumference comprising high solidity material and low solidity content. Convex (Cv) is the convex hull's number of pixels along with the image. This determines the uncircular aspect of the curve. Here is the equation of the solidity where S is the solidity.
𝑆 = 𝑁𝑐/2𝜋𝑟 … … …. 3.2 Fishes are not similar in size so we use it for research.
3) Mean Intensity:An image intensity can be a mean indicator of pixel intensity.
Intensity measurement can be how bright a picture compares the other picture.
So we equate the segmented image with the gray scale image in this analysis and then measure the intensity.When fishes differ from each other, this feature is important for the work as well.
Fourier Transform:
Fourier transform is used to sequentially calculate the complex data. We do some transformation after geometric features to gradually collect some data to help make it clear.
This data is a two-dimensional periodic that discusses some of the functions of the objects.
It's in the domain of frequency. The Fourier transform is a simple idea in the complex Fourier series where the limit is . It would be replaced for the discrete value with the continuous value while it represent by . Then transform the sum into an integral, and the equations will become as given;
… … … (3.3)
… … … (3.4) Now,
… … … (3.5)
… … … (3.6)
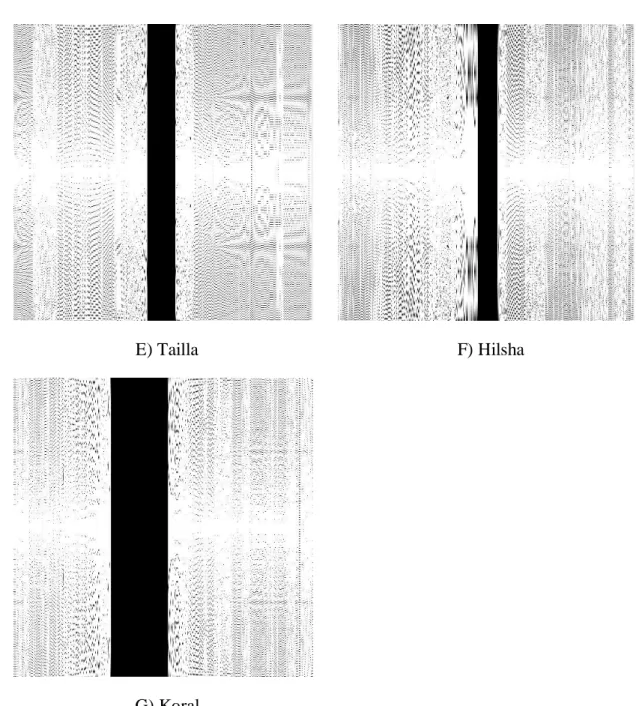
©Daffodil International University 18 For this analysis, Fourier transform is one of the best feature extraction. This provides good results in the classification of fish. In figure 3.4.2(d), we showed that for Fourier transform, various fish have different value.
A) Rupchandra B) Poa
C) Loitta D) Bailla
©Daffodil International University 19
E) Tailla F) Hilsha
G) Koral
Figure 3.4.2(d): Fourier Transform of segmented images of A) Rupchandra B) Poa C) Loitta D) Bailla E) Tailla F) Hilsha G) Koral
©Daffodil International University 20 Texture Analysis:
We also use texture analysis to achieve our goal. In texture analysis, object texture is essential for matrices that are determined to quantify the expected texture of an image in image processing.Image texture provides me with knowledge of the local color or intensity arrangement of the image. A picture texture works as a quantitative arrangement measure in a statistical approach.
Some statistical technique known as edge detection, matrices of co-occurrence and the measurements of laws texture energy.
GLCM Features: We have used the GLCM feature in texture analysis.The GLCM texture image is defined by the operator generating a single beam echogram of virtual variables. GLCM indicates the co-occurrence matrix for Gray Level. The calculations for image analysis methods are correlated with it.
For GLCM algorithm:
First of all, we need to quantize the information.
Build the GLCM which is the quantization defined number of levels.
Making GLCM symmetry and standardizing the data.
The characteristic should be measured.
GLCM, the set of functions is based on statistics of the second order. The actual average for the degree of association between pairs of pixels in various aspects is used to measure in the study of GLCM. GLCM is the pixel range separation after the color model has been chosen.GLCM reflects just have a collection of patterns that we can use to recognize or classify various characteristics of this software with the aid of a recognition system.Such formulas are used to measure the image's energy, contrast, homogeneity, co-relation. In table 3.4.2, we stated the equation of GLCM feature which is used to extract the features.
©Daffodil International University 21 Table 3.4.2: The equation of GLCM feature
Energy feature Contrast feature
Correlation feature Homogeneity feature
3.4.3 Feature Selection
Here, we use PCA for the feature selection.The aim of the feature selection is to identify the features that provide an accurate description and minimize from the dimension of the features [10, 21]. In this work, we have thirteen features and minimize the features into seven types by using the PCA algorithm.
Generally, the PCA strategy interprets n vectors (𝑥1, 𝑥2,… … , 𝑥𝑖, … . . , 𝑥𝑛) from d- dimensional space to n vectors (𝑥1´, 𝑥2´, … 𝑥𝑖,´ … . , 𝑥𝑛´) in a new, 𝑑′-dimensional space as [21],
𝑥𝑖′ = ∑𝑑𝑘=1′ 𝑎𝑘,𝑖𝑒𝑘, 𝑑′ ≤ 𝑑,……… (3.7) Where 𝑒𝑘 is eigenvector and 𝑎𝑘,𝑖 is the projections of original vectors 𝑥𝑖 [21].
3.4.4 Data Procedure
We have got data for each fish after extraction of the element. We used seven different coastal fishes in our research and each fish has data of 13 features. We have used 1014 images for the testing and training data. After that, the fish can be identified easily.
©Daffodil International University 22 3.4.5 Classifier Testing
After extraction of the features, we execute some classifier for training and testing for those data.Here, these type of classifier is such as KNN, SVM and Ensemble.We have to test the classifier for fitting because we need to know which classifier gives better accuracy.
After that, we can choose the classifier that can deliver a better result.
KNN: The function for the KNN algorithm is only estimated locally and all computing is delayed until classification. It is a basic classifier of all machine learning algorithms.
SVM:SVM stands for Vector Machine Support. The SVM classifier produces a template that places new examples in one or the other group and enables it a non- probabilistic linear binary classifier.
Ensemble (Bagged Tree): The ensemble classifier is a supervised learning algorithm which can be trained easily and after that, it can make predictions based on testing data. Bagged Tree is a popular technique that can be used to minimize the variance where the algorithms have high variance.
3.5 Implementation Requirements
To fulfil this project, the tools and materials are needed.There are criteria that we need to complete our research after thorough review of all the features performed theoretically.
Such specifications help to produce a certain algorithm to properly identify fish. Some tools are needed to build a successful project. The likely things that are needed are:
Hardware and Software Requirements:
Operating System (Windows 10)
Hard Disk (50 GB)
RAM (4 GB)
Developing Tools:
Mobile to Captured Image
Matlab (2016a)
©Daffodil International University 23
CHAPTER 4
EXPERIMENTAL RESULTS AND DECISION
4.1 Introduction
The section is mainly focused on the experimental results how we conduct and analyze the data in this project. Again in this chapter, we will also briefly discuss the experimental results of our analysis.
4.2 Data Collection
Data collection is a very critical part of the research project. We implement the coastal fish recognition procedure based on machine vision as we have demonstrated in the previous section. The first point of the project is to capture the image of fish in such a background.
Here, in Bangladesh there are several types of coastal fish. In our analysis, we examine on seven different fish types.
4.3 Image Processing
Image processing is the next step after the data collection. This phase involves some operation such as image smoothing, filtering resize and segmentation to transform the image into a binary image containing only object such as image fish including the background. First of all, we have to resize and segment the all images in the step of image pre-processing. So we have to write the coding part in Matlab (2016a) and convert the images into 512 x 512 pixels which mean the all the images are same in pixels. After doing so, we mean the color analysis of RGB and HSV value. Then we need to convert the all images to a gray-scale image where the gray shade number is 256. Here, the three color such as red, green, blue are represented sequentially as R, G and B where the gray scale value of converted image is g [14].
g = (0.3 x R) + ().59 x G) + (0.11 x B) … … … (4.1)
Then, we go for the image segmentation after converting the image into a gray scale value.
We have applied the Histogram-based thresholding approach for segmentation. Here, this is the easiest and simple approach for segmentation. We have gotten the two values of thresholding and convert from gray-scale image to binary image. Here, the thresholding
©Daffodil International University 24 values are θL and θH where the every pixel is indicated by pi(x, y) and is translated into the binary value where every pixel is indicated by bi(x, y). The equation is as follow:
otherwise y x pi y if
x
bi L H
, 0
) , ( ,
) 1 ,
(
… … … (4.2)
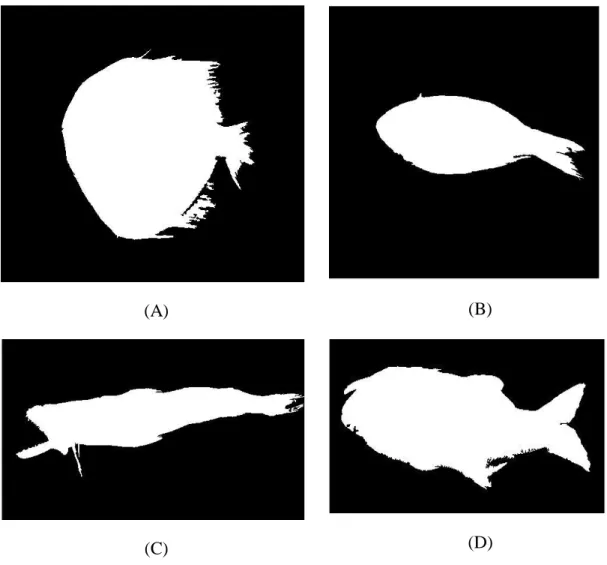
Here, the binary images are including with the background. There are some noise, if there are anything, this is removed from the binary image. And in this way, we have completed the image processing procedure. In figure 4.3, we have shown the sample of segmented image as follows.
(A) (B)
(C) (D)
Figure 4.3: Segmented images of (A) Rupchandra (B) Poa (C) Loitta (D) Tailla
©Daffodil International University 25 4.4 Feature Extraction
In our project, feature extraction is the major step to recognition the coastal fishes. To determine the characteristics of an object to be categorized, it needs that the measurement value can be found to be the same objects in same class and the different objects in various classes.In portion 3.4.2, we talk about some collection of features, we measure the values of those characteristics to distinguish the fish items. So we can recognize the fish that are same in a category and different from another class. We need to write the program to measure the values of the selected features. We write the code in Matlab (R2016a). In figure 4.3.1, we have displayed the some segmented this image of fishes.
4.5 Fitting Dataset for Classifier
For analysis and recognition the fish, we are categorized the data into portion such as training and testing data. We analysis on the more than 800 images of seven types coastal fishes. Thus, the data set is divided into two categories such as training and testing data.
We use the various ratio of data on training and testing in this project.
Firstly, the training and testing data are same. That’s mean training data is 50% of dataset.
Secondly, the training data 60% where the testing data is 40%
Thirdly, the training data 70% where the testing data is 30%
Finally, the training data 80% where the testing data is 20%
Here, we change the ratio of data set so that we can understand the change of accuracy in different ratio and classifiers. However, we use the various classifiers to check which classifiers have given the best accuracy. So, we import the different package of image processing and data analysis using the Matlab (2016a).
4.6 Experimental Result
After analysis, the images of coastal fish have trained the data using classifier algorithms.
After all, we have done experimental results and determined the fish items although it is hard to recognize the coastal fish. However, it is possible to recognize it.
©Daffodil International University 26 4.7 Accuracy Model
We have applied the three classifiers for the best accuracy measurement. Here, the three classifiers are Support Vector Machine (SVM), k-nearest neighbors (KNN) and Ensemble (Bagged Tree) which are used in this research. Again, confusion matrix is a well-known table to define the classifier model or classifier results. Again, we have applied the PCA algorithm for all the classifiers. But the accuracy is less when we have applied the PCA algorithm for the classifiers with the same data. This is demonstrated in the accuracy analysis and confusion matrix.
©Daffodil International University 27 SVM Classifier
The result for 50% training data (407 images) and 50% testing data (407 images) Table 4.7.1: Confusion Matrix of 50% training data for SVM classifier
Predicted/
True Class
Bailla Hilsha Koral Loitta Poa Rupchandra Tailla
Bailla 58 1 1
Hilsha 60
Koral 37 1
Loitta 1 74
Poa 75
Rupchandra 75
Tailla 24
The accuracy of SVM classifier of 50% training set is 99.0%.
The result for 60% training data (489 images) and 40% testing data (325 images) Table 4.7.2: Confusion Matrix of 60% training data for SVM classifier
Predicted/
True Class
Bailla Hilsha Koral Loitta Poa Rupchandra Tailla
Bailla 70 1 1
Hilsha 72
Koral 1 45
Loitta 1 89
Poa 90
Rupchandra 90
Tailla 29
The accuracy of SVM classifier of 60% training set is 99.2%.
©Daffodil International University 28
The result for 70% training data (570 images) and 30% testing data (244 images) Table 4.7.3: Confusion Matrix of 70% training data for SVM classifier
Predicted/
True Class
Bailla Hilsha Koral Loitta Poa Rupchandra Tailla
Bailla 83 1
Hilsha 84
Koral 52 1
Loitta 1 104
Poa 105
Rupchandra 105
Tailla 1 33
The accuracy of SVM classifier of 70% training set is 99.3%.
The result for 80% training data (651 images) and 20% testing data (163 images) Table 4.7.4: Confusion Matrix of 80% training data for SVM classifier
Predicted/
True Class
Bailla Hilsha Koral Loitta Poa Rupchandra Tailla
Bailla 93 1 2
Hilsha 96
Koral 60 1
Loitta 1 119
Poa 120
Rupchandra 120
Tailla 1 37
The accuracy of SVM classifier of 80% training set is 99.1%.
©Daffodil International University 29 KNN Classifier
The result for 50% training data (407 images) and 50% testing data (407 images) Table 4.7.5: Confusion Matrix of 50% training data for KNN classifier
Predicted/
True Class
Bailla Hilsha Koral Loitta Poa Rupchandra Tailla
Bailla 57 2 1
Hilsha 60
Koral 1 37
Loitta 1 74
Poa 75
Rupchandra 75
Tailla 1 23
The accuracy of KNN classifier of 50% training set is 98.5%.
The result for 60% training data (489 images) and 40% testing data (325 images) Table 4.7.6: Confusion Matrix of 60% training data for KNN classifier
Predicted/
True Class
Bailla Hilsha Koral Loitta Poa Rupchandra Tailla
Bailla 70 1 1
Hilsha 72
Koral 1 45
Loitta 1 89
Poa 90
Rupchandra 90
Tailla 1 28
The accuracy of KNN classifier of 60% training set is 99.0%.
©Daffodil International University 30
The result for 70% training data (570 images) and 30% testing data (244 images) Table 4.7.7: Confusion Matrix of 70% training data for KNN classifier
Predicted/
True Class
Bailla Hilsha Koral Loitta Poa Rupchandra Tailla
Bailla 80 3 1
Hilsha 84
Koral 1 52
Loitta 1 104
Poa 105
Rupchandra 105
Tailla 1 33
The accuracy of KNN classifier of 70% training set is 98.8%.
The result for 80% training data (651 images) and 20% testing data (163 images) Table 4.7.8: Confusion Matrix of 80% training data for KNN classifier
Predicted/
True Class
Bailla Hilsha Koral Loitta Poa Rupchandra Tailla
Bailla 94 2
Hilsha 96
Koral 1 60
Loitta 1 119
Poa 120
Rupchandra 120
Tailla 38
The accuracy of KNN classifier of 80% training set is 99.4%.
©Daffodil International University 31 Ensemble Classifier (Bagged Tree)
The result for 50% training data (407 images) and 50% testing data (407 images) Table 4.7.9: Confusion Matrix of 50% training data for Bagged Tree classifier
Predicted/
True Class
Bailla Hilsha Koral Loitta Poa Rupchandra Tailla
Bailla 60
Hilsha 60
Koral 38
Loitta 1 73 1
Poa 1 74
Rupchandra 75
Tailla 24
The accuracy of Bagged Tree classifier of 50% training set is 99.3%.
The result for 60% training data (489 images) and 40% testing data (325 images) Table 4.7.10: Confusion Matrix of 60% training data for Bagged Tree classifier
Predicted/
True Class
Bailla Hilsha Koral Loitta Poa Rupchandra Tailla
Bailla 72
Hilsha 72
Koral 46
Loitta 1 88 1
Poa 1 89
Rupchandra 90
Tailla 29
The accuracy of Bagged Tree classifier of 60% training set is 99.4%.
©Daffodil International University 32
The result for 70% training data (570 images) and 30% testing data (244 images) Table 4.7.11: Confusion Matrix of 70% training data for Bagged Tree classifier
Predicted/
True Class
Bailla Hilsha Koral Loitta Poa Rupchandra Tailla
Bailla 84
Hilsha 84
Koral 53
Loitta 1 103 1
Poa 1 1 103
Rupchandra 105
Tailla 34
The accuracy of Bagged Tree classifier of 70% training set is 99.3%.
The result for 80% training data (651 images) and 20% testing data (163 images) Table 4.7.12: Confusion Matrix of 80% training data for Bagged Tree classifier
Predicted/
True Class
Bailla Hilsha Koral Loitta Poa Rupchandra Tailla
Bailla 94 2
Hilsha 96
Koral 1 60
Loitta 1 119
Poa 120
Rupchandra 120
Tailla 38
The accuracy of Bagged Tree classifier of 80% training set is 99.4%.
©Daffodil International University 33 Accuracy Comparison between Classifiers Algorithms
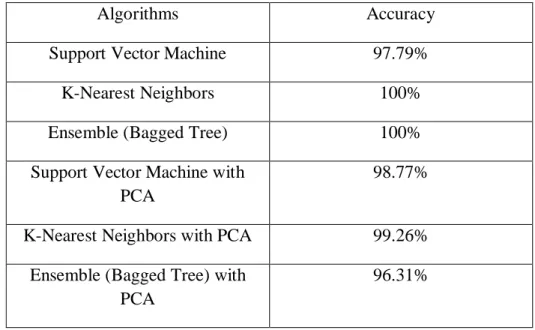
The result for 50% testing data (407 images)
Table 4.7.13: Comparison the accuracy for 50% testing data for all classifiers
Algorithms Accuracy
Support Vector Machine 97.79%
K-Nearest Neighbors 100%
Ensemble (Bagged Tree) 100%
Support Vector Machine with PCA
98.77%
K-Nearest Neighbors with PCA 99.26%
Ensemble (Bagged Tree) with PCA
96.31%
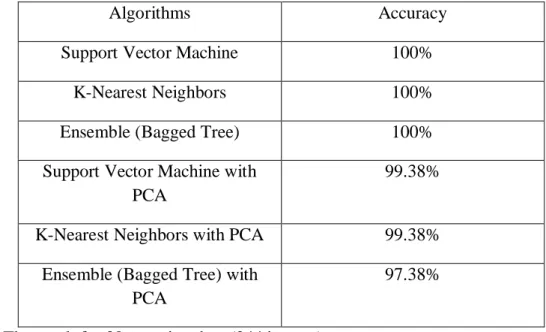
The result for 40% testing data (325 images)
Table 4.7.14: Comparison the accuracy for 40% testing data for all classifiers
Algorithms Accuracy
Support Vector Machine 100%
K-Nearest Neighbors 100%
Ensemble (Bagged Tree) 100%
Support Vector Machine with PCA
99.38%
K-Nearest Neighbors with PCA 99.38%
Ensemble (Bagged Tree) with PCA
97.38%
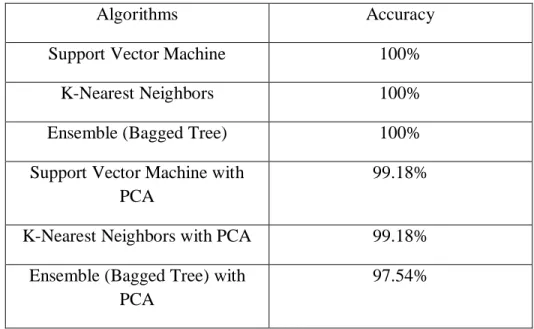
The result for 30% testing data (244 images)
©Daffodil International University 34 Table 4.7.15: Comparison the accuracy for 30% testing data for all classifiers
Algorithms Accuracy
Support Vector Machine 100%
K-Nearest Neighbors 100%
Ensemble (Bagged Tree) 100%
Support Vector Machine with PCA
99.18%
K-Nearest Neighbors with PCA 99.18%
Ensemble (Bagged Tree) with PCA
97.54%
The result for 20% testing data (163 images)
Table 4.7.16: Comparison the accuracy for 20% testing data for all classifiers
Algorithms Accuracy
Support Vector Machine 99.39%
K-Nearest Neighbors 100%
Ensemble (Bagged Tree) 100%
Support Vector Machine with PCA
99.39%
K-Nearest Neighbors with PCA 98.77%
Ensemble (Bagged Tree) with PCA
98.77%
©Daffodil International University 35 4.8 Descriptive Analysis
In this research, we have divided the dataset into two set as training and testing set. Firstly, the dataset is classified into two part as training 50% and testing 50%. Secondly, the dataset is classified into two part as training 60% and testing 40%. Thirdly, the dataset is classified into two part as training 70% and testing 30%. Fourthly the dataset is classified into two part as training 80% and testing 20%. Then, the training data analyze with the PCA algorithm to measure how the accuracy has come.
In this study, we have found that the accuracy is less when it is applied PCA with the classifier algorithms. But the difference is much less comparing with the accuracy of classifier algorithms such as less than 2%.
4.9 Summary
In this analysis, K-Nearest Neighbors (KNN) is the most efficient and accurate for this research work. Here, if we change the training data set ratio, the classifier's accuracy changes as well. But the difference of accuracy is not more than 2%. However, for the successful the work, the species should be added for the further works.
©Daffodil International University 36
CHAPTER 5
SUMMARY, CONCLUSION, RECOMMENDATION
&
IMPLECATION FOR FUTURE RESEARCH
5.1 Summary of the study
Many works have been done in the area of image processing. Here, the remarkable works are on the fruit, food and fruit disease. But there are little work on the area of fishery section. Even in our country, we are behind on this resourceful area. Moreover, there is also some research on tropical fish, and more is trending right now. Furthermore, we have a great opportunity to facilitate our condition. Over 2% of the price of exports comes from the fisheries sector. The fisheries of our country plays a significant role in the growth of economy. It is notified that 3.69% of GDP growth value come from this sector which is same 22.60% in the GDP of agricultural [5]. Even, we are dependent for protein on fish.
For the perspective, we am taking an effort to work on this area. And it is successfully done by the help of machine vision.
5.2 Conclusions
To identify fish, we used color analysis, gray scale and geometric characteristics. We have used three type classifier for the better accuracy in recognition. Among of them, the result is shown to us that the SVM classifier give the best accuracy in this approach. Here, the most important thing, the more training set will be given the more accuracy by the approach of SVM.
5.3 Limitations
1)When two or more items are in the picture, the outcome will be incorrect.
2) We don’t use the sufficient dataset.
©Daffodil International University 37 5.4 Recommendations
1)More data set would show excellent results for this research work.
2) The horizontal and vertical training set will give the better accuracy
5.5 Implication of further study
1) For better accuracy, the more dataset will be needed.
2) In our work, we use the seven type of fish. The more fish’s species would be added.
3) More classifier can be added or Neural Network can be added for the better accuracy.
©Daffodil International University 38 References
[1] Bangladesh Population 2019, available on:
[http://worldpopulationreview.com/countries/bangladesh-population/]
[Last accessed on 10 October, 2019]
[2] Protein Intake: https://www.healthline.com/nutrition/how-much-protein-per-day [Last accessed on 15 October, 2019]
[3] Fishhttp://en.banglapedia.org/index.php?title=Fish
[Last accessed on 15 October, 2019]
[4] Dried Fish, Available on: https://www.healthline.com/nutrition/10-foods-almost-pure- protein#section4
[Last accessed on 15 October, 2019]
[5] Md. M. Shamsuzzaman, M. MahmudulIslam, N. J. Tania, Md.Abdullah Al-Mamun, P.
P. Barman, X. Xu, “Fisheries resources of Bangladesh: Present status and future direction”, Aquaculture and Fisheries, vol. 2, issue 4, pp. 145-156, July 2017.
[6] C. Alasalvar, Handbook of seafood quality, safety, and health applications. Ames, IA:
Blackwell Pub., 2011.
[7] Threatened Freshwater Fishes of Bangladesh: http://en.bdfish.org/2017/03/threatened- freshwater-fishes-of-bangladesh/
[Last accessed on October 15, 2019]
[7] S.Arivazhagan, R.Newlin Shebiah, S.Selva Nidhyanandhan and L.Ganesan, “Fruit Recognition using Color and Texture Features,” Journal of Emerging Trends in Computing and Information Sciences, vol. 1, pp.90-94, Oct. 2010.
[8] N. A. Semary, A.Tharwat, E.Elhariri, A.E. Hassanien, “Fruit-Based Tomato Grading System Using Features Fusion and Support Vector Machine”, IEEE Conference
Intelligent Systems, pp. 401-410, 2014.
[9]F. García-Lamont, J. Cervantes, S. Ruiz, and A. López-Chau, “Color Characterization Comparison for Machine Vision-Based Fruit Recognition,” Intelligent Computing
Theories and Methodologies Lecture Notes in Computer Science, pp. 258–270, Aug.
2015.
©Daffodil International University 39 [10]Y. Zhang, S. Wang, G. Ji, and P. Phillips, “Fruit classification using computer vision and feedforward neural network,” Journal of Food Engineering, vol. 143, pp. 167–177, Dec. 2014.
[11]B. Zhang, W. Huang, L. Gong, J. Li, C. Zhao, C. Liu, and D. Huang, “Computer vision detection of defective apples using automatic lightness correction and weighted RVM classifier,” Journal of Food Engineering, vol. 146, pp. 143–151, Feb. 2015.
[12] A.Sluzek, “Machine Vision Applications to Aquatic Foods: A Review”, Journal of Food Engineering, pp. 167–177, 2014.
[13] B.Gümüş, M. Ö. Balaban, M. Ünlüsayın, “Machine Vision in Food Recognition:
Attempts to Enhance CBVIR Tools”, Position Papers of the Federated Conference on Computer Science and Information Systems, vol. 9, pp. 57–61, 2016.
[14]M. T. Habib, A. Majumder, A. Jakaria, M. Akter, M. S. Uddin, and F. Ahmed,
“Machine vision based papaya disease recognition,” Journal of King Saud University - Computer and Information Sciences, Jun. 2018.
[15]K. Yanai and Y. Kawano, “Food image recognition using deep convolutional network with pre-training and fine-tuning,” 2015 IEEE International Conference on Multimedia & Expo Workshops (ICMEW), Jun. 2015.
[16] M. Dowlati, M. D. L. Guardia, M. Dowlati, and S. S. Mohtasebi, “Application of machine-vision techniques to fish-quality assessment,” TrAC Trends in Analytical Chemistry, vol. 40, pp. 168–179, Nov. 2012.
[17]J. Hu, D. Li, Q. Duan, Y. Han, G. Chen, and X. Si, “Fish species classification by color, texture and multi-class support vector machine using computer vision,” Computers and Electronics in Agriculture, vol. 88, pp. 133–140, Oct. 2012.
[18]I. Sharmin, N. F. Islam, I. Jahan, T. A. Joye, M. R. Rahman, and M. T. Habib,
“Machine vision based local fish recognition,” SN Applied Sciences, vol. 1, no. 12, Nov.
2019.
[19]F. Storbeck and B. Daan, “Fish species recognition using computer vision and a neural network,” Fisheries Research, vol. 51, no. 1, pp. 11–15, Apr. 2001.
[20] M. K.Alsmadi, K. B. Omar, S. A. Noah and I. Almarashdeh “Fish Recognition Based on Robust Features Extraction from Size and Shape Measurements Using Neural Network,” Journal of Computer Science, vol. 6, no. 10, pp. 1088–1094, Oct. 2010.
©Daffodil International University 40 [21]