“IoT BASED TRANSPORT MANAGEMENT SYSTEM”
Submitted By ZAWYED IVNA MONIR ID: 153-15-6468 AND
SHAMAN SHAH
ID: 153-15-6361
This Report Presented in Partial Fulfillment of the Requirements for the Degree of Bachelor of Science in Computer Science and Engineering.
Supervised By
SHAM MD. TANVIR SIDDIQUEE
Assistant Professor Department of CSE
Daffodil International University
Co-Supervised By
RAJA TARIQUL HASAN TUSHER Senior Lecturer
Department of CSE
Daffodil International University
DAFFODIL INTERNATIONAL UNIVERSITY DHAKA, BANGLADESH
SEPTEMBER 2021
©Daffodil International University i
APPROVAL
This Project titled “IoT Based Transport Management System”, submitted by “Zawyed Ivna Monir (ID: 153-15-6468)” and “Shaman Shah (ID: 153-15-6361)” to the Department of Computer Science and Engineering, Daffodil International University, has been accepted as satisfactory for the partial fulfillment of the requirements for the degree of B.Sc. in Computer Science and Engineering and approved as to its style and contents.
The presentation has been held on 19 August 2021.
BOARD OF EXAMINERS
________________________
Dr. Touhid Bhuiyan Professor and Head
Department of Computer Science and Engineering Faculty of Science & Information Technology Daffodil International University
Chairman
________________________
Nazmun Nessa Moon Assistant Professor
Department of Computer Science and Engineering Faculty of Science & Information Technology Daffodil International University
Internal Examiner
©Daffodil International University ii
External Examiner ________________________
Gazi Zahirul Islam Assistant Professor
Department of Computer Science and Engineering Faculty of Science & Information Technology Daffodil International University
________________________
Dr. Md Arshad Ali Associate Professor
Department of Computer Science and Engineering Hajee Mohammad Danesh Science and Technology University
External Examiner External Examiner Internal Examiner
©Daffodil International University iii
DECLARATION
We hereby declare that this project has been done by us under the supervision of Shah Md.
Tanvir Siddiquee, Assistant Professor, Department of CSE Daffodil International University. We also declare that neither this project nor any part of this project has been submitted elsewhere for award of any degree or diploma.
Supervised by:
Shah Md. Tanvir Siddiquee Assistant Professor
Department of CSE
Daffodil International University
Co-Supervised by:
Raja Tariqul Hasan Tusher Senior Lecturer
Department of CSE
Daffodil International University
Submitted by:
Zawyed Ivna Monir ID: 153-15-6468 Department of CSE
Daffodil International University
©Daffodil International University iv Shaman Shah
ID: 153-15-6361 Department of CSE
Daffodil International University
©Daffodil International University v
ACKNOWLEDGEMENT
First, we express our heartiest thanks and gratefulness to almighty Allah for His divine blessing makes us possible to complete the final year project/internship successfully.
We are really grateful and wish our profound indebtedness to Shah Md. Tanvir Siddiquee, Assistant Professor, Department of CSE Daffodil International University, Dhaka. Deep Knowledge & keen interest of our supervisor in the field of “IoT, Web Development & Android Application” to carry out this project. His endless patience, scholarly guidance, continual encouragement, constant and energetic supervision, constructive criticism, valuable advice, reading many inferior drafts and correcting them at all stages have made it possible to complete this project.
We would like to express our heartiest gratitude to Professor Dr. Touhid Bhuiyan, Head, Department of CSE, for his kind help to finish our project and also to other faculty members and the staffs of CSE department of Daffodil International University.
We would like to thank our entire course mate in Daffodil International University, who took part in this discussion while completing the course work.
Finally, we must acknowledge with due respect the constant support and patients of our beloved parents.
©Daffodil International University vi
ABSTRACT
This report is intended as a guide for teachers and engineering students when conducting research is part of course-work requirements. In this project we tried to develop a system combination of IoT, Web Application & Android Application to help manage & run a whole transportation system (such as bus). We know that the transportation system of our country is not digitized and not organized at all. There are no rules and regulations and an organized management does not exist. This is a form for both ends of business, for passengers and for bus owners and institutes. So, we decided to make a system with the help of IoT, Web Application & Android Application to manage all the necessary information about passengers, fairs, vehicles, routes, profits, losses etc. It will be fully digitized and online based and user friendly to ensure the best possible outcome. Owners can remotely see which bus is coming and going, their passenger numbers, fairs, routes etc.
Admin users can view/ delete/ activate/ modify all the information and modify it. By using our system, the Government can also benefit and our country can develop even more.
Because there will be no corruption in the transportation field and all the information Government can get about local transports and can know the total income from it. By this Government can also fix taxes from it which is very difficult if right information is not in hand. So, it will be hugely beneficial for both the Government and country. Because a good amount of our country's annual income comes from the transportation field. And we have plan to improve the features and facilities even further.
©Daffodil International University vii
Table of Content
CONTENTS PAGE
Approval Page I
Declaration III
Acknowledgements V
Abstract VI
Table of Content VII
List of figures IX
List of Tables X
Chapter 1: Introduction 01 - 03
1.1 Introduction 01
1.2 Motivation 01
1.3 Objectives 02
1.4 Expected Outcomes 02
1.5 Project Management and Finance 02
1.6 Report Layout 03
Chapter 2: Background 04 - 06
2.1 Preliminaries/Terminologies 04
2.2 Related Works 04
2.3 Comparative Analysis 04
2.4 Scope of the Problem 05
2.5 Challenges 06
Chapter 3: Requirement Specification 07 - 11
3.1 Business Process Modeling 07
3.2 Requirement Collection and Analysis 08
3.3 Use Case Modeling and Description 10
3.4 Logical Data Model 11
3.5 Design Requirement 11
Chapter 4: Design Specification 12 - 26
4.1 Front-end Design 12
4.2 Back-end Design 22
4.3 Interaction Design and User Experience (UX) 26
4.4 Implementation Requirements 26
©Daffodil International University viii Chapter 5: Implementation and Testing 27 - 28
5.1 Implementation of Database 27
5.2 Implementation of Front-end Design 27
5.3 Testing Implementation 27
5.4 Test Results and Reports 27
Chapter 6: Impact on Society, Environment and Sustainability 29
6.1 Impact on Society 29
6.2 Impact on Environment 29
6.3 Ethical Aspects 29
6.4 Sustainability Plan 29
Chapter 7: Conclusion and Future Scope 30
7.1 Discussion and Conclusion 30
7.2 Scope for Further Developments 30
References 31
©Daffodil International University ix
LIST OF FIGURES
FIGURES PAGE NO
Figure 3.1: Transport Management System business model 08
Figure 3.2: Use case diagram for the system 10
Figure 4.1: User home page and dashboard 12
Figure 4.2: User/Company Login Page 13
Figure 4.3: Detailed Bus Statistics page and All Their Information 13 Figure 4.4: Live bus location and information page 14 Figure 4.5: Individual bus detail information page/directory 15
Figure 4.6: Income summary detail in dashboard 15
Figure 4.7: Income/Revenue chart(bar) in dashboard 16 Figure 4.8: Income/Revenue chart(pie) in dashboard 16 Figure 4.9: Bus location with indicator in Google map 17 Figure 4.10: Bus location(path) with indicator and information 18
Figure 4.11: Android app home page 19
Figure 4.12: Android application setting and control page 20 Figure 4.13: Graphical repetition of bar chart of different transports of
the app
21
Figure 4.14: Graphical repetition of pie chart of different transports of the app
21
Figure 4.15: Graphical representation of different locations of buses 22 Figure 4.16: Locations of transports shown in Google map 22 Figure 4.17: Footage of camera object tracking process 23
Figure 4.18: Output result 24
Figure 4.19: Raspberry pi OS home screen 24
Figure 4.20: Raspberry pi 4 model B2 25
Figure 4.21: Raspberry pi Noir camera v2 25
Figure 4.22: 7 Factor that Influence User Experience [2] 26
©Daffodil International University x
LIST OF TABLES
TABLES PAGE
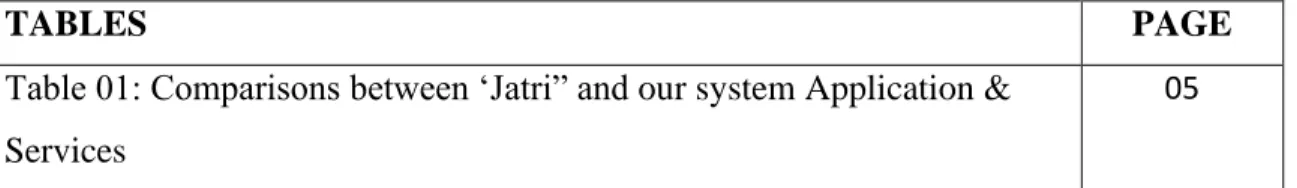
Table 01: Comparisons between ‘Jatri” and our system Application &
Services
05
©Daffodil International University 1
CHAPTER 1
INTRODUCTION
1.1 Introduction
With the birth of Digital Bangladesh, day by day the number of jobs, works, industries, schools, colleges, universities and many other organizations is increasing. On the other hand, the population of our country is also increasing drastically day by day. So, the need for transportation is becoming more and more crucial. But in our country, there are no improved transportation system and the majority of our people do not have personal vehicles. So, people have to rely on public transportation such as bus for travelling home and workplaces. But there is no organized management system in our transportation field.
Rules and regulations are not maintained at all. And there are no specific seat or fair system and most of them are offline based (specially in local public transports). They run their business however they want and it is suffering for both ends, for the general people (passengers/customers) and for the business owners and organizations.[1]
Our “IoT Based Transport Management System” will bring a whole organized system for all the management and passenger tracking, fare count, bus route management, all the profit and loss count etc. And it will be digitized and online based with the help of IoT, Web Application & Android Application for the best outcome. In this way the passengers and the bus owner’s business both will be benefited.
1.2 Motivation
The transport sector in Bangladesh is characterized by weak public and private institutions and low level of investment. Rapid population, urbanization, and motorization growth with unplanned way has been a significant cause of multidimensional problems in Dhaka city and inclined to deterioration the accessibility of service levels, safety, comfort, public transport operational deficiency, causes very limited road area only (7-10%) (route) insufficient effective maintenance, geometrical design, road surface condition are not suitable for buses, poor condition of bus industry management, mixed poor traffic with over concentration of non-motorized vehicles, not enough dependable public transport system and inadequate parking facilities, traffic management practice, manually traffic control in the inter-section have generated a significant deteriorating of public transport and environmental problems in Dhaka city.
So, we decided to create a system to manage all the necessary things to run a transport system which is easy, user friendly and online based to ensure a safe and organized management system for benefiting both general people like us and also transport services.
©Daffodil International University 2
1.3 Objectives
• To create a management system to maintain all the curriculums online.
• To keep track of passengers coming and going.
• To count and calculate fares of all the passengers.
• To save time.
• To save cost.
• To cut all the middlemen for better business for the owners.
• To overcome third-party harassment.
• To give better services to the passengers.
• To give access to everything remotely through online for the best system.
• To give all the information of all the vehicles and their incomes.
• To keep track of all the profits and losses.
• Giving information of all vehicle’s routes and location through Google Map.
1.4 Expected Outcome
“IoT Based Transport Management System” is an online transport management system that not only saves time and manages all the curriculums but also provides fast results and great output. By using this management system companies can easily monitor their all their transport information, location, routes, fairs, passengers, drivers etc.
This management system has following features:
• Companies and owners can easily monitor all the information about their all transports remotely by online.
• They can change and modify their information, fares, routes, capacity, bus numbers, bus counts etc.
• All the necessary calculations about fairs, profits and losses will be visible in the system.
• No middleman needed to ensure third party harassment.
1.5 Project Management and Finance
For making this project up and running we needed many things and we had to manage a lot of devices, systems and processes. First for the IoT devices we collected a “Raspberry pi 4 complete set” which costs 6000 taka. For the camera module “Raspberry Pi NoIR Camera V2 8MP” which costs 3300 taka, 16 GB memory card (800 taka), display adapter (200 taka) and other necessary components. We also managed and arranged all the
©Daffodil International University 3 necessary operating systems, software, programs to run Raspberry pi. We also collected all the software, programs and applications to build the designated website. The management process was very hard and a good amount of money has been spent for this project.
1.6 Report Layout
At first in this report in chapter one, we wrote about introduction, motivation objective, expected outcome and project management and finance.
Then in the second chapter we have written about the background of the project such as preliminaries, related works, comparative Analysis, scope of the problem and challenges.
Third chapter is about requirement specification.
In the fourth chapter we mentioned design specification which includes front-end design, back-end design, interaction design, user experience (UX) and implementation requirements.
In chapter five we wrote about implementation and testing which includes implementation of database, implementation of front-end design, testing implementation & test results and reports.
Chapter six is about Impact on Society, Environment and Sustainability.
And chapter seven is about conclusion and future scope of work.
©Daffodil International University 4
CHAPTER 2 BACKGROUND 2.1 Preliminaries
This management system will deal with all the information and fair counts of all the transports in the company. IOT based smart cameras will be installed in every vehicle and a mini computer (raspberry pi) will be installed for tracing and information processing. The information will be sent through a server and the company can easily monitor everything through a designated website. A website will be available to monitor and modify all the information remotely. This will save time, money and unnecessary harassment and all the data will be accurate which will ensure business quality and better service for the people.
All the things about this management system are unique, combined and user-friendly.
2.2 Related Works
This management system works by IoT devices and web applications to control the system.
There is no online transport management system in Bangladesh. There are some bus services where we can buy tickets online but there is no whole management system which is online. And for local transport services there are no systems. But with this system and with the help of IoT, Web Application & Android Application we can build a system suitable for all kinds of public transports. It is fast, user friendly, secure, hassle free and low cost.
2.3 Comparative Studies
Comparatively, there are a very few bus services with online ticket booking systems are available in the market but there is no complete management system established in our country. Especially for public and local transports. In our project there will be a website and webpage to monitor and control the whole managing process. We have plans to apply this system in Android too.
There is a similar service in the market which is called “Jatri” which is a service for Passengers with an Android application. But our project and their service are totally different work methods and for different purposes. The comparisons are given below-
©Daffodil International University 5 Table 01: Comparisons between ‘Jatri” and our system Application & Services
Name Their Application & Services Our Application & Services Jatri • ‘‘Jatri’ is a mobile application
which is in the play store and it is for passengers to book cars and bus seats.
• They provide passenger support to book seats online and customers can see which bus will arrive at which stoppage in designated time.
• They provide services for online payment.
• There is also an app for owners for
‘Jatri’ which gives access to Admin/Owner to see all the information. But it is not a whole management system.
• In their application there are features for booking seats, bus arrival time, bus stoppage locations, fair information, online payment. These feathers are all for passengers/customers
• Our ‘Transport Management System’ is a service combination of IoT, web application & android application for managing the whole business and management of a transport company for better organized service providing and profits.
• Our application is only for owners and system runners to manage a company’s whole transport system.
• Collecting, sending, processing information specially information about passengers count coming and going, current number of passengers in every bus, bus locations, bus routes are fully automated by
IoT system which
automatically sends data to our server and shows on our web application.
• In our application there are fetchers for seeing dashboard, total income, daily income, income percentage for every bus, bus information, driver information, maps, locations, routes, current route indicator, income chart, statistics etc.
2.4 Scope of the Problem
The scope of the problem was to arrange and set up all the IoT devices. We had to collect all the components from different shops and had to spend a good amount of money for it.
And setting them all up and making them work together was also a big problem. Specially,
©Daffodil International University 6 camera setup and camera tracking process were big problems. And building an entire website for the whole management and dealing with databases was also a big issue. We faced various problems to make this project happen.
2.5 Challenges
Collecting Components: One of the most challenges were collecting all the components and devices for this project. We had to go to different shops to collect all the materials. It costs both time and money.
Setting up all the Devices: Setting up all the devices and making them all running smoothly and correctly was also a big challenge. As we are new in the IoT field it was difficult to understand and do all the work.
Running Codes: Building and running different codes in “Raspberry pi 4” microprocessor was a huge challenge. Resources are very limited in this section. We had to give a lot of time and effort to run and implement all the necessary codes and libraries.
Requirements: Another challenging matter was to build and design the whole web application. It needed to be good looking, user friendly and perfectly running. So, it was a big challenge.
Database Management: Managing and dealing with data was a big issue. There will be a lot of wanted, unwanted, necessary and garbage data to store, process and calculate. So, managing the data segment was a big problem.
Time Scheduling: It is very hard to complete the project on time. Because there is a matter of dividing the time correctly.
Poor Communication: We are developing this project. It is very tough to get together and solve every stage of the project problem. Effective communications are very important to make this project successful. And our communication was hampered for different reasons.
Like the COVID-19 situation made it very bad.
©Daffodil International University 7
CHAPTER 3
REQUIREMENT SPECIFICATION 3.1 Business Process Modeling
Business process displaying (BPM) in business process management and contexts designing is the movement of speaking to procedures of an undertaking, with the goal that the current procedure might be separated, enhanced, and mechanized. BPM is normally accomplished by business investigators, who give ability in the indicative of discipline; by topic specialists, who have specific information of the procedures being displayed; or all the more regularly by a group involving both. Then again, the procedure model can be gotten frankly from occasions' logs utilizing process mining instruments.
The business objective is frequently to expand process speed or lessen process duration; to build quality; or to diminish costs, for example, work, materials, scrap, or capital expenses.
By and by, an administration choice to put resources into business process displaying is frequently spurred by the need to report prerequisites for a data innovation venture. Change administration programs are regularly essential to incorporate any enhanced business forms. With advances in program plan, the vision of BPM models winding up completely executable
.
Our business model is given below-
©Daffodil International University 8 Figure 3.1: Transport Management System business model
3.2 Requirement Collection and Analysis
There are two types of requirements for development. One is the functional requirement and the other requirement is nonfunctional.
Functional Requirements
The proposed system has the following functionalities:
• Transport Management System Sign in.
• Transport Management System Sign up.
©Daffodil International University 9
• Transport Management System can view all the information about all their transports.
• Transport Management System can search based on advanced search.
• Company can create multiple databases.
• Companies can update their profile information.
• Admin can see all applications and take any action.
• Admin endorses the positions posted by the organization.
• Companies can Register to the entry.
Non-Functional Requirements
The significant distinction among Functional and Non-functional contrast rests in two keywords. “What” and “How”. Although key system functional requirements are described, how to Achieve System Quality features are discussed by nonfunctional requirements. The non-functional prerequisites center around the adaptability of the application, security of the application, dependability and support of the application which is guaranteed by confirming and approving the application. The proposed system meets the non-functional requirements like security by several form validations and password encryptions, reliability by maintaining integrity with error messages, controlling access of the users. The application is made more adaptable with a high-level inquiry including that channel and conveys mentioned information from a gigantic measure of information. Since the application code is measured in nature, practicality and reusability is likewise guaranteed.
©Daffodil International University 10
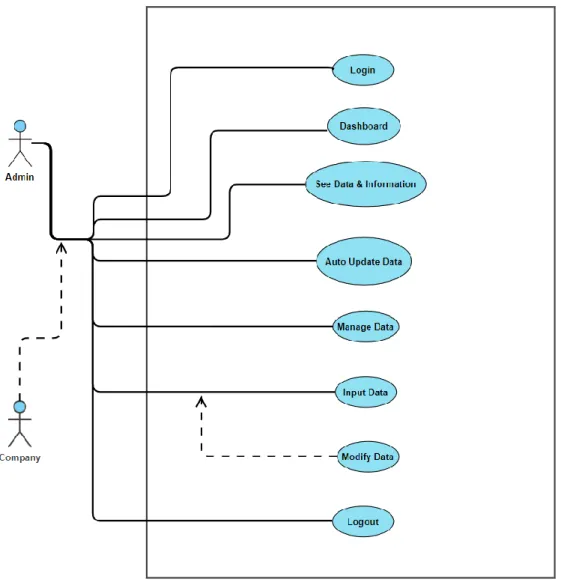
3.3 Use Case Modeling and Description
Figure 3.2: Use case diagram for the system
In this website Admin can log in and after log in they can see the whole web page with dashboard. In the dashboard there will be all the necessary information and graphical reorientation and statistics for all the transports. Admin can input, delete, modify, view data and the calculation will be automatic. Company can also do all these activities according to permissions and accessibility. It depends on the ‘Buy Plan’ of this system.
©Daffodil International University 11
3.4 Logical Data Model
An Entity Relationship Diagram (ERD) is a visual representation of different entities within a system and how they relate to each other. The logical data model presents the Entity-relationship diagram called the ER diagram. It is a graphical portrayal of my sensible information models. It really encourages us to plan the information base without any problem. It gives us an away from my eventual outcome that we can ensure we are in good shape before we've done any coding. It furnishes a diagram to work with when we do begin making the actual database.
3.5 Design Requirements
System Design is the process of defining the components, API, database tables, etc. for a system to satisfy the specified functional and non-functional requirements. The architectural description of a System with details about its components and sub components is called System design. To have a successful design or system design requirements is a major part of software engineering. I have found out some points for the design requirements which are given below-
Efficient: Running the application faster on any device is very important. We made our application very smoother and bug-free. We made this application design very light.
User-Friendly: Transport Management System is very much user-friendly. People will easily be able to access all of the features smoothly. The design is very soft and all the layouts are very well decorated.
Compatible to various devices: Transport Management System is compatible with any with most of the browsers. And IOT devices are previously set.
This is a very analytical method. The collected requirements must have some basic characteristics such as measurability and testability. Getting all the desired requirements for the system is not very easy.
©Daffodil International University 12
CHAPTER 4
DESIGN SPECIFICATION 4.1 Front-End Design
Front-end is the visual part of an application. We try to design our application more attractive.
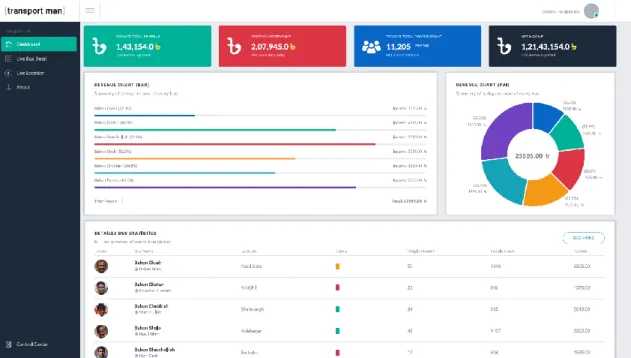
Figure 4.1: User home page and dashboard
Figure 4.1: shows the home page and dashboard of the Transport Management System application. Home page contains all the links to visit in the system and to execute the tasks.
Login, sign up, dashboard, current statistics, all vehicle information are connected to this home page. In this page it has fetchers to see and view incomes, their statistics, charts, visual representations, list of drivers, buses, location, fair information.
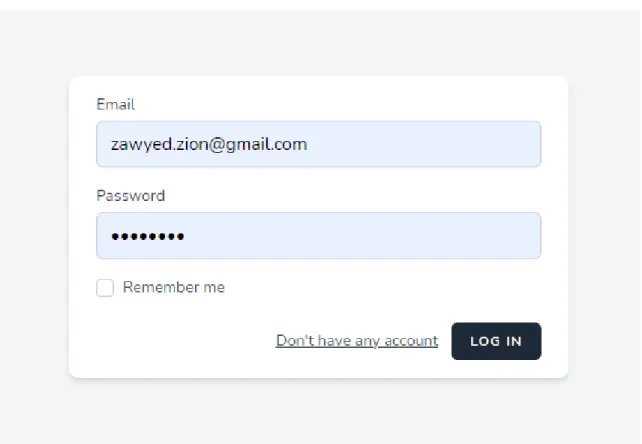
©Daffodil International University 13 Figure 4.2: User/Company Login Page
Figure 4.2: show candidate/company clickable sign up from. According to the visitor category they click the link and go to another page.
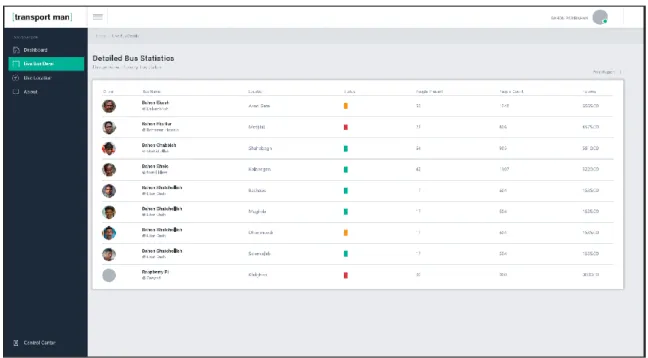
Figure 4.3: Detailed Bus Statistics page and All Their Information.
©Daffodil International University 14 Figure 4.3: show the list of all the drivers, transports and vehicles and their all-necessary information, stats and visual representations. In the list there are columns which provide different detailed information. Like in the first column there are pictures of bus drivers, in second bus names and driver names, then bus status whether the bus is going(green) or in traffic(yellow) or stopped(red) then the number of people present in the bus, total people count in current day and net income. All these information can be viewed for every single transport and it will be automatically updating.
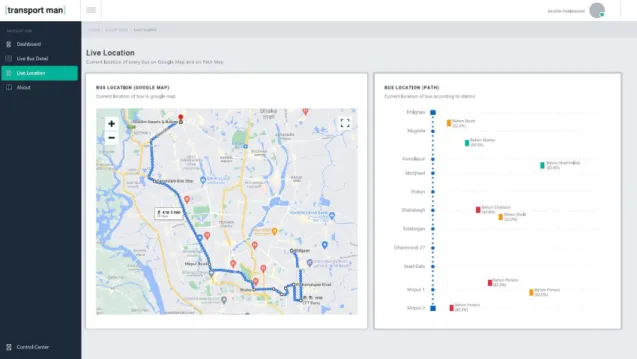
Figure 4.4: Live bus location and information page.
Figure 4.4: show the live bus location page. Its fetchers view and information of all current locations of all busses in Google map and their small info. There is also a section beside which is the path indicator for every bus. It shows all possible route in a point-to-point view and bus names and their current stoppage.
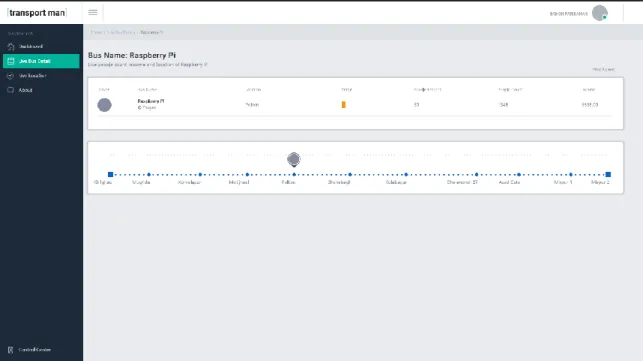
©Daffodil International University 15 Figure 4.5: Individual bus detail information page/directory
Figure 4.5: show the page directory of individual bus detail. By clicking any of the rows from the bus detail list will take to this page which will show more details about that bus like the whole row of information and also current location in route map with indicator.
Figure 4.6: Income summary detail in dashboard
Figure 4.6: show the summary and details of income which is on the top of the dashboard.
It contains respectively current day’s total income, previous day’s total income, current day’s total people count (which is total number of people journeyed in all buses that day) and net income (which is total sum of income from the first day to current day). There are also feathers to see the percentage of increase and decrease of income and people count per hour in these info boxes.
©Daffodil International University 16
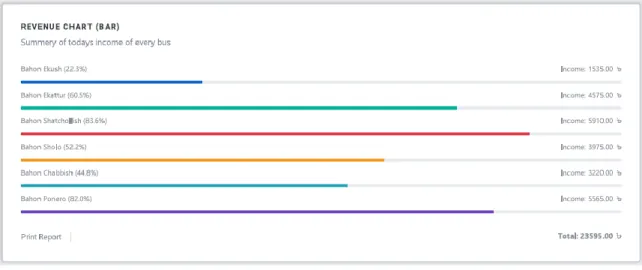
Figure 4.7: Income/Revenue chart(bar) in dashboard
Figure 4.7: show the income chart which is a bar chart. It contains a bar chart according to the information of all individual buses and their income. It also contains every bus income percentage and also total income. Individual buses can be recognized by their names and colors in the bar. For example, “Bahon Ekush” is a bus name and its color code is Blue.
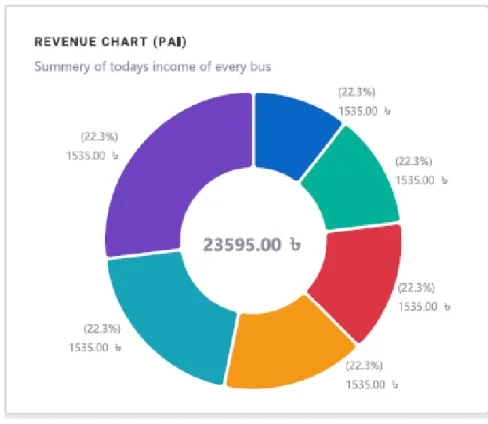
Figure 4.8: Income/Revenue chart(pie) in dashboard
©Daffodil International University 17 Figure 4.8: show the income chart which is a pie chart. It contains a pie chart according to the information of all individual buses, their income and income percentage. Individual bus can be recognized by their names and colors in the bar. For example, “Bahon Ekush” is a bus name and its color code is Blue.
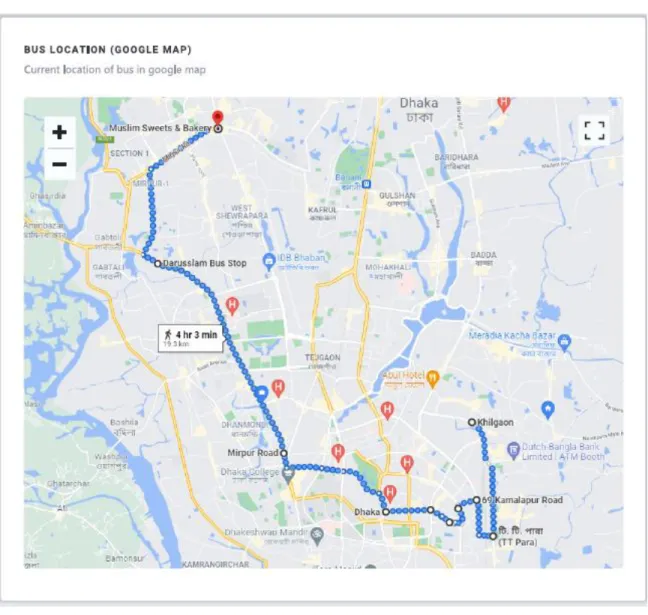
Figure 4.9: Bus location with indicator in Google map
Figure 4.9: show the Google map in which the whole bus route can be seen. There is a current location marked for every bus and their distances in the map. Users can also access any bus information by clicking any bus indicator in the map.
©Daffodil International University 18 Figure 4.10: Bus location(path) with indicator and information.
Figure 4.10: show the route detail and path of all individual buses. Buses can be recognized by names and colors. It shows the current position in the route and their names and color indicators. Also showing income percentage for extra fetchers.
We also have future plans to include this service in the Android platform too. We made a model and a prototype to build an Android Application.
The prototype and the model plan of this Android Application is given below-
©Daffodil International University 19
Figure 4.11: Android app home page
Figure 4.11 shows the home screen of the Transport Management System android app. It has everything like all the information, statistics and graphical representation. We tried to make it as user friendly and attractive as possible.
©Daffodil International University 20
Figure 4.12: Android application setting and control page
©Daffodil International University 21 Figure 4.12 shows the control page of the app. Companies can set and modify all the information and settings with these options. For example, Company name, bus counts, numbers, routes, locations, stops can be edited and changed by control page.
Figure 4.13: Graphical repetition of bar chart of different transports of the app
Figure 4.14: Graphical repetition of pie chart of different transports of the app
©Daffodil International University 22 Figure 4.15: Graphical representation of different locations of buses
Figure 4.16: Locations of transports shown in Google map
©Daffodil International University 23
4.2 Back-end Design
Transport Management System is a dynamic web application which functions work by using the internet combined with IOT. We are developing a web application; we must apply some backend operations. The database is the major of them because of all the work implemented based on the database. Here we use a MySQL database.
And for the IOT part we had to set up a camera and Raspberry pi 4 to track objects (passengers) and send information and count of people. We also need to execute some codes to make this running.
Figure 4.17: Footage of camera object tracking process
Figure 4.17: show the footage of the camera object tracking process. It will automatically track objects like people by movements and send information to the system attached to the camera.
©Daffodil International University 24 Figure 4.18: Output result
Figure 4.18: shows the codes and output result.
Figure 4.19: Raspberry pi OS home screen.
Figure 4.19: shows the home screen of raspberry pi OS setup. By this system information will be sent. There is also a smart camera attached to this system for sending people count information. This is the IoT part of our project.
©Daffodil International University 25
Figure 4.20: Raspberry pi 4 model B2
Figure 4.21: Raspberry pi Noir camera v2
©Daffodil International University 26
4.3 Interaction Design and User Experience (UX)
Interaction design adjusts on how the system and users work and behave in relation to each other. Interaction Design Able to design interactions between users and media. This is called 'interaction' because you are 'interacting' with the device. Interaction design focuses on how the system and users act and behaves in relation to each other. The objective of interaction design is to make items that empower the clients to accomplish their goals in the most ideal manner conceivable. In my application, I used the useful model of Interactive design.
According to Peter Morville, attached in Figure [2] shows 7 factors that define client experience.
Figure 4.22: 7 Factor that Influence User Experience [2]
4.4 Implementation Requirements
To implement the project, we needed a lot requirements which are given below:
1. Raspberry pi 4
2. Linux based operating system 3. Python Coding
4. Open CV 5. NumPy 6. MySQL
7. XAMPP Server 8. HTML5
9. PHP 10. Composer
11. Editor: Vs Code or sublime text 12. Android Studio
13. Microsoft Visual Studio
©Daffodil International University 27
CHAPTER 5
IMPLEMENTATION AND TESTING
5.1 Implementation of Database
The main focus is to create a database and tables to load the data. Here, DBMS (MySQL) was used to create this application. We update some data using queries initially We also made some queries to load the data from the database.
5.2 Implementation of Front-end Design
The website’s front end is everything we look for and can interact with using a browser.
So, building this visual portion is called front-end development. For design purposes front- end design of the system used HTML5, CSS3, JavaScript, jQuery, Bootstrap, PHP and Composer. The challenge was to manage design compatibility for all devices and also the challenge was more when we just implemented the and there the perfection was the matter for me.
5.3 Testing Implementation
Implementing interactions is the most crucial part of a project web development project.
The interaction indicates that when we are in one function and go to another function that we need. We separate the function for the user variant. We design each user part so elegantly that the user has what they need here. We design with great care that the design is engaging to the users. An application benefited where the user is satisfied accepting the application. The satisfaction level of our system is great.
5.4 Test Results and Reports
The system is tested basically for the correctness of an application. Testing is an integral part of an application. When a system is implemented and certain functions are tested it is called experimental implementation. I have tested our system several times. Login, Camera settings, Raspberry pi setup, codes, web page, database, calculations etc.
We have tasted these following factors:
1. Login System 2. Camera Settings
©Daffodil International University 28 3. Raspberry pi 4 set up
4. Operating Systems 5. Codes
6. Web page 7. Database 8. Server
9. Visual Representations 10. Statistics & Calculations
©Daffodil International University 29
CHAPTER 6
IMPACT TO SOCIETY, ENVIRONMENT AND SUSTAINAIBILITY 6.1 Impact on Society
This project will play a big role in society. Our transportation system, especially in local areas are very poor and not organized. With this project transportation and travelling of our local areas will heavily improve and life will be easy for the society and the people. The whole transportation will be in an organized system. Both business owners and people will be benefited.
6.2 Impact on Environment
This project is totally environment and eco-friendly. No animals, plants, environments were harmed making this project. No pollution will occur for this project. It will be totally online and environmentally friendly.
6.3 Ethical Aspects
Ethics play a huge role in this project. We all know there are a lot of corruption in the transport field in our country. As it is not organized, corruption happen and all the middlemen take the benefit. It harms both business and general people who pay for their travels. But by applying our project all the corruption can be stopped. Because the whole management system will be organized and online based. All the data and information will be stored, visible and safe.
6.4 Sustainability Plan
We are working on different fields and giving all priorities to sustain the project. We are working on multiple platforms to manage and sustain this project. There are all the platforms we are working to sustain the project given below.
• IOT
• Web Development
• Object Tracking
• Python
• Android Development
• Microprocessor Basis
• Camera Procedure
• Photo & Pixel Analysis
©Daffodil International University 30
CHAPTER 7
CONCLUSION AND FUTURE SCOPE 7.1 Discussion and Conclusion
This project will play a huge part in our transport field. All the corruption can be stopped by applying this project. The transport field of our country will be online based and totally organized. It provides a user-friendly interface that helps reach a wider audience. This project has completed all the requirements initially set at the requirements. It will Digitalize the transport system to help make our country “Digital Bangladesh”.
7.2 Scope for Further Developments
As it is a unique and big project, many further developments can be made for this project.
Some of them are given below.
• Multiple companies and owners can take these services.
• Automatic time schedule and route scheduling can be added in this project.
• It can be more user friendly.
• Data management can be improved.
• Current location for all the vehicles in Google Map can be added.
• Statistics and visual reorientation can be improved.
• Security system can be improved.
• We have plans to include this project in both web and android if we get enough time and funding.
©Daffodil International University 31
REFERENCES
[1] Engr. A. S. M. Faruque Hossain, “The Problems of Public Transport System in Dhaka City” Vol. 18, No.
1, page 1, November 2018.
[2] “UI/UX design the 7 factors” Available at:
https://www.openpr.com/news/1962052/user-experience-ux-market-forecast-2020-2025-new
©Daffodil International University 32
©Daffodil International University 33