Identification and functional study of potential receptors involved in vitelgenesis of female banana shrimp Fenneropenaeus merguiensis. II Title of thesis Identification and functional study of potential receptors involved in vitelgenesis of female banana shrimp Fenneropenaeus merguiensis. The Graduate School, Prince of Songkla University has approved this thesis in partial fulfillment of the requirements for the Master of Science Degree in Molecular Biology and Bioinformatics.
I would also like to express my sincere thanks to the Center for Genomics and Bioinformatics Research, Division of Biological Science, Faculty of Science, Prince of Songkla University for providing the necessary facilities for the research.
X CONTENTS (cont.)
Page
XI CONTENTS (cont.)
RESULTS
XIII
LIST OF ABBREVIATIONS
XVII LIST OF ABBREVIATIONS (cont.)
XVIII LIST OF ABBREVIATIONS (cont.)
XIX LIST OF ABBREVIATIONS (cont.)
XX LIST OF ABBREVIATIONS (cont.)
XXI LIST OF ABBREVIATIONS (cont.)
1 CHAPTER 1
INTRODUCTION
Background and Rationale
Transforming growth factor-β (TGF-β) receptor type 1 (TβR1) plays roles in early embryonic development and TβR1-mediated signaling in morphogenesis and metamorphosis found in Crassostrea gigas (Herpin et al., 2004) as well as in Scylla paramamosain (Zhou et al., 2018). Epidermal growth factor receptor (EGFR) is important for the correct development of embryonic and adult limbs, gonads and eyes, and body size in Macrobrachium rosenbergii (Sharabi et al., 2013). Although some receptors have been studied in crustaceans, gonadal regulatory receptors have not been studied so far.
Putative receptors that regulate gonads have been characterized in terms of their expression, and the bone morphogenetic protein receptor, a candidate receptor, has been studied for its role in the control of vitellogenesis using RNA interference.
Literature Review
- Fenneropenaeus merguiensis
- Ovarian maturation
- Receptors
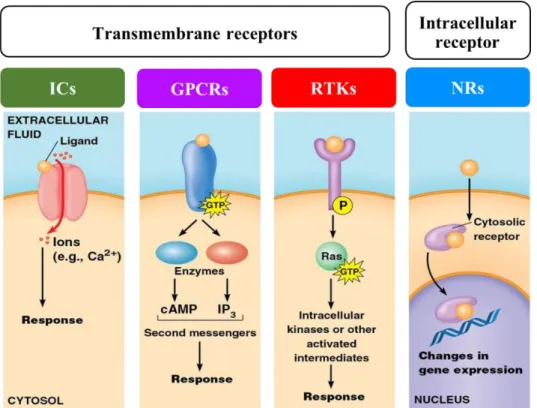
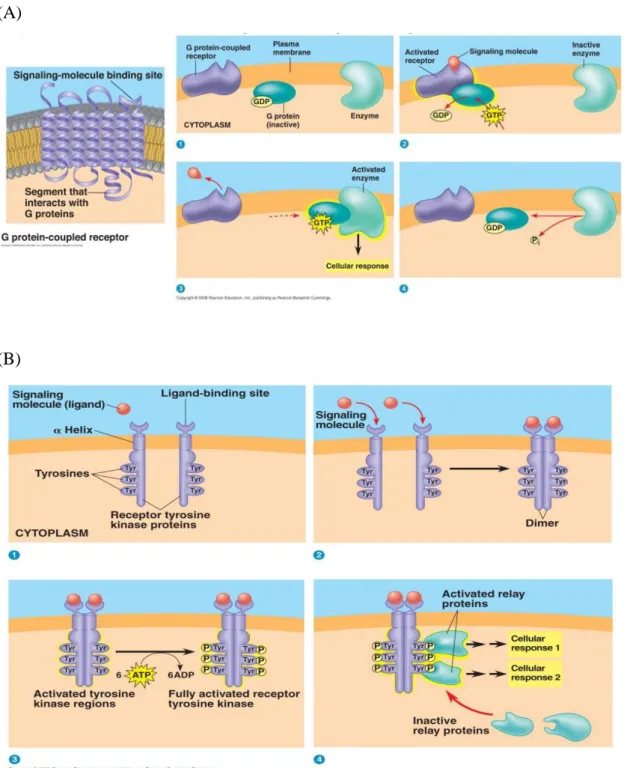
- G protein-coupled receptors
- Receptor tyrosine kinase
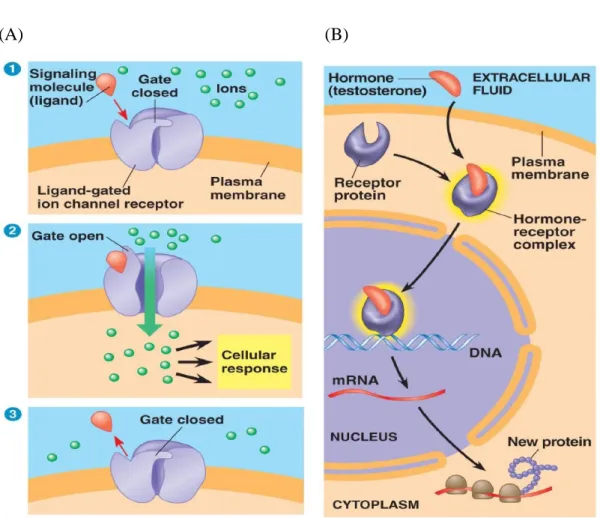
- Ion channel
- Nuclear receptor
- Transcriptome
- RNA interference
- EdU assay
The accumulation of the carotenoid components in the ovary leads to a change in the color of the ovary (Arculeo et al., 1995). Cellular activities in the previtellogenetic stage are involved in oocyte growth and proliferation (Ayub et al., 2002). For example, the retinoid X receptor can regulate vitellogenin expression and ovarian development in the mud crab (Gong et al., 2016).
The luteinizing hormone receptor (LHR) is essential for the regulation of gonadal maturation in the Chinese mitten crab (Nguyen et al., 2018).
Objectives
19 CHAPTER 2
MATERIALS AND METHODS
Materials
- Animal samples
- Bacterial samples
- Escherichia coli TOP10
- Escherichia coli HT115
- Plasmid vectors .1 pTG19-T vector
- pET28a vector
- Culture medium
- LB (Luria-Bertani) medium 100 ml
- Chemical reagents
- RNA extraction reagents
- cDNA synthesis reagents (Thermo Scientific)
- PCR reagents (Thermo Scientific)
- Realtime PCR reagents (KAPA Biosystems)
- Ligation reagents (Vivantis)
- FavorPrep Gel/PCR purification kit (Favorgen)
- GF-1 plasmid DNA extraction kit (Vivantis)
- RNase digestion reagents
- Digestion reagent
- Other reagents
In this study, the pET28a vector was used to clone and express the target products. The volume of the solution was brought up to 100 ml with DI water and sterilized by autoclaving at 121 °C for 15 min.
Methods
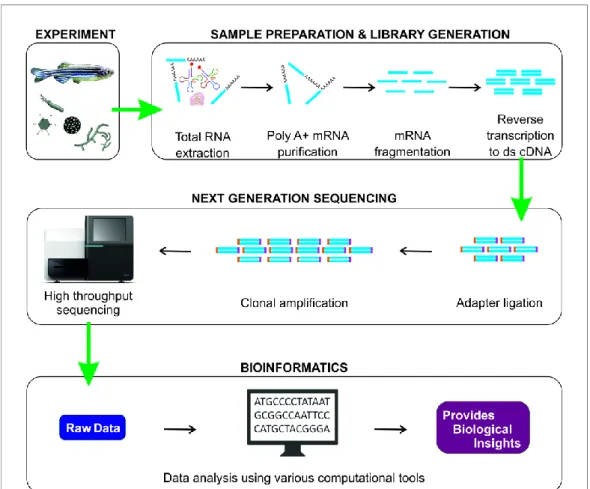
- Sample preparation and RNA sequencing (RNA-seq)
- De novo transcriptome assembly
- Gene functional annotation
- Differentially expressed gene (DEG) analysis
- Identification of candidate receptor genes involved in ovarian maturation To find out the candidate receptor, the unigenes derived from the
- RNA extraction
- Total RNA extraction
- Measurement of DNA/RNA concentration by spectrophotometer
- Determination of DNA/RNA by agarose gel electrophoresis
- The first stranded complementary DNA synthesis
- Experimental samples
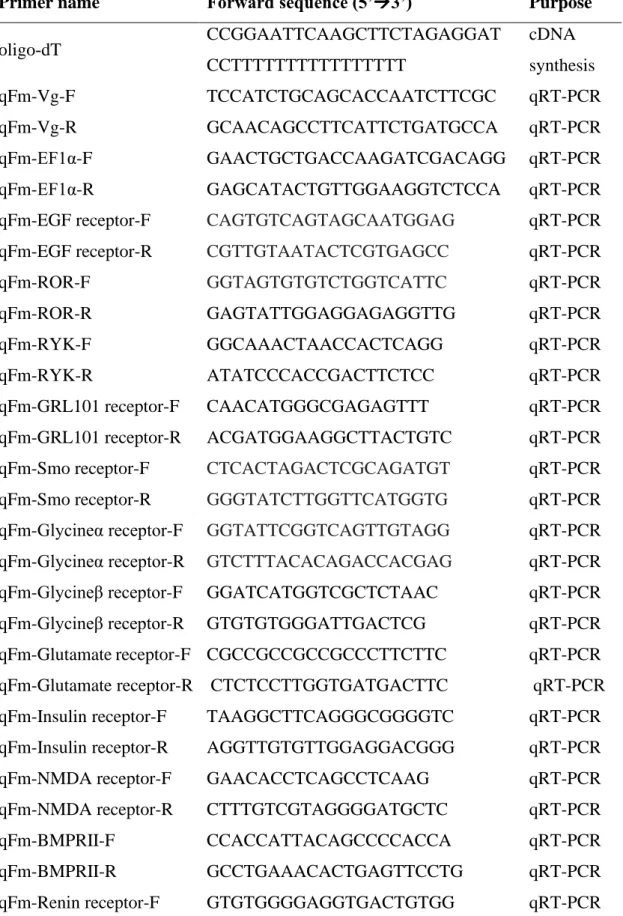
- Designation of gene-specific primers for qRT-PCR
- Examination of specificity and efficiency of the specific primer .1 Polymerase chain reaction
- Determination of primer efficiency by qPCR
- The qRT-PCR reaction and relative quantification of gene expression In the realtime PCR reaction, the 2 μl of 1: 10 diluted cDNA was added
- Construction of recombinant plasmid containing an inverted repeat sequence of saxophone
- Amplification and purification of PCR product
- Cloning of the inverted repeat sequence of FmSax in an expression vector To construct a recombinant plasmid carrying the inverted repeat
- Restriction enzyme digestion
- DNA ligation
- Competent cell preparation
- Plasmid transformation
- Plasmid extraction
- Production of receptor-specific dsRNA in bacteria .1 Induction of dsRNA expression in bacteria
- Extraction of receptor-specific dsRNA
- Determination of dsRNA by RNase digestion
- Effect of the FmSax knockdown on gene expression in shrimp
- Effect of the FmSax knockdown on oocyte proliferation
- Statistical analysis
The concentration of agarose in a gel depended on the sizes of the DNA fragments to be separated. 8 Determination of the candidate receptor gene expression in shrimp by quantitative real-time PCR (qRT-PCR). The PCR product that represented a single peak of the melting curve was further used to analyze for relative expression.
After purification of the digested recombinant plasmid (as described in 2.9.1), ligation of the stem-loop fragment and the stem-inserted pET28a was performed as described in 2.9.2.2. Before use in the experiments, the concentration of the extracted dsRNA was evaluated by comparing the integrity of the dsRNA and DNA tag by agarose gel electrophoresis as described in 2.6.3. After determining the FmSax knockdown by the dsRNA injection, the effect of FmSax silencing on vitellogenesis was investigated by determining vitellogenin (Vg) and FmBMPRII expressions and oocyte proliferation.
The ovaries and hepatopancreas derived from cDNA were used to determine for Vg expression by qRT-PCR as described in 2.8.4. The EDU index was calculated as a percentage of the number of EDU-positive cells to the total oocyte cells counted (n = 100–150).
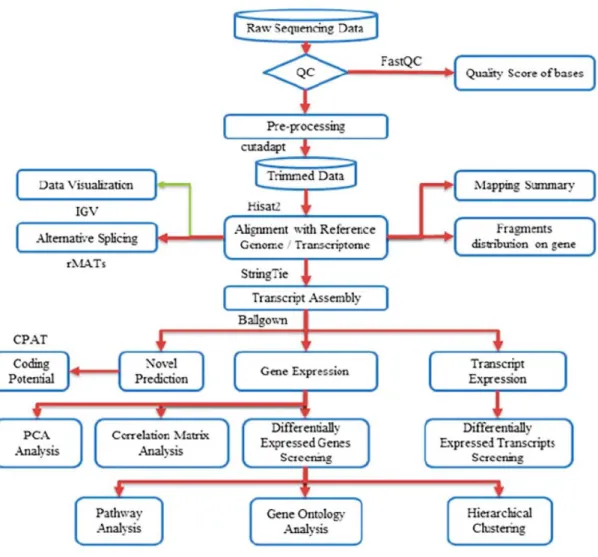
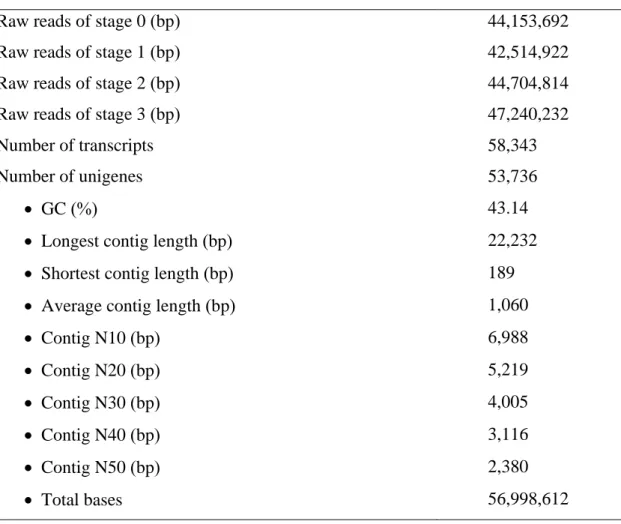
Transcriptome sequencing and analysis
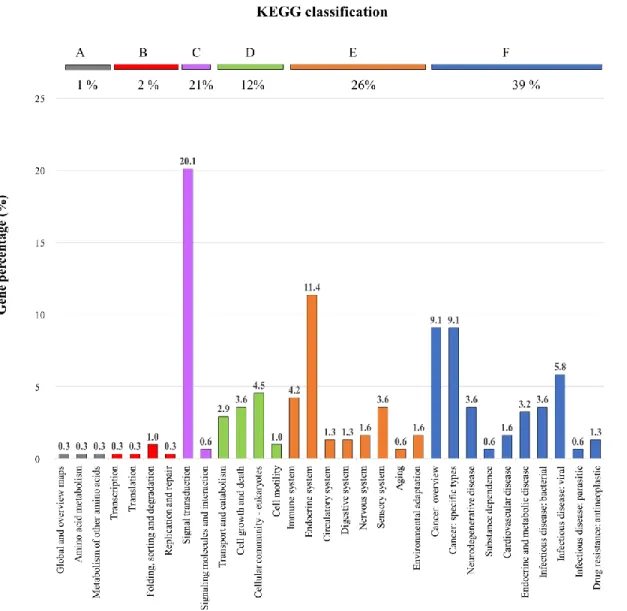
Functional annotation of receptor genes
Furthermore, the FPKM values derived from the DEG prediction of the receptor genes, was generated a heat map using BioVinci (Figure 14 5) and plotted mean-centered expression groups using the R package.
Identification of candidate receptor gene in F. merguiensis’s ovaries
Determination of the candidate receptor gene expression during ovarian developmental stages
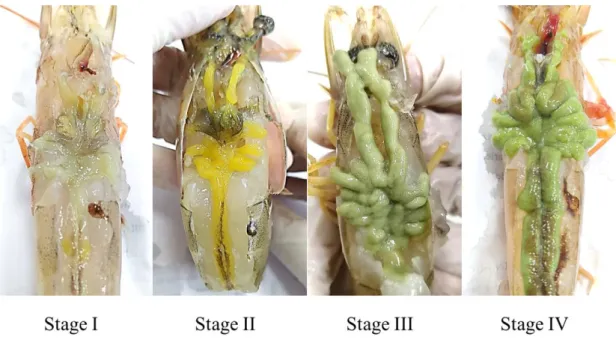
The rows represented the number of genes annotated in a pathway under the four major KEGG domains and the ratio of the number in that pathway to the total number of annotated genes. Each gray line in the bar graph represented the relative expression value of a gene group under ovarian developmental stages, and the blue line represented the mean value (B). Shrimp ovaries corresponding to 4 stages of ovarian development, including previtellogenic (st0), early vitellogenic (st1), late vitellogenic. st2) and mature stages (st3) were determined for gene expression.
The bars and lines indicate relative expression derived from qRT-PCR and in silico analysis, respectively. The expression of glutamate receptor, insulin receptor and glycine-α receptor was low in the previtellogenous stage. Thereafter, expressions were significantly increased in the early vitelgene stage and decreased in the adult stage (Figure 16 B-D).
Then, their expressions increased rapidly in both the early vitellogenic and late vitellogenic stages before suddenly dropping in the next stage (Figure 16 E–G). The expressions of BMPRII, notch receptor, glycine receptor-β and Smo receptor, were low in both previtellogenic and early vitellogenic stages. Then they gradually increased until they reached a significant peak in the late vitellogenic stage, and soon declined in the mature stage (Figure 16 H-K).
Expressions of sax, ROR, TGF-β1 receptor and GRL101 were low in the pre-tellogenic phase. They then fluctuated slightly in the later stages and suddenly increased in the mature stage (Figure 16 L-O).
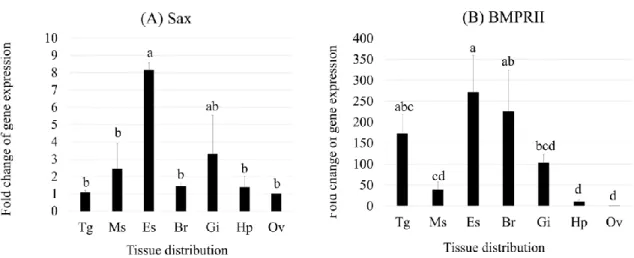
Expression analysis of FmSax and FmBMPRII in shrimp tissues and hepatopancreas during ovarian development
The expression of FmSax and FmBMPRII was determined in shrimp tissues, including eyestalks, brain, thoracic ganglia, gills, hepatopancreas, muscle, and ovary, by qRT-PCR. The results showed that FmSax expression was mostly found in eyestalks and gills and less in other tissues (Figure 17 A). FmBMPRII was also highly expressed in eyestalks and brain, and less so in thoracic ganglia and gills, while a very low level of expression was found in muscle, hepatopancreas, and ovary (Figure 17 B).
Furthermore, the expression of FmSax and FmBMPRII in the hepatopancreas during the ovarian developmental stages was determined. The result revealed that FmSax expression was ultimately increased during the ovarian developmental stages and had the highest level in the adult stage, while FmBMPRII expression was significantly increased in the late vitelogen stage before being knocked down in the adult stage (Figure 18 A and B).
Sequence characteristics and phylogenetic analysis of bone morphogenetic protein receptors
Alphabets indicate significant differences between groups (p < 0.05) analyzed by one-way ANOVA, followed by pairwise comparison by Scheffe's test. Both FmSax (A) and FmBMPRII (B) expressions were determined in hepatopancreas isolated from female shrimp corresponding to different ovarian developmental stages (previtellogenic (st0), early vitellogenic (st1), late vitellogenic (st2) and mature stages (st3)) by qRT-PCR. Alphabets indicated significant differences between groups analyzed by one-way ANOVA (p < 0. 05), followed by pairwise comparison by Scheffe's test.
Alignment of FmSax and FmBMPRII nucleotide sequences showed primer regions for dsRNA specific for FmSax (dsSax) but not for the FmBMPRII sequence (A). BMPRI from other organisms while FmBMPRII was similar to BMPRII from other organisms (Figure 20).
Production of the saxophone specific double-stranded RNA
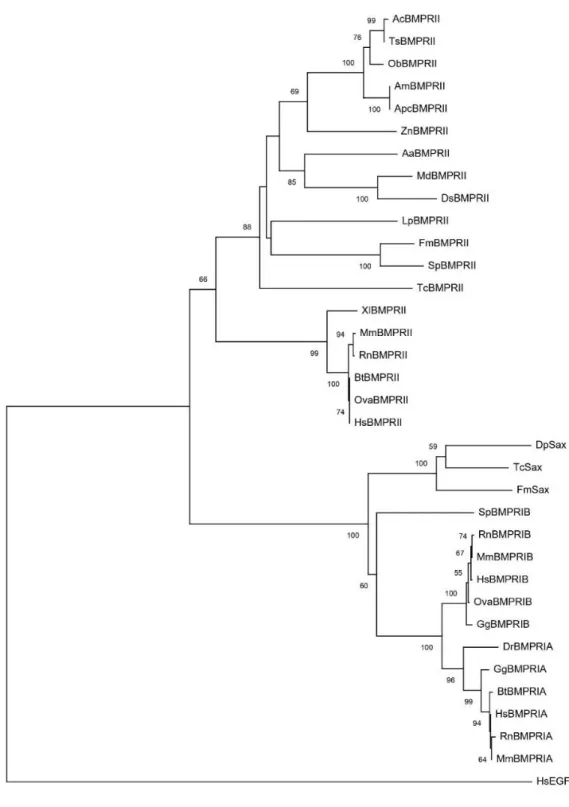
The tree of FmSax and FmBMPRII amino acid sequences and other organisms BMPRI and BMPRII. The evolutionary distances were calculated using the Poisson correction method and were in the units of the number of amino acid substitutions per site. The ovary (A) and hepatopancreas (B) were determined for FmSax, Vg and FmBMPRII expressions by qRT-PCR.
Asterisks indicate significant differences between groups (p < 0. 05) analyzed by one-way ANOVA using randomized complete block design followed by pairwise comparison by Scheffe's method. At days 7 post-injection, ovarian sections were isolated and cultured in culture medium, then incubated with EdU overnight.
60 CHAPTER 4
DISCUSSION
In addition, Nishizono et al., (2020) reported that the defect of the glycine receptor alpha-4 subunit (Glra4) affected the inhibition of embryonic development to the blastocyst stage in fertilized mouse eggs through a decrease in the number of cells in the blastocysts. Suggests the regulatory role of the glycine receptors in preimplantation development (Nishizono et al., 2020). For example, the glutamate receptor AMPA-1 (GRIA1) mutants led to the decline of immature ovarian follicles before undergoing ovulation and delayed the release of luteinizing hormone (LH) in Bos taurus (Sugimoto et al., 2010).
The NMDA receptor is another subtype of glutamate receptors that is widely distributed in the CNS (McBain and Mayer, 1994; Huang et al., 2015). The mutant of notch receptor results in the tumorigenic mechanisms (Stransky et al., 2011; Agrawal et al., 2011). Insulin signaling was involved in the regulation of neuronal growth and differentiation (Heidenreich, 1993; Robinson et al., 1994).
An insulin receptor knockout in mice affected the growth regulation of embryonic β cells ( Kitamura et al., 2001 ). A mutant insulin receptor in Drosophila was implicated in the regulation of growth and body size during development (Chen, Jack, and Garofalo, 1996) and caused severe growth retardation (Brogiolo et al., 2001). Likewise, TGF-β 1 receptor expression is highly expressed in early follicle development in the collared peccary (Pecari tajacu) (Viana et al., 2020).
The knockout of TGFBR1 led to the defect of structure and function in the oviduct and uterus in mice (Li et al., 2011). Also, silencing BMPRIB by siRNA inhibited porcine granulosa cell proliferation (Zhao et al., 2014).
68 CHAPTER 5
CONCLUSION
69 REFERENCES
An evolutionarily conserved function of the Drosophila insulin receptor and insulin-like peptides in growth control. Maturation and spawning of the banana shrimp Penaeus merguiesis De Man (Crustacea, Penaeidae) in the Gulf of Carpentaria, Australia. Effects of the NMDA receptor antagonist MK-801 on female reproduction and juvenile hormone biosynthesis in the cricket Gryllus bimaculatus and the butterfly Bicyclus anynana.
Expression and ecdysteroid responsiveness of the nuclear receptors HR3 and E75 in the crustacean Daphnia magna. De-novo transcriptome analysis of the banana shrimp (Fenneropenaeus merguiensis) and identification of genes associated with reproduction and development. Molecular characterization of hepatopancreas vitellogenin and its expression during ovarian development by in situ hybridization in the banana shrimp Fenneropenaeus Merguiensis.
Expression of Notch receptors, ligands and target genes during development of the mouse mammary gland. A review of the life history of the banana shrimp, Penaeus merguiensis, in the Gulf of Carpentaria. Review of the life history of the banana shrimp, Penaeus merguiensis, in the Gulf of Carpentaria.
Bone morphogenetic protein ligand and receptors in mud crab: potential role in ovarian development. The Notch receptor and its ligands are selectively expressed during hematopoietic development in mice.
90 APPENDIX A
Receptor keywords used to identify putative receptors
- Receptor keywords for G protein-coupled receptor type (the IUPHAR/BPS Guide to pharmacology, 2019)
- Receptor keywords for receptor-tyrosine kinase type (Ségaliny, Aude I., et al., 2015)
- Receptor keywords for nuclear receptor type (the IUPHAR/BPS Guide to pharmacology, 2019)
The efficiency of candidate receptor specific primers
Each gray line in a subline plot represented the relative expression value of a set of genes under ovarian developmental stages, and the blue line represented the mean value. Each gray line in a subline plot represented the relative expression value of a set of genes under ovarian developmental stages, and the blue line represented the mean value.
105 APPENDIX B
VITAE