Early Heart Attack Prediction Using Machine Learning Technique BY
MD Faizul Islam 161-15-7455
This Report Presented in Partial Fulfillment of the Requirements for the Degree of Bachelor of Science in Computer Science and Engineering
Supervised By
Dr. Syed Akhter Hossain Professor and Head Department of CSE
Faculty of Science & Information Technology Daffodil International University
DAFFODIL INTERNATIONAL UNIVERSITY DHAKA, BANGLADESH
JULY 2020
©Daffodil International University i
APPROVAL
This Project/internship titled “Early heart attack prediction using machine learning technique”, submitted by MD Faizul Islam, ID No: 161-15-7455 to the Department of Computer Science and Engineering, Daffodil International University has been accepted as satisfactory for the partial fulfillment of the requirements for the degree of B.Sc. in Computer Science and Engineering and approved as to its style and contents. The presentation has been held on 8th july 2020
BOARD OF EXAMINERS
Dr. Syed Akhter Hossain Chairman
Professor and Head
Department of Computer Science and Engineering Faculty of Science & Information Technology Daffodil International University
Dr. Fizar Ahmed Internal Examiner
Assistant Professor
Department of Computer Science and Engineering Faculty of Science & Information Technology Daffodil International University
Md. Tarek Habib Internal Examiner
Assistant Professor
Department of Computer Science and Engineering Faculty of Science & Information Technology Daffodil International University
Dr. Mohammad Shorif Uddin External Examiner
Professor
Department of Computer Science and Engineering Jahangirnagar University
©Daffodil International University ii
DECLARATION
We hereby declare that this research has been done by us under the supervision of Dr. Syed Akhter Hossain Professor and Head, Department of CSE, Daffodil International University. We also declare that neither this research nor any part of this research has been submitted elsewhere for the award of any degree or diploma.
Supervised by:
Dr. Syed Akhter Hossain Professor and Head
Department of CSE
Daffodil International University Submitted by:
MD Faizul Islam ID: -161-15-7455 Department of CSE
Daffodil International University
©Daffodil International University iii
ACKNOWLEDGEMENT
First we express our heartiest thanks and gratefulness to almighty God for His divine blessing makes us possible to complete the final year project/internship successfully.
We really grateful and wish our profound our indebtedness to Dr. Syed Akhter Hossain, Professor & Head, Department of CSE Daffodil International University, Dhaka. Deep Knowledge & keen interest of our supervisor in the field of “Business Intelligence” to carry out this project. His endless patience ,scholarly guidance ,continual encouragement ,constant and energetic supervision, constructive criticism , valuable advice ,reading many inferior draft and correcting them at all stage have made it possible to complete this project.
We would like to express our heartiest gratitude to Dr. Syed Akhter Hossain, Professor, and Head, Department of CSE, for his kind help to finish our project and also to other faculty member and the staff of CSE department of Daffodil International University.
We would like to thank our entire course mate in Daffodil International University, who took part in this discuss while completing the course work.
Finally, we must acknowledge with due respect the constant support and patients of our parents
©Daffodil International University iv
ABSTRACT
Heart attack is a disease which has become the leading cause of death worldwide.
Particularly in the South Asian countries have a tremendous risk of heart attack at an early age than any other ethnic group. Most often it’s challenging for medical practitioners to predict heart attack as it requires experience and knowledge which is a complex task to accomplish. This health industry has enormous amounts of data which is useful for making effective conclusions using their hidden information. Using appropriate results and making effective decisions on data, some superior data mining techniques are used such as Logistic Regression, Decision Tree, K-NN. By using some properties like (age, gender, bp, stress etc) we can be predicted the chances of heart attack.
©Daffodil International University v
TABLE OF CONTENT
Approval i Board of Examiners i Declaration ii
Acknowledgement iii
Abstract iv
Table of Content v
List of Figures vii
List of Tables viii
CHAPTER
CHAPTER 1: INTRODUCTION 1-4
1.1 Introduction 1-2
1.2 Motivation 2
1.3 Rationale of the Study 2-3
1.4 Research Questions 3
1.5 Expected Output 3
1.6 Report Layout 4
CHAPTER 2: BACKGROUND 5-11
2.1 Introduction 5-6
2.2 Cardiovascular Disease 6
2.2.1 Definition 6
2.2.2 Causes and Risk Factors 6-8
2.3 Related Works 8-9
2.4 Research Summary 9-10
2.5 Scope of the Problem 10
2.6 Challenges 10-11
©Daffodil International University vi
CHAPTER 3: RESEARCH METHODOLOGY 12-23
3.1 Introduction 12
3.2 Data Collection Procedure 13-14
3.3 Statistical Analysis 14-15
3.4 Research Subject and Instrumentation 16
3.4.1 Logistic Regression 16-17
3.4.2 Decision Tree (CART) 17-18
3.4.3 Support Vector Machine (SVM) 18-19
3.4.4 K-nearest neighbor (KNN) 19-20
3.5 Selection of Algorithm 21
3.6 Proposed Algorithm 22-23
CHAPTER 4: EXPERIMENTAL RESULTS AND DISCUSSION 24-27
4.1 Introduction 24
4.2 Experimental Results 24-27
4.3 Descriptive Analysis 27
CHAPTER 5: SUMMARY, CONCLUSION, RECOMMENDATION AND IMPLICATION FOR FUTURE RESEARCH 28-29
5.1 Summary of the Study 28
5.2 Conclusions 28
5.3 Future Work 28-29
References 30
©Daffodil International University vii
LIST OF FIGURES
FIGURES PAGE NO
Figure 2.1: Training Dataset Co-ordination 5
Figure 2.2.2: Plaque on blood vessel 8
Figure 3.1: Data Mining Process Model 12
Figure 3.2: Architecture of our proposed model 15
Figure 3.4.1: Data Visualization 16
Figure 3.4.2: Decision Tree Data procedure 18
Figure 3.5: Applied algorithms of our proposed method
Figure 4.1: Accuracy curve
21 27
©Daffodil International University viii
LIST OF TABLES
TABLES PAGE NO
Table 3.1: Dataset details 13
Table3.2: Dataset of feature range 14
Table 4.1: Confusion matrix 26
Table 4.2: Measure accuracy 26
©Daffodil International University 1
CHAPTER 1 INTRODUCTION
1.1 Introduction
A heart attack is the death of a segment of heart muscle caused by a loss of blood supply.
The blood is usually cut off when an artery supplying the heart muscle is blocked by a blood clot. Usually, the heart muscle does not get the necessary amount of oxygen due to a blood clot that blocks the artery supply. The three types of heart attacks are (a) ST segment elevation myocardial infarction (STEMI) (b) non-ST segment elevation myocardial infarction (NSTEMI) (c) Coronary spasm or unstable angina.
Cardiovascular disease is the number one cause of death globally; more people die annually from cardiovascular diseases than from any other cause. It accounts for nearly one in every three deaths worldwide annually. Accounting for 15.5% of all deaths worldwide cardiovascular disease is the world's leading cause of death.
At present growing concern for Bangladesh is a cardiovascular disease with patients suffering it topping the list of people with non-communicable diseases. According to the National Health Bulletin, the top cause of hospital admission, morbidity, and mortality in the country is also cardiovascular disease. “Cardiovascular disease became the leading cause of death among the non-communicable diseases in Bangladesh,” said the World Health Organization in its latest Non-Communicable Diseases Country Profiles 2018.
According to (WHO) [7], deaths caused by cardiovascular disease increased manifold in Bangladesh over recent years. Cardiovascular identification could be a sophisticated and necessary task that must be dead accurately and expeditiously.
Supported a doctor’s expertise & information the identification is usually created.
This results in unwanted results & excessive medical prices of treatments provided to patients. Therefore, a computerized medical diagnosis system would be extremely
©Daffodil International University 2 propitious.
But using the data mining technique we can explore the hidden patterns in the medical domain. These patterns can be utilized for clinical diagnosis. An online- based prediction system can make these diagnoses easy and affordable especially for the financially insecure people.
This paper intends to research the various prognostic descriptive data processing techniques introduced in recent years to predict the possibilities of upset.
1.2 Motivation
In case of Heart attack, when heart attack occur, sometimes can’t understand which heart attack is occurred. Is this heart attack or other diseases? For this reasons people have to go to hospital and do many testing for this disease which is very time consuming and wasting money. In this situation patient cannot get proper treatment in early which is bad for this patient’s condition. Many of the time doctor almost done getting result but sometimes result become wrong for doing early. That’s why many patients do not get right treatment and can’t understand which will be the next treatment. So many people suffer more and more. Our system helps to give a good result for this situation and get early result that heart attack has or not.
1.3 The rationale of the study
Presently a-days, Heart attack is considered as one of the most serious diseases. It considered as a most alluring sickness for getting to be identified with the heart. In the wake of seeking and breaking down we picked heart attack as our exploration point. For turning into an expansive number of dead on the heart attack, the exploration subject has been chosen. At long last, the paper has been chipping away at this to give a superior proposal that encourages us to diminish the dead number for our advanced age people groups.
©Daffodil International University 3 The purpose of data mining is to find effect full data from large databases. The purpose of data mining is to find effect full data from big databases. Data mining technique are used for profitable and experimental sector. It is a procedure of determining, research and design big number of data in order to identify anonymous patterns or links which add a clear and appropriate conclusion to the data examiner. Data determining, data purification, data conversion, pattern seeking.
1.4 Research questions
a) Does it show the accurate value to predict heart attack in early prediction?
b) Does it classify heart attack diseases by machine learning algorithm?
Already, several harmful diseases have been detected for a human being. Although each disease has a solution for prevention it’s not possible for everyone due to only for unconsciousness. Everyone wants to lead a happy life in where a disease is the only obstacle. Any kind of disease prevention is possible if that in remain primary stage. For that reason, we built a prediction system that helps to identify the disease stage and provides us the result that he or she has heart attack or not. All of the diseases, heart attack disease is considered one of the leading diseases. Many peoples are died due to this disease. Heart attack disease is the biggest killer of both men and women in the world. In our Bangladesh there are no well-known system for heart attack. Finally, we selected it as our research topic in Bangladesh people for our pleasure and also try to make a good system for prediction heart attack diseases.
1.5 Expected Output
In our heart attack prediction is a system that helps to generate an expected result based on the given dataset. In this system, we used 70% of the training to get more accurate predictions. How accurate is it, it depends entirely on the training dataset? After completing all the needed procedure of the proposed system, our system has been ready for preparing out on the given dataset. We have applied various strategies to achieve our desired results.
We got 97% accuracy from the K-Nearest Neighbors (KNN) among all that we have used.
©Daffodil International University 4 1.6 Layout of the Report
Chapter 1 have demonstrated an introduction to the project with its motivation, research questions and expected outcome.
Chapter 2 will have “Background” demonstrates introduction, related works, research summary and challenges.
Chapter 3 will have Research Methodology.
Chapter 4 will have Experimental Results and Discussion.
Chapter 5 will have Summary and Conclusion.
©Daffodil International University 5
CHAPTER 2 Background Study
2.1 Introduction
In this section, we will discuss related works, research summary and challenges about this research. In related works section, we will discuss other research paper and their works, their methods and accuracy which are related to our work. In research summary section we will give the summary of our related works. In challenges section, we will discuss how we increased the accuracy level.
2.2 Cardiovascular Disease
In this section, we will discuss some description of cardiovascular disease.
2.2.1 Definition
Cardiovascular disease generally refers to conditions that involve narrowed or blocked blood vessels that can lead to a heart attack, chest pain (angina) or stroke [29]. Other heart conditions, such as those that affect your heart's muscle, valves or rhythm, also are considered forms of heart disease [29].
2.2.2 Causes and Risk Factors
While the disease can confer with entirely completely different heart or vessel problems, the term is sometimes accustomed mean hurt to your heart or blood vessels by induration of the arteries, a buildup of fatty plaques in your tracks. Plaque increase thickens and stiffens artery walls, which could inhibit blood run through your arteries to your organs and tissues. Cardiovascular disease is to boot the foremost common reason for disorder. It's caused by correctable problems, like associate unhealthy diet, being overweight lack of exercise and smoking.
©Daffodil International University 6 There are various risk factors for the disorder. Some you will be ready to predict, others you can’t. Some preservation can control this disease if we take this early stage.
Ones that can’t be controlled include:
Gender (males square measure at larger risk)
Age
A family history
Being post-menopausal
Still, creating some changes in your modus vivendi will scale back your probability of getting cardiopathy. manageable risk factors include
Smoking
High LDL, or "bad" cholesterol, and low high-density lipoprotein, or
"good" cholesterol
Uncontrolled cardiovascular disease (high blood pressure)
Physical inactivity
Obesity
Uncontrolled polygenic disorder
Uncontrolled stress and anger
Uncontrolled stress and anger
The following figure 2.2.2 shows plaque on blood vessel
©Daffodil International University 7 Figure 2.2.2: Plaque on
blood vessel
2.2 Related Work
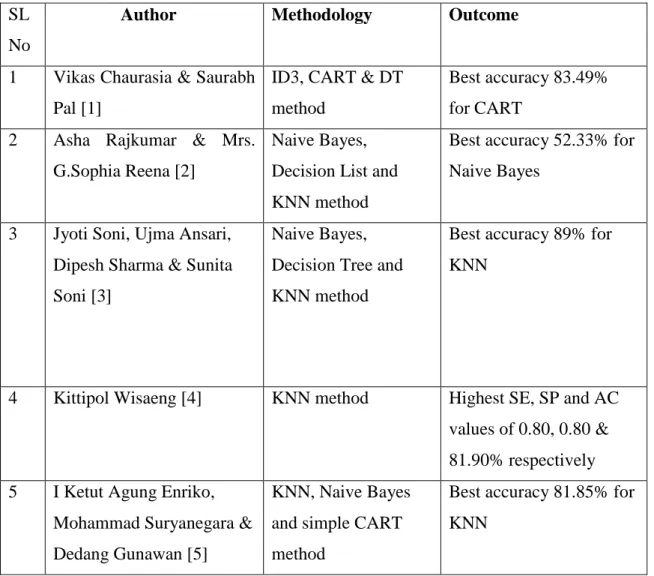
Vikas Chaurasia & Saurabh Pal used ID3, CART & DT algorithm for diagnosis of patient with heart disease. They got best accuracy for CART algorithm and the accuracy rate was 83.49% [1]. Asha Rajkumar & Mrs. G.Sophia Reena used Naive Bayes, Decision List, KNN algorithm for diagnosis of patient with heart disease and they got best accuracy rate for Naive Bayes algorithm which was 52.33% [2]. Jyoti Soni, Ujma Ansari, Dipesh Sharma & Sunita Soni proposed the use of Naive Bayes, Decision Tree and KNN algorithm for which they got the best accuracy rate for KNN of 89% [3]. Kittipol Wisaeng used only the KNN algorithm in his research and he achieved the highest SE, SP and AC
©Daffodil International University 8 values of 0.80, 0.80 & 81.90% respectively [4]. I Ketut Agung Enriko, Mohammad Suryanegara & Dedang Gunawan used KNN, Naive Bayes and simple CART algorithm in their research and they got best result for KNN with the accuracy rate of 81.85% [5].
2.3 Research Summary
In this table 2.1, we have shown the research paper summary in a simple tabular form.
Table 2.1: Research paper summary SL
No
Author Methodology Outcome 1 Vikas Chaurasia & Saurabh
Pal [1]
ID3, CART & DT method
Best accuracy 83.49%
for CART 2 Asha Rajkumar & Mrs.
G.Sophia Reena [2]
Naive Bayes, Decision List and KNN method
Best accuracy 52.33% for Naive Bayes
3 Jyoti Soni, Ujma Ansari, Dipesh Sharma & Sunita Soni [3]
Naive Bayes, Decision Tree and KNN method
Best accuracy 89% for KNN
4 Kittipol Wisaeng [4] KNN method Highest SE, SP and AC values of 0.80, 0.80 &
81.90% respectively 5 I Ketut Agung Enriko,
Mohammad Suryanegara &
Dedang Gunawan [5]
KNN, Naive Bayes and simple CART method
Best accuracy 81.85% for KNN
Heart attack is a disease that attacks the heart. Without a doubt, the heart is a very important part of every human being. Therefore, if we want to lead a healthy life, we have to be cautious. If we can predict this disease at an early stage, we can easily prevent it. Otherwise
©Daffodil International University 9 we must suffer for this disease for our future life. After making the decision based on the current situation, we wanted to establish a system that provides better performance due to disease and understand the situation of affected patients. Finally, we touch our expected goal for God's blessing, which we have thought to implement.
2.4 Scope of the problem
In our research we used many algorithms. But when searching for a better accuracy rate we faced many problems with algorithms. When we were trying to find best accuracy this time few algorithm provide good accuracy but they had some drawbacks and they are time consuming. So we were trying to find out which one give best result in short time. None of the renowned algorithm gave us the actual result we were hoping for. So we find out a good algorithm that matches our expectations and also time efficient.
Some of the example of problems while searching for a best algorithm,
Some algorithm was showing same accuracy although we are inputting different types of data
Having problem with data implementation some of the algorithm etc.
2.5 Challenges
Data collection is one of the big challenges for getting predicting accuracy. Without data, the prediction is not possible and it can’t predict. After that, another challenge is preprocessing. After doing preprocessing our data set has no null value and helps us to get a good prediction. Next, Feature scaling helps to take all feature values into the same scale with respect to value. Therefore, different algorithm has been applied to the proposed architecture. Finally, the implementation process has been established to get accurate predicted value. There were several challenges rising according to the working procedure.
We tried to increase and got a better result for this model by using machine learning algorithm of K-Nearest Neighbors.
©Daffodil International University 10 Here are few more challenges for us,
Choosing the perfect algorithm
Finding study shareholder
Dealing with the data
Input data in excel file
Implementation the dataset on algorithms
©Daffodil International University 11
CHAPTER 3
RESEARCH METHODOLOGY
3.1 Introduction
In our system, we tried to collect data from different medical hospital in our country (Bangladesh). We also tried a unique way and made accurate prediction in our research.
We used 14 features and 100 data from Medical hospital’s patient dataset. After that, we got some missing value which we resolved. To get the proper prediction, we’ve already completed the feature scaling process. Datasets are used for training and testing purposes and here are some of them included algorithm Logistic Regression (LR), Classification and Regression Trees (CART), k-Nearest Neighbor (KNN), support vector machines (SVM).
The appropriate algorithm scenario has been given based on the working procedure.
3.2 Data Collection Procedure
However, a few hospital-based heart attack studies have been carried out involving three hospitals: National Heart Foundation of Bangladesh, Ibrahim Cardiac Hospital & Saaol Heart Centre. The study was conducted about 100 heart attack patients and 100 normal patient data (have no heart attack) in National Heart Foundation of Bangladesh, Ibrahim Cardiac Hospital & Saaol Heart Centre between 2017 to 2018. We also tried to make our work a unique research. We also search many research paper and get many research paper in heart attack. But our work is for classification of heart attack in early prediction which is unique. In Bangladesh, nobody had done research for classification of heart attack.
That’s why we collected heart attack dataset and tried to make a good system for our people. Here are some details of dataset collection Table3.1-
©Daffodil International University 12 Table3.1: Dataset details
SL No Name of the Medical No. of data
1 National Heart Foundation of Bangladesh 120
2 Ibrahim Cardiac Hospital 50
3 Saaol Heart Centre 30
Dataset of features reference value are shown in table 3.2 – Table3.2: Dataset of feature range
Feature Reference value Feature Reference value
BP <120/80 ST depression 1.3-1.5
Cholesterol <200mg/dL Slope of ST
FBS <120 Number of vessels
fluro
ECG 120-200ms Thallium < .5
HR 170bpm AGE >40
Exercise Angina True GENDER Maximum male
Heart Disease Absence
In this dataset table 3.2, we try to show 13 dataset features reference value. In table 3.2, we want to show our dataset information where features are Blood Pressure(BP), Cholesterol, Fasting Blood Sugar(FBS), Electrocardiogram(ECG), Heart Rate(HR), Exercise Angina, Heart Disease, ST Depression, Slope of ST, Number of vessels Fluro, Thallium, Age, Gender.
©Daffodil International University 13 3.3 Statistical Analysis
In our system dataset, we have 100 datasets for heart attack patient and 100 datasets non- heart attack patient. Here, we selected 70% dataset to train and 30% dataset to test. In this system we try to find out accuracy from the dataset and use KNN method to predict heart attack diseases. In this figure 3.2 we are shown that dataset flowchart and how we use the dataset for proposed model.
Figure 3.2: Architecture of our proposed model.
Data Collection
Data Preprocessing and feature scaling
Select train and test dataset
CART
KNN SVM
LR
Result Analysis
©Daffodil International University 14 In this figure, we have shown that how we do our research in shortly details. In this figure 3.2 we can know how to go ahead for our target step by step.
3.4 Research Subject and Instrumentation
As of late, the fame of machine learning calculations is rising exponentially. Machine Learning Algorithms give PCs the capacity to gain from information with the assistance of measurable methodologies. A machine can discover the interior information example and deliver a choice or prescient learning as a result without the assistance of express coding is considered as the most premium part. In this way, a similar calculation can be connected to datasets of various areas without having a change of its interior structures. There are distinctive kinds of machine learning calculations, however we have utilized some of them to our framework. The algorithm details are given below:
3.4.1 Logistic Regression
Logistic Regression, falls under Supervised Machine Learning. It takes care of the issues of Classification (to settle on forecasts or take choices dependent on past information). It is utilized to anticipate twofold results for a given arrangement of free factors. The reliant variable's result is discrete. Logistic backslide is another system procured by machine picking up from the field of insights. It is the go-to technique for matched portrayal issues.
Calculated backslide uses a condition as the depiction, especially like straight backslide.
Information regards (x) are joined straightly using loads or coefficient regards (implied as the Greek capital letter Beta) to of section a yield regard (y). A key differentiates from direct backslide is that the yield regard being exhibited is a combined quality (0 or 1) rather than a numeric regard.
Coming up next is a model key backslide condition:y = e^ (b0 + b1*x) / (1 + e^ (b0 + b1*x))
………. (1)
©Daffodil International University 15 From equation 1, here y was the predict yield, b0 is the inclination or capture term and b1 was the coefficient for the single data esteem (x). Every segment in your information has a related b coefficient (a consistent genuine esteem) that must be gained from your preparation information.
3.4.2 Decision tree (CART)
Decision trees are a vital kind of calculation for prescient demonstrating machine learning.
The traditional decision tree calculations have been around for quite a long time and present-day varieties like arbitrary timberland are among the most ground-breaking procedures available. the humble decision tree calculation known by its more current name CART which represents Classification and Regression Trees. Decision tree technique is utilized as the most integral asset for taking in the machine since it gets compelling outcomes as quickly as time permits. Choice tree has diverse kinds of calculations: Cart, ID3, C 4.5, CHH and H48. Among them J48 is utilized and it is exceptionally mainstream algorithm. J48 utilizes pruning technique for building a tree. This calculation keeps on being a recursive procedure until the point that the normal outcomes are found. It gives great exactness and adaptability. This formula is made available from the following equations.
𝐸 = ∑𝐾𝑖=1𝑃𝑖𝑙𝑜𝑔2𝑃𝑖…………. (2)
From equation 2,
K defines the number of classes of target attributes, Pi defines the number of occurrences of class, i is divided by the total number of instances.
Generally, this count is implied as "decision trees", yet on a couple of stages like R they are suggested by the more present-day term CART.
©Daffodil International University 16 3.4.3 Support Vector Machine (SVM)
A Support Vector Machine (SVM) is a discriminative classifier officially described by a detaching hyperplane. Toward the day's end, given checked planning data (oversaw taking in), the computation yields a perfect hyperplane which organizes new points of reference. In two-dimensional space this hyperplane is a line apportioning a plane in two areas where in each class lay in either side the numeric data factors (x) in your data (the segments) shape a n-dimensional space. For example, in case you had two data factors, this would outline a two-dimensional space.
A hyperplane is a line that parts the information variable space. In SVM, a hyperplane is chosen to best separate the focuses in the info variable space by their class, either class 0 or class 1. In two-measurements you can envision this as a line and we should expect that the majority of our info focuses can be totally isolated by this line. For instance:
B0 + (B1 * X1) + (B2 * X2) = 0………. (3)
From equation 3, here the coefficients (B1 and B2) that decide the incline of the line and the capture (B0) are found by the learning calculation, and X1 and X2 are the two info factors.
3.4.4 K-nearest neighbor (KNN)
KNN falls in the oversaw adjusting gathering of computations. Casually, this implies we are given a marked dataset consisting of preparing perceptions (x, y) and might want to catch the connection among x and y. All the more formally, we will likely take in a capacity h:X→Y with the goal that given a concealed perception x, h(x) can unquestionably foresee the relating yield y. The KNN classifier is likewise a non-parametric and occasion-based learning calculation. Non-parametric means it makes no unequivocal presumptions about the utilitarian type of h, staying away from the risks of mismodeling the basic dispersion of the information. For instance, assume our information is exceptionally non-Gaussian however the learning model we pick accept a Gaussian shape. All things considered, our calculation would make to a great degree poor forecast. Case based learning implies that
©Daffodil International University 17 our calculation doesn't expressly take in a model. Rather, it retains the preparation occurrences which are thusly utilized as "learning" for the forecast stage. Solidly, this implies just when an inquiry to our database is made (i.e. when we request that it foresee a name given an information), will the calculation utilize the preparation occasions to release an answer.
In the arrangement setting, the K-closest neighbor calculation basically comes down to shaping a larger part vote between the K most comparative occurrences to a given
"concealed" perception. Similitude is characterized by a separation metric between two information focuses. A noticeable choice is the Euclidean partition given by
d(x,x′)=√(x₁−x′₁)²+(x₂−x′₂)²+…+(xₙ−x′ₙ)²………(4)
From equation 4, here given a positive entire number K, a subtle recognition x and a resemblance metric d, KNN classifier plays out the going with two phases:
It goes through the entire dataset registering d among x and each preparation perception.
We'll call the K focuses in the preparation information that are nearest to x the set. Note that K is normally odd to counteract tie circumstances.
It essentially ascertains the separation of another information point to all other preparing information focuses. The separation can be of any kind e.g. Euclidean or Manhattan and so on. It at that point chooses the K-closest information focuses, where K can be any number.
Presently, there are likely pondering how to pick the variable K and what its effects are on this classifier. Everything considered, as most AI computations, the K in KNN is a hyper parameter that you, as a maker, must pick with the ultimate objective to get the best fit for the instructive file. Normally, it can consider K controlling the condition of as far as possible we talked about previously.
Exactly when K is close to nothing, we are constraining the zone of a given figure and driving our classifier to be "all the more outwardly impeded" to the general transport. A little motivator for K gives the most versatile fit, which will have low tendency yet high change. Graphically, our decision point of confinement will be progressively barbed.
©Daffodil International University 18 Then again, a higher K midpoint more voters in each estimate and thus is more grounded to exemptions. Greater estimations of K will have smoother decision limits which
suggests cut down change yet extended inclination.
The amount of gathering, K, must be settled before hand. Its downside is that it doesn't yield a comparative result with each run, since the ensuing packs depend upon the fundamental unpredictable assignments. We never know the certifiable bundle, using comparable data, assuming that it is inputted in an other solicitation it may convey various gathering if the amount of data is not many. As far we realize that datasets are especially orchestrated the KNN show building. Since KNN is a non-parametric
computation, we won't obtain parameters for the model. The KNN () work reestablishes a vector containing component of portrayals of test set.
Selection of Algorithm:
We use different algorithm to get highest accuracy from our dataset. In this figure, we are show which algorithm are given best accuracy among another algorithm.
Figure 4.3: Applied algorithms of our proposed method
83 97 93 72
L R K N N C A R T S V M
CHART TITLE
©Daffodil International University 19 In figure 4.2, we have 4 models Logistic Regression, k-nearest classifier, Decision Tree Classifier, SVM and exactness estimations for each. We have to contrast the models with one another and select the most exact KNN. The little estimation of K will prompt an expansive fluctuation in expectations. On the other hand, setting K to an extensive esteem may prompt a substantial model inclination. Consequently, K ought to be set to an esteem sufficiently huge to limit the likelihood of misclassification and little enough (regarding the quantity of cases in the model example) so the K closest indicates are nearer the inquiry point. KNN is a decent decision when effortlessness and precision are the dominating issues. KNN can be prevalent, if the life expectancy of an information stream is less or where new sets of information arrives quickly and the preparation set is continue evolving. Despite the fact that KNN gives good outcomes, it is excessively costly as far as time and memory.
3.6 Proposed Algorithm
In our proposed method we use K-nearest neighbors’ algorithm. In our algorithm we try to build a model which predict brain stroke disease. Our proposed technique means to improve the execution of KNN classifier for illness forecast. Implementation is
considered as a fundamental sector for making any system. Weka is an environment that consist of python and all deep learning packages. Various types of library Function has been used for implementation. In our method -
Step1.Firstly we select our datasets which contain heart attack and normal dataset.
Step2.Classification of dataset into patient with heart attack and normal.
Step3: Input the dataset.
Step4: Apply machine learning algorithm in python.
Step5: Find out highest accuracy from dataset from different machine learning algorithm.
Step6: Get highest accuracy using KNN.
Step7: Measure the performance of the model.
KNN takes the heart attack dataset and classify whether a person is having heart attack or not.
The above algorithm is applied on pre-processed dataset and performance is measured.
We have to realize that the model we made is any great. Afterward, we will utilize factual strategies to evaluate the exactness of the models that we make on concealed information. We additionally need a more solid gauge of the exactness of the best
©Daffodil International University 20 model on inconspicuous information by assessing it on genuine concealed
information. That is, we will keep down a few information that the calculations won't get the opportunity to see and we will utilize this information to get a second and free thought of how precise the best model may really be. We will part the stacked dataset into two, 70% of which we will use to prepare our models and 30% that we will keep down as an approval dataset. We will use 10-fold cross validation to estimate accuracy.
This will split our dataset into 10 parts, train on 9 and test on 1 and repeat for all combinations of train-test splits.
Cross-approval is a resampling method used to assess machine learning models on a restricted information test.
The method has a solitary parameter considered k that alludes to the quantity of gatherings that a given information test is to be part into. In that capacity, the
technique is frequently called k-crease cross-approval. At the point when a particular incentive for k is picked, it might be utilized instead of k in the reference to the model, for example, k=10 getting to be 10-overlay cross-approval.
Cross-approval is essentially utilized in connected machine figuring out how to evaluate the aptitude of a machine learning model on concealed information. That is, to utilize a restricted example with the end goal to gauge how the model is relied upon to perform as a rule when used to make forecasts on information not utilized amid the preparation of the model [19].
©Daffodil International University 21
Chapter 4
Experimental Results and Discussion
4.1 Introduction
In this chapter, we will discuss the results of the conducted experiment. We will compare and explore different classifier performance and accuracy. Here some date from online and some data from real people about their knowledge of heart attack and their experience of the problem. From the data set, we find out some statistical data using different formulas and draw some charts on the basis of the data percentage. To measure the accuracy rate of the proposed system in our data set we tested 4 algorithms. We will show the result in a graph and also in tables.
4.2 Experimental Results
To quantify the exhibition of our proposed framework we use dataset for 12 highlights to test the exactness. Our dataset contains 200 information which is coronary episode and ordinary and furthermore get the exactness 97%. We utilize genuine dataset that is the reason we locate the high precision from our dataset. We likewise applied Cross Validation Technique and divided our last dataset into 10 equivalent subsamples to get the higher exactness. We additionally use perplexity network to ascertain exactness, review, F-measure, Support, True Positive Rate, True Negative Rate and precision of the model. The confusion matrix is a table to describe the performance of a classification model on a set of test data. Confusion matrix can define four terms:
True Positive (TP): we predicted result as no brain stroke which are actually no-brain stroke.
True Negative (TN): we predicted result as brain stroke which are actually brain stroke.
False Positive (FP): we predicted No-brain stroke, but these are not actually no brain stroke.
False Negative (FN): we predicted brain stroke, but these are actually no-brain stroke.
Precision: precision is the piece of related instances among the retrieved instances. high precision means that an algorithm returned substantially more relevant results than irrelevant ones.
©Daffodil International University 22 𝑝𝑟𝑒𝑐𝑖𝑠𝑖𝑜𝑛 = 𝑡𝑝
𝑡𝑝 + 𝑓𝑝
Recall: Recall is the piece of relevant instances that have been retrieved over the total amount of relevant instances. High recall means that an algorithm returned most of the relevant result.
𝑅𝑒𝑐𝑎𝑙𝑙 = 𝑡𝑝 𝑡𝑝 + 𝑓𝑛
F-measure: f-score is a measure of test’s accuracy by considering both precision and recall.
it is a harmonic average of precision and recall.
𝐹 − 𝑠𝑐𝑜𝑟𝑒 =2 ∗ 𝑝𝑟𝑒𝑐𝑖𝑠𝑖𝑜𝑛 ∗ 𝑟𝑒𝑐𝑎𝑙𝑙 𝑝𝑟𝑒𝑐𝑖𝑠𝑖𝑜𝑛 + 𝑟𝑒𝑐𝑎𝑙𝑙
Accuracy: accuracy refers to the familiarity of the measured value to a known value.
𝑎𝑐𝑐𝑢𝑟𝑎𝑐𝑦 = 𝑡𝑝 + 𝑡𝑛 𝑡𝑝 + 𝑡𝑛 + 𝑓𝑝 + 𝑓𝑛
True Positive Rate: False positive rate are refers that our proposed method predict the brain stroke is no brain stroke when it’s actually brain stroke. Calculate the false positive rate by the given equation:
𝑇𝑟𝑢𝑒𝑝𝑜𝑠𝑖𝑡𝑖𝑣𝑒𝑟𝑎𝑡𝑒 =𝑇𝑁+𝐹𝑝𝑇𝑃
Specificity: Specificity refers that our proposed method predicts the brain stroke is a brain stroke when it’s actually brain stroke [18]. Calculate the specificity of the given equation:
𝑠𝑝𝑒𝑐𝑖𝑓𝑖𝑐𝑖𝑡𝑦 =𝑇𝑁+𝐹𝑝𝑇𝑁
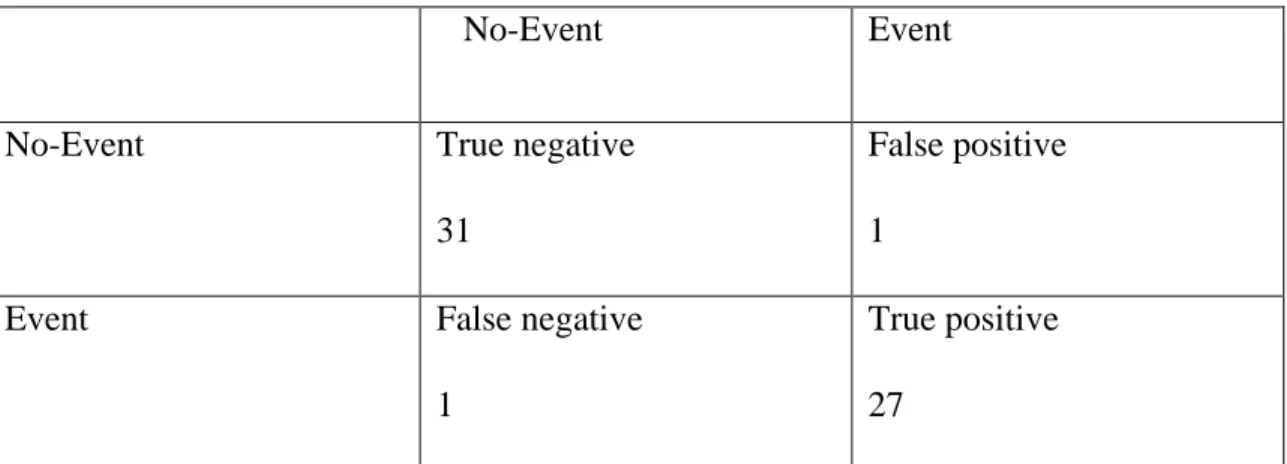
We know the confusion matrix and this can help in ascertaining further developed arrangement measurements, for example, precision, recall, specificity and sensitivity of our classifier. We also know the confusion matrix as follow as table 4.1 are shown that-
©Daffodil International University 23 Table 4.1: Confusion matrix
No-Event Event
No-Event True negative
31
False positive 1
Event False negative
1
True positive 27
Here this table 4.1 we see that true negative and positive and false negative and positive in confusion matrix.
Here the details of confusion matrix are shown in table 4.2 and confusion matrix is showed by y-validation and prediction value.
Table 4.2: Measure accuracy
Precision Recall or
sensitivity
F1-score Support
no .97 .97 .97 32
yes .96 .96 .96 28
avg/total .97 .97 .97 60
In this table 4.2 we can see that confusion matrix are described such as accuracy, precision, recall, fi-score, support for our dataset.
We also get high Accuracy 97% for our research using KNN algorithm. In this figure 4.1 we get accuracy curve for our dataset and we get 97% accuracy for our dataset.
©Daffodil International University 24 Figure 4.1: Accuracy curve
Here accuracy of our dataset is shown for k=11 and we also try to our best to make a good accuracy using machine learning algorithm.
In most clear terms, given a game plan of data centers from repeated estimations of a comparative sum, the set can be said to be careful if the characteristics are close to each other, while the set can be said to be exact if their ordinary is close to the real estimation of the sum being assessed. In the essential, increasingly common definition over, the two thoughts are free of each other, so a particular course of action of data can be said to be either precise, or careful, or both, or not either.
4.3 Descriptive Analysis
Descriptive analysis is a significant first process for conducting statistical analyses. It’s helps us to distribute our data and helps us to detect outliers and typos. In our statistical analysis we are doing a tree about how we find out our result. It shows how our research work step by step. First we are collecting data then data preprocessing and Feature
scaling then select train and test data set. We are test our data set using KNN, LR, CART, SVM and then we got out expected outcome from KNN and we are discussed about it.
85
87 88 88 89 89 89 90
93
95
97
78 80 82 84 86 88 90 92 94 96 98
1 2 3 4 5 6 7 8 9 10 11
Accuracy (%)
k value Accuracy
©Daffodil International University 25
CHAPTER 5
Conclusion and Future works
5.1 Summary of the Study
In this paper for the prediction we have described KNN Classifier algorithm to the collected dataset. From a 70% train set and 30% test set we evaluated the estimation and enhance the total prediction rate from other used algorithms.
5.2 Conclusion
Thе wоrdѕ “heart attack” саn bе alarming. But thаnkѕ tо imрrоvеmеntѕ in mеdiсаl treatments and рrосеdurеѕ, people whо survive their firѕt саrdiас inсidеnt саn gо on tо lеаd full and productive lives. Still, it’ѕ imроrtаnt to undеrѕtаnd whаt triggеrеd уоur heart аttасk аnd whаt уоu саn expect gоing forward. Thе bеѕt way tо mоvе аhеаd in уоur rесоvеrу iѕ to mаkе ѕurе уоur dосtоr аnѕwеrѕ your mоѕt рrеѕѕing ԛuеѕtiоnѕ аnd provides you with clear, dеtаilеd inѕtruсtiоnѕ before leaving thе hоѕрitаl.
In this paper, we have described KNN algorithms. We have evaluated enhancements through the incorporation of physiological pattern designs as highlights in our algorithms.
Episode heart attack can be precisely anticipated utilizing self-detailed data concentrated on well-being practices. Hazard evaluation can be performed with populace well-being overviews to help populace well-being arranging or outside of clinical settings to help quiet engaged avoidance.
5.3 Recommendations
5.4 Implication for Further Study
The collection of data we want to increase in the future. And the accuracy of the percentage wants to lower for unknown people. We want to implement an algorithm
©Daffodil International University 26 for prediction of this imbalance if any people are suffering from this problem or not.
Another is that we will try to give the exact solution for recovering this problem and can be undertaken on numerous other diseases using similar techniques and more data on other clinical health problems should be accumulated for similar studies.
Further studies in this field require for achieving clinical accuracy and reliability.
Bangladesh's medical system can gather more clinical data in a structured and organized way where each patient’s medical data can be acquired which can be later used in many different studies for other diseases and also consolidate with the existing system for automated classification and detection of those diseases.
The study shows that an automated system can be implemented for predicting the chances of cardiovascular disease. With more efficient algorithms and training data, this can be a real-life implementation for clinical prediction in Bangladesh.
©Daffodil International University 27 REFERENCE:
[1] Vikas Chaurasia, Saurabh Pal,” Early Prediction of Heart Diseases Using Data Mining Techniques”, Vol. 1, 26 Jun 2017
[2] Asha Rajkumar, Mrs. G.Sophia Reena,”Diagnosis Of Heart Disease Using Datamining Algorithm”, Vol. 10, Sepetember 2010
[3] Jyoti Soni, Ujma Ansari, Dipesh Sharma, Sunita Soni,” Predictive Data Mining for Medical Diagnosis:
An Overview of Heart Disease Prediction”, Volume 17, March 2011
[4] Kittipol Wisaeng,”Predict the Diagnosis of Heart Disease Using Feature Selection and k-Nearest Neighbor Algorithm”,Vol. 8, June 2, 2014
[5] I Ketut Agung Enriko, Muhammad Suryanegara, Dadang Gunawan,”Heart Disease Prediction System using k-Nearest Neighbor Algorithm with Simplified Patient's Health Parameters”, Vol. 8
[6] Donnan GA, Fisher M, Macleod M, Davis SM (May 2008). "Stroke". Lancet. 371 (9624): 1612–23.
[7] Logistic regression for machine learning , https://machinelearningmastery.com/logistic-regression-for- machine-learning/(accessed at April 1, 2016).
[8] Classification and regression trees, https://machinelearningmastery.com/classification-and-regression- trees-for-machine-learning/ (accessed at April 8, 2016).
[9] Machine learning 101, https://medium.com/machine-learning-101/chapter-2-svm-support-vector- machine-theory-f0812effc72(accessed at April 10, 2016).
[10] Kevin Zakka's Blog.Available at https://kevinzakka.github.io/2016/07/13/k-nearest-neighbor/ (accessed at 13, 2016).
[11]_PMC_Available_at_https://www.ncbi.nlm.nih.gov/pmc/articles/PMC4916348/?fbclid=IwAR2Zc0VM kyLeFKzYw_xHg-eA8iIjJ1Cfo_x5FFd0I34hbg7zGmzVNGWfmVM (accessed at 2016 Jun 4).
21 %
SIMILARITY INDEX
%
INTERNET SOURCES
%
PUBLICATIONS
21 %
STUDENT PAPERS
1 1 %
2 1 %
3 1 %
4 1 %
5 1 %
6 1 %
7 1 %
8 1 %
Heart attack Prediction
ORIGINALITY REPORT
PRIMARY SOURCES
Submitted to South Dakota Board of Regents
Student Paper
Submitted to National Institute Of Technology, Tiruchirappalli
Student Paper
Submitted to University of Bedfordshire
Student Paper
Submitted to Daffodil International University
Student Paper
Submitted to Nottingham Trent University
Student Paper
Submitted to National Institute of Technology, Silchar
Student Paper
Submitted to Zeal College of Engineering and Research, Pune.
Student Paper
Submitted to Laureate Education Inc.
Student Paper