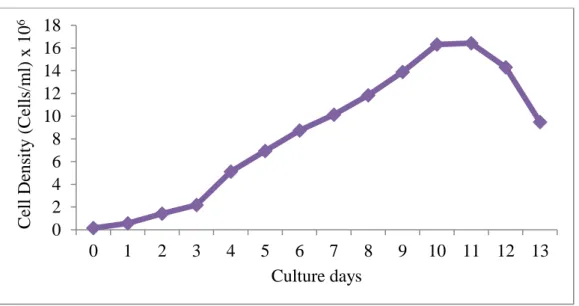
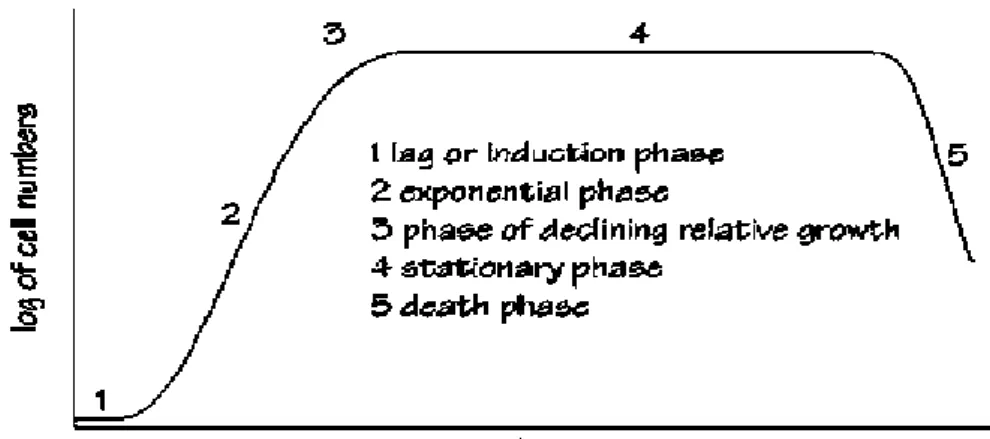
The growth phase of microalgae consists of five growth phases, which were lag phase, exponential phase, relative growth decline phase, stationary phase and death phase (Lavens et al. 1996). The total lipid content of algae in the declining relative growth phase was significantly higher than that in the exponential phase and stationary phase (Huang et al. 2004). Carbohydrate composition and metabolism can vary significantly from species to species (Rismani-Yazdi et al. 2011).
Temperature also influences nitrogen availability, growth, fatty acid profile and cell density of microalgae culture (Navarro-Peraza et al., 2017). Lipids were stored in salt-stressed cells and degraded when stressed cells crossed optimal conditions (Shetty et al. 2019). An increase in the pH of the culture medium resulted in a reduction in the total amount of structural lipids (Spilling et al., 2013).
Phosphatidylglycerol (PG) was observed to decrease with phosphorus limitation in Chlamydomonas reinhartdtii (Sato et al., 2000). A decrease in iron content also reduces carotenoid composition, which has also been observed to be reduced due to deficiency in iron content (Kobayashi et al., 1993) (van Leeuwe & Stefels, 1998).
Nitrogen
Cellular chlorophyll concentration also decreases due to iron limitation (Greene et al., 1992) (Liu et al., 2008) observed that, to increase lipid content, the highest iron concentration in the cultivation of Chlorella vulgaris was key factor.
Chapter3
Materials and Methods
- Purpose of the Growth Curve Experiment
- Processing of Natural Sea Water
- Preparation of Conway media
- Main minerals stock solution preparation
- Trace minerals preparation
- Vitamin solution preparation
- Modified potassium nitrate in Conway media solution preparation
- Growth Curve Experiment
- Analysis of growth parameters
- Culture of Nannochloropsis sp. using different nitrogen concentration
- Proximate composition analysis
- Protein analysis
- Lipid analysis
- Carbohydrate analysis
- Statistical analysis
- Results
- Growth Curve experiment
The pH of the culture media was maintained using 1:3 HCl and water solution. The first chemical weighed, potassium nitrate, was added to the milliequivalent of water and dissolved with continuous stirring. After it was completely dissolved, the second chemical, sodium orthophosphate, was added to the solution and also dissolved with constant stirring.
All required chemicals were accurately weighed with an electric scale (RADWAG, AS 220.R2). Next, the first weighed chemical, zinc chloride, was added to a milliequivalent of water and dissolved with constant stirring. When it was completely dissolved, another chemical, cobalt chloride, was added to the solution, which was also dissolved with constant stirring.
This procedure was repeated for the rest of the chemicals in specific order until all were added to the solution. Finally, the vitamin B (thiamine) solution was kept in a tight Schott-Duran® bottle and stored in the refrigerator until later use. The stock of microalgae was designed by following three duplicates for each of the treatments.
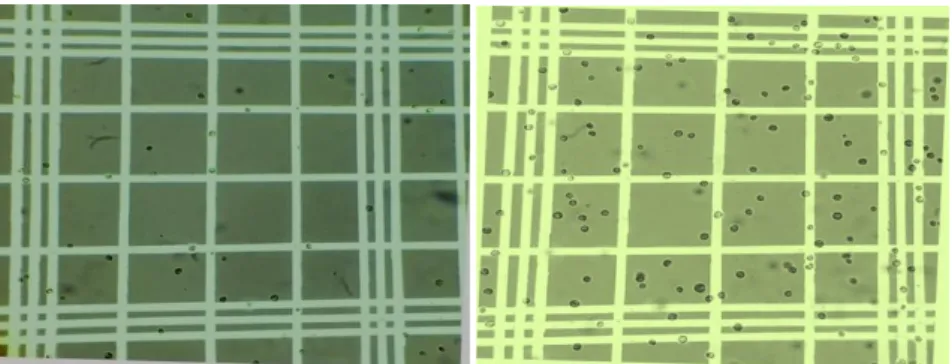
The growth curve experiment was performed until the stationary phase was determined for each of the treatments. The drop was then placed between the cover glass and the base of the counting chamber as a result of the capillary effect. This phase was the determination of the stationary phase from the growth curve of Nannochloropsis sp.
After the completion of phase 1, there was a decision-making position to decide when the cultures of different nitrogen concentrations had reached the stationary phase. It was then cooled in a water bath and 2.5 ml of the prepared mixed reagent was added 10 minutes after cooling. The reading of the mixed solution was taken with spectrophotometer (UV-1601, Shidmadzu) at the wavelength of 750nm.
The same procedures described for the protein analysis were done on the standard series and a calibration line was plotted against the results and the protein composition was determined for each sample. From day 0 to day 4, the lag phase was observed from the figure: for all treatments.
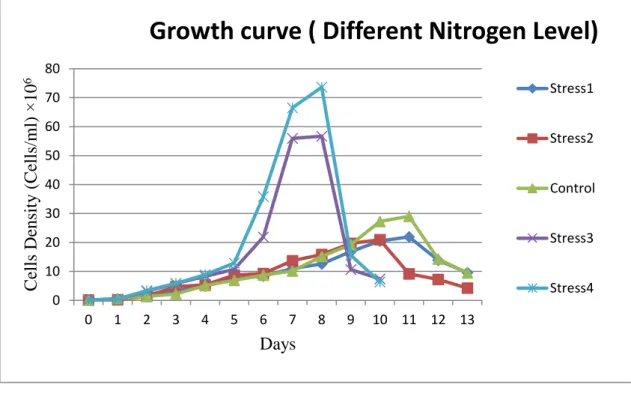
Growth curve ( Different Nitrogen Level)
- Cell doubling time (td)
- Proximate Composition in Nannochloropsis sp
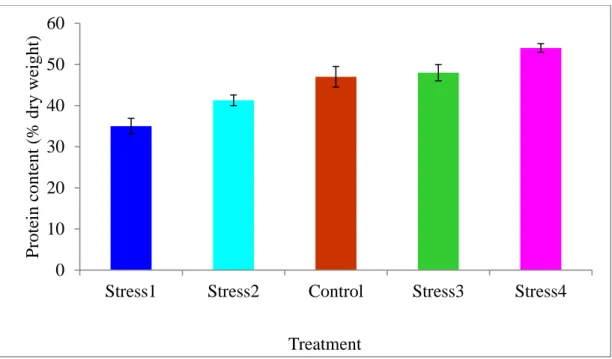
- Protein Content
- Lipid content
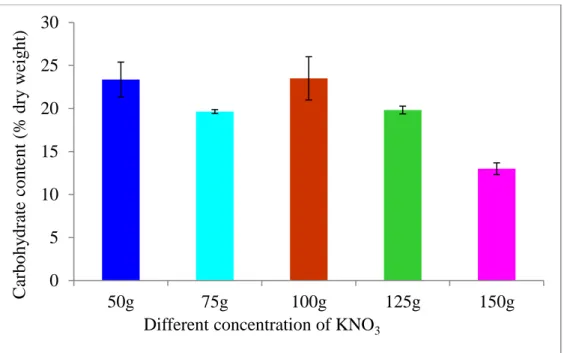
- Carbohydrate Content
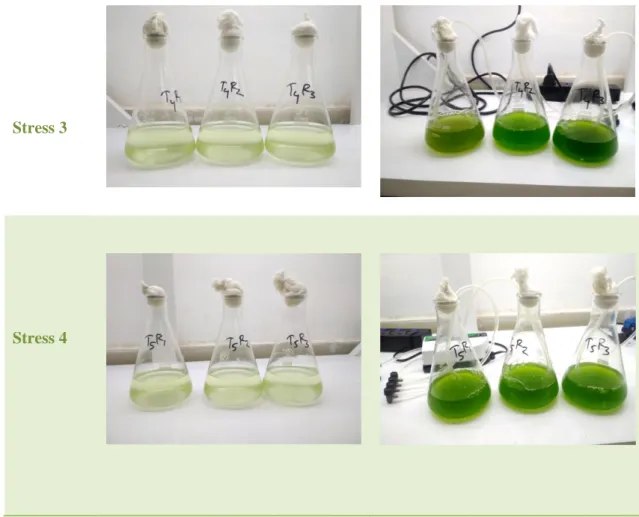
- Color variation of nitrogen depleted and augmented treatments
- Discussion
- Nannochloropsis sp. growth performance under different nitrogen concentration
- Nannochloropsissp. proximate composition under different nitrogen concentration
- Conclusions
The protein content was obtained by following the protein determination procedure mentioned in the methodology section. The stress 1 showed that its protein content was 35% and 41% protein was found in the stress 2 treatment. The lipid content was obtained by following the lipid determination procedure mentioned in the methodology section.
The carbohydrate content was obtained by following the carbohydrate determination procedure mentioned in the methods section. In the present study, the treatment with 50g/L KNO3 showed lower cell density than the control (100g/L KNO3). In the cell density growth curve, it was observed that the lag phase (day 0-3) for all treatments remains similar in duration.
The exponential phase was much shorter (Day 3-7) at the higher nitrogen concentration than the normal concentration. So, the lowest nitrogen concentration treatment of the experiment had 3.47% lower growth rate than the control treatment. From the results section, it was observed that td was highest in the low nitrogen treatment.
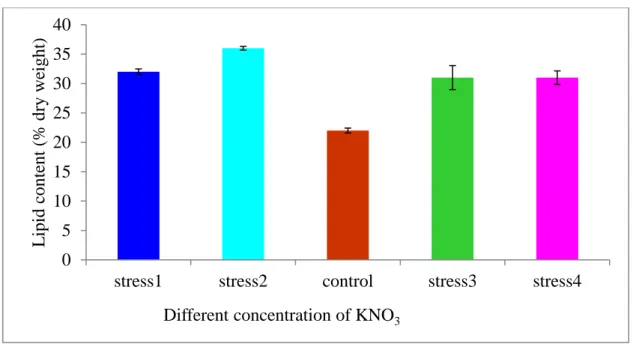
This study reveals that when the nitrogen concentration in the culture medium was increased, the protein content was increased significantly. In this study, there were significant differences in lipid content in the nitrogen deficiency and augmentation treatments compared to the control treatment. The control treatment was determined to have 22% lipid content, which was the lowest among the treatments. So the lower nitrogen treatment in the culture medium to achieve higher lipid content was appropriate consideration.
Due to the relatively lower chlorophyll-forming content (nitrogen molecule) in the environment of KNO3 treatments with 50 g/L and 75 g/L, the growth rate was unusual and the cell density was below the normal range. In this study, lipid content was increased with decreasing nitrogen content in the culture media. El-Kassas, 2013) also had the same observation of nitrogen limitation on lipid accumulation in the microalgal cells.
Various studies have been conducted on specific characteristics, which are explained in detail in the literature review section of this study. The direct assembly phase showed that a reduced concentration of nitrogen in the culture medium caused the cells to accumulate more lipids than a higher concentration of nitrogen.
Chapter7
Recommendation and Future Perspectives
Effects of salinity on growth and lipid accumulation of the biofuel microalga Nannochloropsis salina and invading organisms. Microbial oils as food additives: Recent approaches to improve microbial oil production and its polyunsaturated fatty acid content. A techno-economic analysis of industrial production of marine microalgae as a source of EPA- and DHA-rich raw material for aquafeeds: Research challenges and opportunities.
Effect of temperature and nitrogen concentration on growth and lipid content of Nannochloropsis oculata and Chlorella vulgaris for biodiesel production. Effects of a diet of a nitrogen-limited alga (Tetraselmis suecica) on growth, survival and biochemical composition of tiger shrimp (Penaeus semisulcatus) larvae. Aquaculture. Effect of light intensity and nitrogen starvation on CO 2 fixation and lipid/carbohydrate production of an indigenous microalga Scenedesmus obliquus CNW-N.
Optimization of the growth and fatty acid composition of a unicellular marine picoplankton, Nannochloropsis sp., with enriched carbon sources. The effect of the gradual increase in salinity on the biomass productivity and biochemical composition of various marine, halotolerant and halophilic microalgae. Cultivation of Chlorella vulgaris using nutrients from domestic wastewater for biodiesel production: growth conditions and kinetic studies.
Pathways of lipid metabolism in marine algae, co-expression network, bottlenecks and candidate genes for enhanced production of EPA and DHA in species chromista.Marine Drugs. Effects of temperature and nitrogen limitation on growth kinetics, proximate composition and fatty acid profile of Nannochloropsis sp. Transcriptome sequencing and annotation of the microalga Dunaliella tertiolecta: Pathway description and gene discovery for next-generation biofuel production.
Effects of light intensity and nitrogen starvation on growth, total fatty acids and arachidonic acid in the green microalga Parietochloris incisa. Effects of iron and light stress on the biochemical composition of Antarctic Phaeocystis (Prymnesiophyceae) pigment composition. Journal of Phycology. Effects of different nitrogen and phosphorus concentrations on the growth, nutrient uptake and lipid accumulation of a freshwater microalga Scenedesmus sp.
Appendices (Statistical Analysis of Data)
Uses harmonic mean sample size = 3,000. b) One-way analysis of variance examining the effect of nitrogen concentration on the lipid content of Nannochloropsis sp. is being investigated.