Competencies Achievement of BRAC NFPE Students Improving
Samir R Nath
Senior Research Fellow
and
Mirja M Shahjamal
Junior Research Associate
June 2004
_____________________________________________________________
Educational Research Unit
Research and Evaluation Division, BRAC BRAC Centre, 75 Mohakhali Dhaka 1212, Bangladesh Phone: 9881265 (ext. 2707), Fax: 8823542, Email: [email protected]
Contents
Abstract 3
Introduction 4
Objective 4
Methodology 4
The instrument 4
Sampling 5
Administering the test 5
Limitations 6
Findings 6
Achievement of Bangla competencies 6
Reading skills 6
Writing skills 7
Listening skills 7
Overall performance in Bangla 7
Achievement of English competencies 8
Reading skills 8
Writing skills 8
Listening skills 9
Overall performance in English 9
Overall performance in language 10
Achievement of Mathematics competencies 10
Achievement of Social studies competencies 12
Achievement of General Science competencies 14
Achievement in Religious Studies 16
Overall learning achievement 16
Classification of the competencies 16
Achievement of all competencies 17
Mean number of competencies achieved 18
Mean number of correctly answering items 19
School level analysis 20
Performance according to the taxonomic class level of items 20
Highlights of the findings 20
Annexes 22
3
Abstract
Competency achievement of the students of BRAC non- formal primary schools at the end of their primary cycle was assessed and reported in this article. Four cohorts of students were considered and brought under assessment at the end of respective academic cycle. They are the students of second, third, fourth and fifth batches completing the courses between 2000 and 2003. The findings reveal that overall performance of the NFPE graduates increased over time. The graduates of the recent years are getting more homogeneous than the previous years and inter-school variation significantly reduced over the period. Gender difference in achievement also decreased recently. A collective effort of the teachers, programme organisers and the management was urged to keep this trend on.
Introduction
The National Curriculum and Textbook Board (NCTB) under the Ministry of Education has specified 53 terminal competencies for primary education in 1988. The students completing five year cycle of primary schooling are suppose to achieve the competencies.
Competency based education was introduced at primary level in 1992 – the competencies were incorporated in syllabus and the textbooks were revised accordingly. According to the Bloom’s taxonomy the competencies can be classified into three domains – cognitive, psychomotor and affective. Later the NCTB has modified the list of competencies and now there are 50 competencies in the list. It can be mentioned that such a modification had no affect in the cognitive type of competencies. Each of the competencies is accompanied by a set of learning continuum specified separately for each grade (I to V).
It is expected that the students would achieve these competencies throughout the primary cycle.
Following the NCTB curriculum for formal schools BRAC offers full course of primary education through its non- formal schools. However, the duration of course is four years instead of five years. Textbooks prepared by BRAC are used during first three grades and NCTB prepared textbooks are used for grades IV and V. First batch of students completing full cycle of primary education from BRAC schools came out in 1999.
During this period four more cohorts of students were graduated.
For the first time in Bangladesh, in 2000, the Education Watch study investigated the competencies achievement of the students – where the non- formal primary school students were considered as a stratum. In the non-formal stratum a good number of BRAC schools were sampled. There was no scope to do separate analysis of the BRAC school students in the Education Watch. Later BRAC Education Programme (BEP) felt a need to do so. BEP also felt the need of offering the same test to its graduates once a year. Three cohorts of students were tested afterwards, totalling four during 2000 to 2003.
The performances of the students in first three tests are reported earlier in Nath 2002 and 2003. This report presents the results from the last test along with a comparison with the previous assessments.
Objective
This study aimed to assess competency based learning outcome of the BRAC school graduates, completing five- year cycle of primary education during 2000 to 2003.
Methodology
The instrument
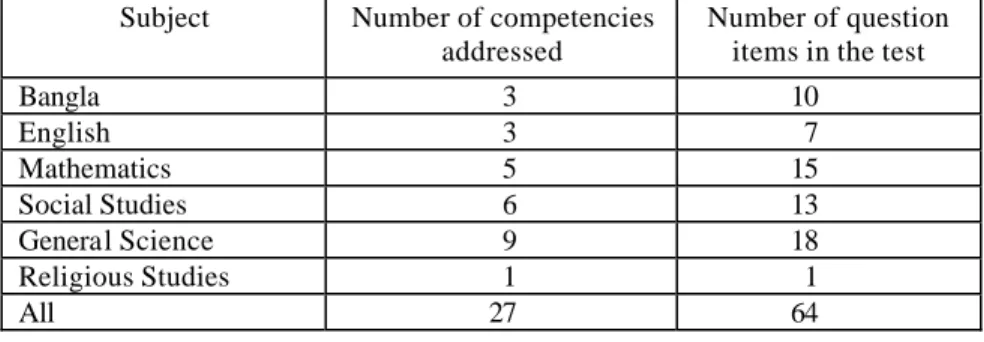
The competency based test instrument developed for the Education Watch 2000 was used for this study. The instrument incorporated 27 of the 29 cognitive competencies in the NCTB list. The subjects considered for the test were Bangla, English, Mathematics,
5
Social Studies and General Science. Total number of items in the test was 64. Table 1 presents number of test items and competencies addressed by subject. List of competencies addressed under each subject is provided in Annex 1.
Table 1. Number of competencies and question items by subject Subject Number of competencies
addressed
Number of question items in the test
Bangla 3 10
English 3 7
Mathematics 5 15
Social Studies 6 13
General Science 9 18
Religious Studies 1 1
All 27 64
Sampling
Only the rural NFPE schools were considered. Data of the first assessment were came out from the Education Watch 2000, where 26 BRAC schools were in the sample. Fourteen students were randomly selected from each school – 7 boys and 7 girls. Number of students assessed was 357, 175 girls and 182 boys.
Similar sampling strategy was applied in the following assessments. The second and third assessments were done on 420 students each taking from 30 schools. However, the fourth assessment was done on 867 students from 62 schools. Schools were randomly selected.
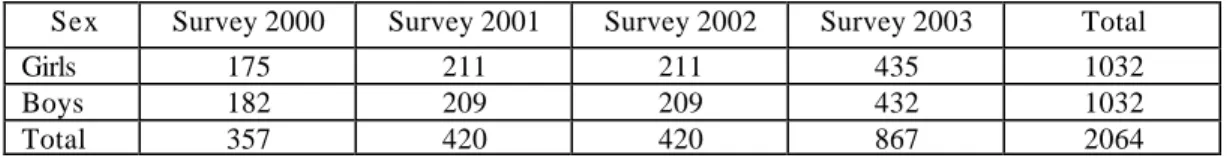
From each selected schools 7 girls and 7 boys were selected separately through a systematic sampling procedure. Sample size with breakdown by year of assessment and sex is presented in Table 2.
Table 2. Sample at a glance
Sex Survey 2000 Survey 2001 Survey 2002 Survey 2003 Total
Girls 175 211 211 435 1032
Boys 182 209 209 432 1032
Total 357 420 420 867 2064
Administering the test
The test was administered in a similar way in all the four surveys. In each school all 14 students were tested at a time in their own classrooms. A team of two trained test administrators conducted the test.
The whole test was divided into three parts. Tests for Bangla and English languages were offered in the first one-hour. Tests for Mathematics, Environmental Studies (Social Studies and General Science) and Religious Studies were given during the second hour.
Listening test for Bnagla and English took ten minutes. There were ten minutes break between each part. At the beginning the test administrators took the opportunity to make the students understand the rules and regulations of the test. Flip charts and blackboards
were used to do so. The first three sur veys were carried out between October and November of the years 2000, 2001 and 2002, and the fourth one was in December 2003.
That is the tests were conducted just before the ending of the respective cycles.
Limitations
The students assessed for this stud y were drawn from the rural schools, because majority of the BRAC schools are in the rural areas. Thus, this study presents the situation of the BRAC NFPE schools in rural areas only. Again, only the cognitive competencies were assessed. However, objective of any education is to develop both cognitive and non- cognitive aspects of the students’ ability.
Findings
Achievements of Bangla competencies
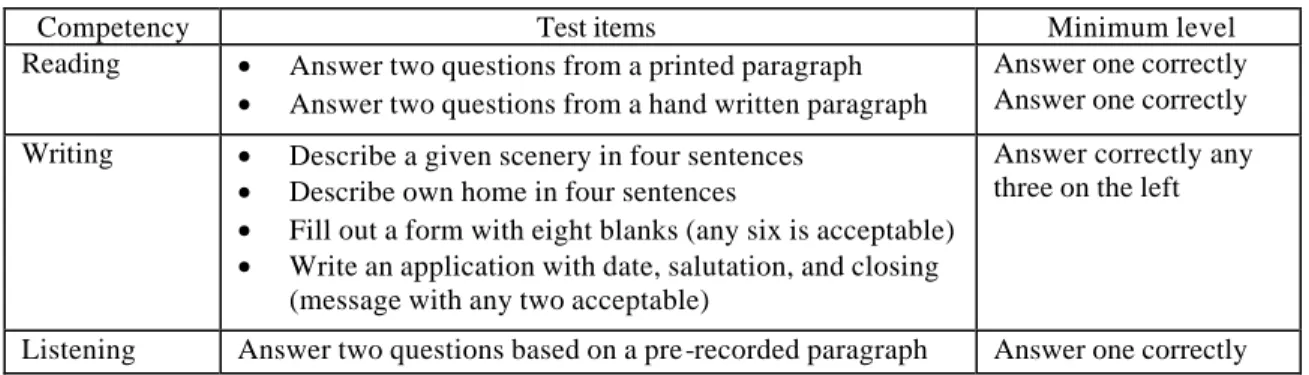
There are four competencies in Bangla, of which three were considered for assessment.
These are Reading, Writing and Listening. No test was taken for assessing vocabulary of the students. Ten question items were placed in the test for Bangla. Table 3 provides a summary of the competencies, test items, and minimum level for qualifying each of the competencies.
Table 3. Competencies, test items, and minimum levels for Bangla
Competency Test items Minimum level
Reading • Answer two questions from a printed paragraph
• Answer two questions from a hand written paragraph
Answer one correctly Answer one correctly Writing • Describe a given scenery in four sentences
• Describe own home in four sentences
• Fill out a form with eight blanks (any six is acceptable)
• Write an application with date, salutation, and closing (message with any two acceptable)
Answer correctly any three on the left
Listening Answer two questions based on a pre -recorded paragraph Answer one correctly
Reading skills
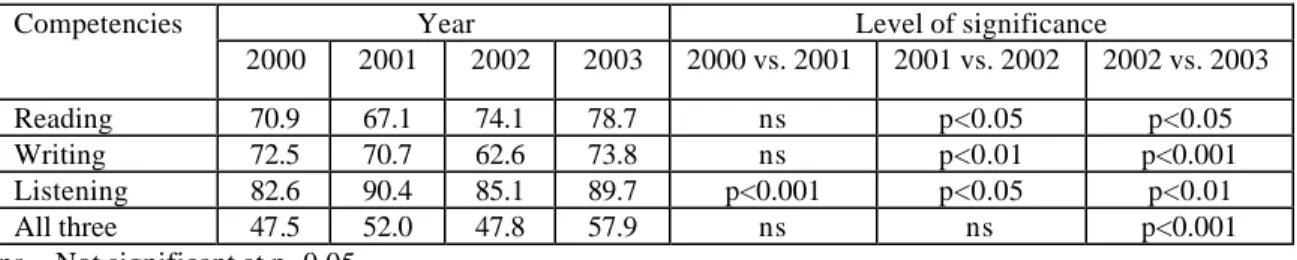
Students ability to read hand written and printed materials were assessed. Nearly 71 percent of the students in 2000 achieved this competency. This was 67.1 percent in 2001, 74.1 percent in 2002 and 78.7 percent in 2003 (Table 4). Although there was no statistically significant difference among the performances of the students of 2000 and 2001, however the performance significantly increased in 2002 (p<0.05) and again in 2003 (p<0.001). The boys outperformed the girls in the first three assessments, but no difference was observed in the forth assessment (Annex 2). The gender gap was increasing over the period up to 2002, but it disappeared in 2003. The performance of the girls jumped from 69.2 percent in 2002 to 77.7 percent in 2003, but it dropped for the boys – 83.7 percent in 2002 to 80.6 percent in 2003.
7
Table 4. Percentage of students achieving Bangla competencies by year
Year Level of significance
Competencies
2000 2001 2002 2003 2000 vs. 2001 2001 vs. 2002 2002 vs. 2003
Reading 70.9 67.1 74.1 78.7 ns p<0.05 p<0.05
Writing 72.5 70.7 62.6 73.8 ns p<0.01 p<0.001
Listening 82.6 90.4 85.1 89.7 p<0.001 p<0.05 p<0.01
All three 47.5 52.0 47.8 57.9 ns ns p<0.001
ns = Not significant at p=0.05
Writing skills
There were four questions for assessing writing skills in Bangla. These are description of a seen and an unseen objects, fill up a form and write an application. Among the students of 2000, 72.5 percent achieved writing competency. This was 70.7 percent for the cohort of 2001, 62.6 percent for 2002 and 73.8 percent for 2003 (Table 4). Similar to reading skills, there was no significant difference among the performance of the students of 2000 and 2001. However, the performance significantly deteriorated in 2002, and again increased in 2003. This shows, of the four cohorts of students the batch of 2002 were significantly poorer in writing. Interestingly, the boys and the girls performed equally in writing in all the four assessments (Annex 2).
Listening skills
Of the three competencies in Bangla, the students did best in listening test in all the four assessments. Table 4 shows that the performance in listening significantly increased from 82.6 percent in 2000 to 90.4 percent in 2001 (p<0.01), but decreased to 85.1 percent in 2002 (p<0.05), which again increased to 89.7 percent in 2003 (p<0.01). Like the writing competency, no gender difference was observed in listening test in any of the surveys (Annex 2).
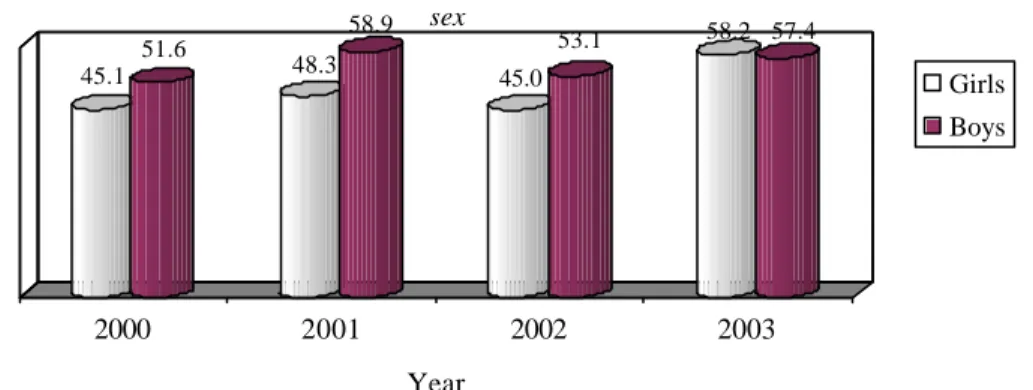
45.1
51.6 48.3
58.9
45.0
53.1 58.2 57.4
2000 2001 2002 2003
Year
Figure 1. Percentage of students achieving all three competencies in Bangla by year and sex
Girls Boys
Overall performance in Bnagla
Over 47 percent of the students achieved all the three competencies in 2000; this was 52 percent in 2001 and 47.8 percent in 2002 (Table 4). No significant difference was
observed among the students of first three cohorts. However, the performance significantly increased to 57.9 percent in 2003 – the increase from 2002 to 2003 was 10 percentage points. Other important feature of the latest assessment was that the girls surpassed the boys for the first time in 2003. The performance of the girls was five to ten percentage points behind the boys in the earlier assessments. This year, the girls were 0.8 percentage points ahead of the boys.
Achievement of English competencies
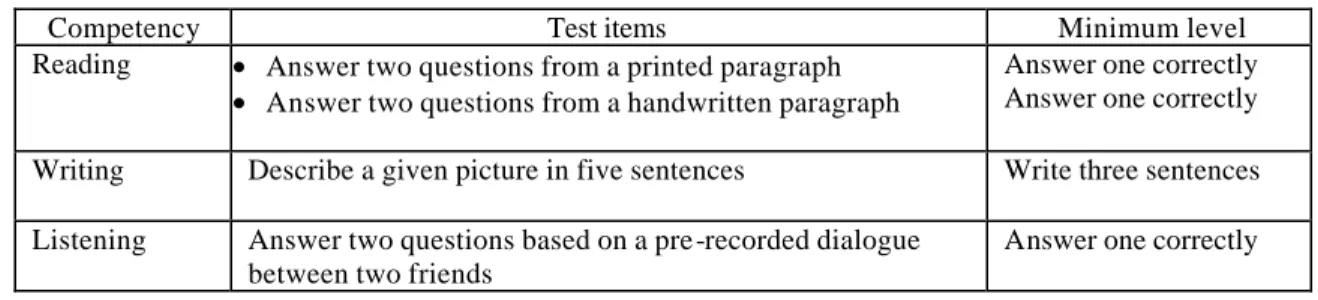
Like Bangla, three out of four competencies were assessed in English – these are Reading, Writing and Listening. Vocabulary was not considered for test. There were seven question items in the test. Table 5 presents a summary of the competencies, corresponding test items, and minimum level for qualifying the competencies in English.
Table 5. Competencies, test items and minimum levels for English
Competency Test items Minimum level
Reading • Answer two questions from a printed paragraph
• Answer two questions from a handwritten paragraph
Answer one correctly Answer one correctly Writing Describe a given picture in five sentences
Write three sentences Listening Answer two questions based on a pre -recorded dialogue
between two friends
Answer one correctly
Reading skills
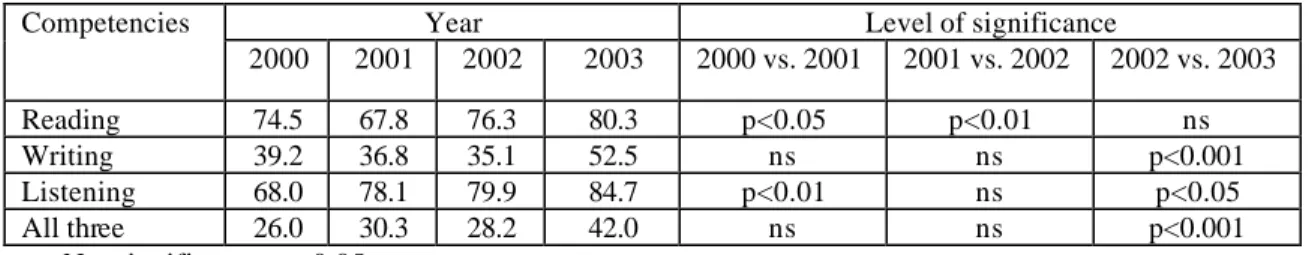
Reading ability of hand written and printed materials in English was assessed. Over 80 percent of the students achieved this competency in 2003. It was observed that three quarters or more students had this competency in all the assessment year except 2001, when the performance significantly reduced to 67.8 percent. It was good to see that no gender difference was observed in any of the surveys (Annex 4).
Table 6. Percentage of students achieving English competencies by year
Year Level of significance
Competencies
2000 2001 2002 2003 2000 vs. 2001 2001 vs. 2002 2002 vs. 2003
Reading 74.5 67.8 76.3 80.3 p<0.05 p<0.01 ns
Writing 39.2 36.8 35.1 52.5 ns ns p<0.001
Listening 68.0 78.1 79.9 84.7 p<0.01 ns p<0.05
All three 26.0 30.3 28.2 42.0 ns ns p<0.001
ns = Not significant at p=0.05
Writing skills
The students were asked to write five sentences on a seen object, correctly writing three sentences was considered as minimum qualification for achieving the competency.
Performance of the students in this competency was very low in previous years where below 40 percent of them could qualify. However, the last survey shows a significant
9
improvement in writing skills in English. Interestingly, during last one year (2002 to 2003) the performance improved 17.4 percentage points (35.1% to 52.5%; p<0.001).
It was common in all the surveys that a majority of the students were unable to conceptualise what they wanted to write seeing the given object. However, the situation is getting improved day-by-day. A good proportion of the students’ just picked a portion of the object (e.g., table, book, chair, etc.) and tried to make sentence with it. This competency was so hard for the students that 37.7 percent of the students in 2000, 31.5 percent in 2001, 30.5 percent in 2002 and 14.1 percent in 2003 did not answer this question. One interesting observation is that proportion of students tried to answer this question increased day by day. However, it was possible only for a few students to write five correct sentences. Only 6.8 percent of the students wrote five correct sentences in 2003.
Listening skills
Performance of the students in this competency was better than the other two competencies in English. Nearly 85 percent of the students achieved this competency in 2003 – this performance was significantly higher than that of previous years. The students are doing better in this competency over the period. The girls and the boys did equally in this competency in all the surveys (Annex 4).
Overall performance in English
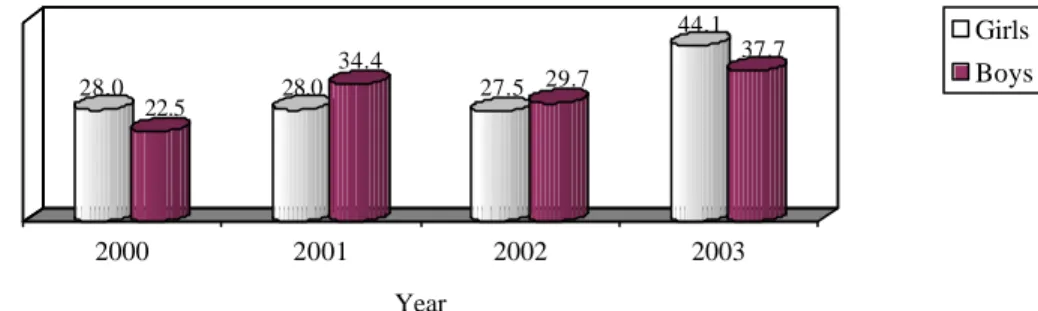
Proportion of students achieving all the three competencies in English was found improving during the period. For instance, only a quarter of the students achieved all the three competencies in English in 2000, which was 42 percent among the students of 2003. There was no variation in this regard among the students of first three cohorts and again no gender difference was noticed during this period. However, the girls outperformed the boys in the latest survey (44.1% vs. 37.7%). This difference was much higher than that of Bangla.
28.0 22.5 28.0 34.4
27.5 29.7
44.1 37.7
2000 2001 2002 2003
Year
Figure 2 Percentage of students achieving all three competencies in English by year and sex
Girls Boys
Some of the students failed to achieve any of the English competencies each year.
However, the proportion of students achieving no English competenc y decreased over
time. Over 10 percent of the students in 2000, 7.6 percent in 2001, 6.2 percent in 2001 and 2.9 percent in 2003 did not achieve any of the English competencies.
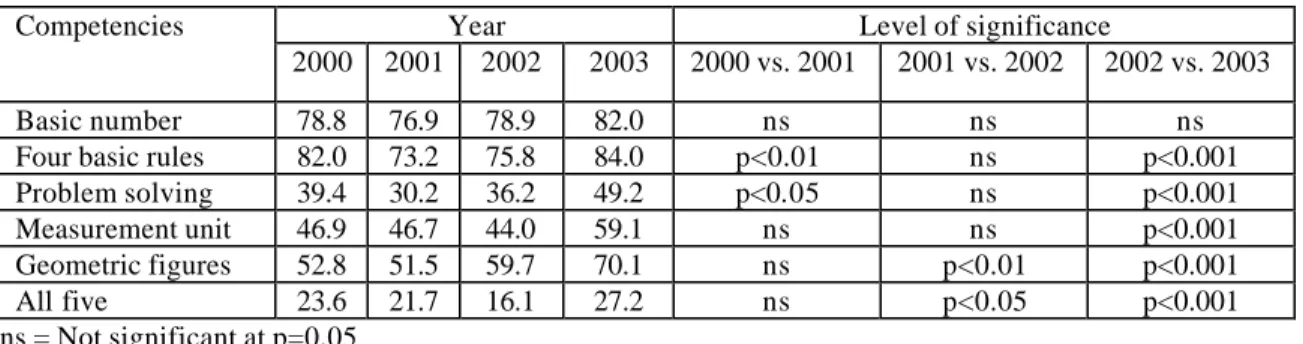
Overall performance in language
A fifth of the students achieved all the language competencies (Bangla and English together) in 2000; this increased to 25.8 percent in 2001, and then decreased to 20.4 percent in 2002. However, a significant improvement was observed in 2003, where 31.6 percent of the students achieved all six competencies in language. Each year, a small portion of the students (nearly one percent) did not achieve a single language competency.
21.7 17.0
24.2 28.2
19.0 23.4
32.6 29.6
2000 2001 2002 2003
Year
Figure 3 Percentage of students achieving all six competencies in Bangla and English languages by year and sex
Girls Boys
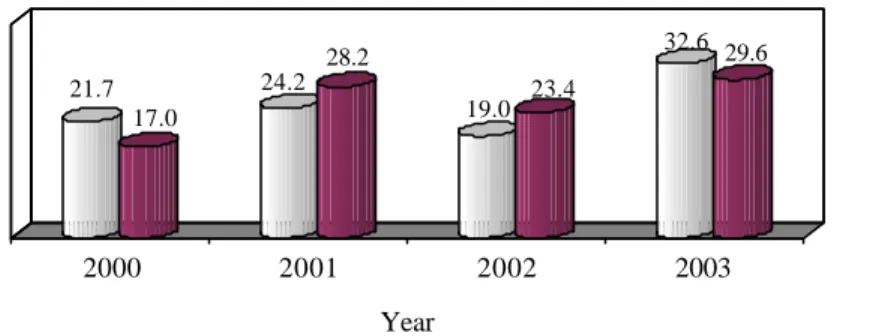
Achievement of Mathematics competencies
Competencies in Mathematics covers both arithmetic and geometry. There are five competencies in Mathematics, for which 15 question items were placed in the test instrument. The competencies cover the areas of basic number skills, four rules of arithmetic, problem solving, measurement of units, and geometric figures. Table 7 presents the competencies, test items, and minimum requirement level for qualifying the Mathematics competencies.
Percentage of students achieving various Mathematics competencies is provided in Table 8. Of the five competencies in Mathematics students did comparatively better in two competencies in all the surveys; these are basic number skills and four basic rules in arithmetic. Over 80 percent of the students achieved these competencies in 2003.
Compared to the results in 2002, the performance of the students significantly improved in four competencies. These are four basic rules in arithmetic, problem solving,
measurement unit, and geometric figures. Improvement in two competencies was
tremendous – it was 13 percentage points in problem solving and 15 percentage points in measurement unit.
11
Table 7. Competencies, test items and minimum levels for Mathematics
Competency Test items Minimum level
Basic numbers • Arrange four given numbers in ascending order
• Identify the largest from four given digits
Answer correctly any one of the items on the left.
Four basic rules
• An addition
• A subtraction
• A multiplication
• A division
• A simplification
Do the simplification correctly or any three of the four others
Problem solving
Four sums needing skills on
• Basic arithmetic operation
• Unitary method
• Percentage
• Graph
Answer correctly any two of the items on the left
Measurement units
• Convert 5 hours and 25 minutes to seconds
• Find the length of a pencil
Answer correctly any one of the items on the left
Geometric figures
• Find the number of triangles and rectangles in a figure
• Identify four geometric figures
Answer correctly any one of the items on the left
Table 8. Percentage of students achieving Mathematics competencies by year
Year Level of significance
Competencies
2000 2001 2002 2003 2000 vs. 2001 2001 vs. 2002 2002 vs. 2003
Basic number 78.8 76.9 78.9 82.0 ns ns ns
Four basic rules 82.0 73.2 75.8 84.0 p<0.01 ns p<0.001
Problem solving 39.4 30.2 36.2 49.2 p<0.05 ns p<0.001
Measurement unit 46.9 46.7 44.0 59.1 ns ns p<0.001
Geometric figures 52.8 51.5 59.7 70.1 ns p<0.01 p<0.001
All five 23.6 21.7 16.1 27.2 ns p<0.05 p<0.001
ns = Not significant at p=0.05
No gender difference was found in any of the Mathematics competencies in first two surveys. However in 2002, boys outperformed the girls in four competencies – four basic arithmetical rules, problem solving, measurement unit and geometric figures. On the other hand, in 2003, gender difference in four basic rules in arithmetic and geometric figures disappeared, but it appeared in case of basic number skills.
Of the four basic rules in arithmetic, students did best in addition followed by subtraction, multiplication and division (Annex 6). In 2003, 87.6 percent of the students made correct answer in addition, 80.5 percent in subtraction, 69.8 percent in multiplication and 52.8 percent in division. Over 69 percent of the students correctly answered the given simplification. Mathematical problem solving was found as the hardest competency in the
assessments. It had four components – items on basic arithmetic operation, unitary method, percentage and understanding graph were there in the test. Students performed poorly in unitary method in all the four surveys. Last survey shows that less than a fifth of the students could correctly do the arithmetic needing skills in unitary method.
Students achieving all the five competencies in Mathematics significantly decreased from 23.6 percent in 2000 to 16.1 percent in 2002 (p<0.01), however, it again increased significantly to 27.2 percent in 2003 (p<0.001). The boys lagged behind the girls in this regard in all the surveys. The gender gap was increasing over the period from 2000 to 2002, however it reduced in 2003.
22.3 25.8
19.9 24.9
10.9
26.3 24.4
32.9
2000 2001 2002 2003
Year
Figure 4 Percentage of students achieving all five competencies in Mathematics by year and sex
Girls Boys
Achievement in Social Studies competencies
Students’ learning achievement in six Social Studies competencies was assessed. These are duties as family member, duties as member of society, duties as citizen of Bangladesh, kno wledge about the country, manners with other people, and knowledge about children of other countries. Thirteen multiple-choice question items were placed in the test instrument to assess the above- mentioned six competencies. Table 9 gives summary of the competencies, test items, and minimum level of qualifying the competencies in Social Studies.
Percentage of students achieving social science competencies in various years is provided in Table 10. The students of 2003 showed very good performance in four competencies;
these are duties as family members, duties as member of society, duties as citizen of Bangladesh, and manners with other people. Over 80 percent of the students achieved all these competencies. Less than half of the students achieved the other two competencies.
No variation was observed among the performances of the students of four cohorts in three competencies; these are duties as family members, duties as member of society, and knowledge about the country. Indicating that the students of all four years performed equally in these competencies.
13
Table 9. Competencies, test items and minimum levels in Social Studies
Competency Test items Minimum level
Duties as family member
• How a family becomes a happy family
• Responsibility of family members
Answer correctly any one of the items on the left
Duties as a member of the society
• Responsibility as a member of the society
• Why one should not play radio/TV loudly
Answer correctly any one of the items on the left
Duties as citizen of Bangladesh
• Responsibility as a citizen
• Eligibility to vote in national elections
Answer correctly any one of the items on the left
Knowledge about the country
• Independence day
• Major transportation system
• Place of highest rainfall
Answer correctly any two of the items on the left
Manners with other people
• Right manners with teachers
• Right manners with younger siblings
Answer correctly any one of the items on the left
Knowledge about children of other countries
• Main food of the children of Maldives
• Popular games in Nepal
Answer correctly any one of the items on the left
Table 10. Percentage of students achieving Social Studies competencies by year
Year Level of significance
Competencies
2000 2001 2002 2003 ’00 vs. ’01 ’01vs. ’02 ’02 vs. ’03
Duties as family members 80.0 75.4 79.3 81.1 ns ns ns
Duties as member of society 86.3 84.4 85.8 87.5 ns ns ns
Duties as citizen of Bangladesh 66.8 67.1 93.7 80.5 ns p<0.001 p<0.001
Knowledge about the country 51.6 46.3 41.1 45.9 ns ns ns
Manners with other people 84.6 83.5 77.6 83.8 ns p<0.05 p<0.01 Children of other countries 48.6 51.6 45.0 49.9 ns p<0.05 ns
All five 26.2 23.6 16.1 21.0 ns p<0.01 p<0.05
ns = Not significant at p=0.05
The boys outperformed the girls in only one social science competency in 2000, which increased to two in 2001 and to three in 2002. Such difference was only in one competency in 2003; this was ‘duties as member of society’.
Proportion of students achieving all social science competencies significantly reduced from 26.2 percent in 2000 to 16.1 percent in 2002 (p<0.01), however, it increased to 21 percent in 2003 (p<0.05). Gender gap in this regard was also increased during 2000-2002, however the gap reduced in 2003. The girls were lagging behind the boys in all four surveys – 4.5 percentage points in 2000, 7.8 percentage points in 2001, 12.6 percentage points in 2002 and 5.7 percentage points in 2003. A good sign is that the gender gap has reduced during last one year.
24.6 29.1
20.9 28.7
11.8 24.4
19.1 24.8
2000 2001 2002 2003
Year
Figure 5 Percentage of students achieving all six competencies in Social Studies by year and sex
Girls Boys
Achievement of General Science competencies
Nine General Science competencies were assessed, five of whom are related to physical and environmental health and four on science and technology. The competencies are:
understand the importance of good health, know physical and environmental health systems, understand the importance of balanced diet, know the preventive measures of common diseases, have information collection ability, observation skills on natural objects, ability in scientific investigation, identification of cause and effect relationship, and knowledge on science and technology in everyday life. Two multiple-choice questions were pleased for assessing each of the competencies, totalling 18 for the subject. Table 11 provides the competencies, test items, and minimum level for qualifying the competencies of General Science.
The students did well in all the nine General Science competencies in 2003. At least 70 percent of the students achieved each of the competencies. Statistically significant improvement from 2002 to 2003 was noticed in four competencies; these are importance of balance diet, prevention of common diseases, cause and effect relationship and science and technology in everyday life. Students of four different cohorts performed equally in rest of the competencies.
Although the boys outperformed the girls in five competencies in 2002, but such a situation was observed only in one competency in 2003. This was ‘information collection ability’. It was surprising to see that the boys of all four cohorts surpassed their counterpart girls in this competency.
No significant variation was observed among the students of first three cohorts in the achievement of all nine competencies in General Science. However, a big improvement (10.2 percentage points) was observed in 2003 in this regard. The girls lagged behind the girls in all the surveys and such difference was increasing up to the year 2002. The gender gap was 5.9 percentage points in 2002, which reduced to 4.4 percentage points in 2003.
15
Table 11. Competencies, test items and minimum levels for General Science
Competency Test items Minimum level
Knowledge about importance of good health
• How good health is achieved
• Why one takes carbohydrate
Answer correctly any of the items on the left Knowledge about
physical and
environmental health
• Which tube well water is safe
• How diarrhoea spreads
Answer correctly any of the items on the left Knowledge of balanced
diet
• What is a balanced diet
• Why should adolescents take extra food
Answer correctly any of the items on the left Knowledge about
prevention of common illnesses
• Transmission of worms
• Skin diseases
Answer correctly any of the items on the left Information collection
ability
• What is the fastest mass media
• Highest and lowest temperatures during summer
Answer correctly any of the items on the left Observation skills • Which tree has no branch
• Plant without a flower
Answer correctly any of the items on the left Scientific investigation • Identification of preventive measures for
given illness
• Identify effects of over population
Answer correctly any of the items on the left Cause and effect
relationship
• Energy that causes a boiling kettle lid to move up
• Energy which drives a bullock cart
Answer correctly any of the items on the left Everyday science • What is information communication
• What are modern agricultural technologies
Answer correctly any of the items on the left
Table 12. Percentage of students achieving General Science competencies by year
Year Level of significance
Competencies
2000 2001 2002 2003 ’00 vs. ’01 ’01 vs. ’02 ’02 vs. ’03
Importance of good health 89.7 91.5 90.8 91.3 ns ns ns
Physical and environmental health systems
84.3 84.4 85.6 86.9 ns ns ns
Importance of balanced diet 67.7 70.1 70.0 80.7 ns ns p<0.001 Prevention of common
diseases
61.7 55.6 54.4 70.1 ns ns p<0.001
Information collection ability 83.4 81.1 86.4 88.4 ns p<0.05 ns Observation skills on natural
objects
79.0 77.3 76.6 79.1 ns ns ns
Scientific investigation skills 64.9 64.3 66.9 71.4 ns ns ns Cause and effect relationship 70.9 61.1 63.3 76.2 p<0.01 ns p<0.001 Science and technology in
everyday life
58.1 72.8 73.9 79.1 p<0.001 ns p<0.05
All nine 22.8 20.3 20.0 30.2 ns ns p<0.001
ns = Not significant p=0.05
22.2 23.8
19.5 22.1
18 23.9
28.7 33.1
2000 2001 2002 2003
Year
Figure 6 Percentage of students achieving all General Science competencies by year and sex
Girls Boys
Achievement in Religious Studies
Only one competency was assessed in religious studies. This is knowledge on life history of prophet Mohammed (SM) or the preachers of own religion. The students were asked to write five sentences on any one of the following: Mohammad (SM), Jesus Christ, Goutam Buddha and Shree Ramakrishna. However, correctly writing three sentences about any one of them was the minimum requirement for achieving this competency.
Performance of the students in this competency decreased from 31.7 percent in 2000 to 24.4 percent in 2002, however, it significantly increased to 33 percent in 2003. The boys outperformed the girls in this competency in 2001 and 2002, but both groups performed equally in 2003 (Annex 10).
Table 13. Percentage of students achieving a competency in Religious Studies by year
Year Level of significance
Competency
2000 2001 2002 2003 ’00 vs. ’01 ’01 vs. ’02 ’02 vs. ’03 Knowledge on life history of
prophet Mohammed (SM) or the preachers of own religion
31.7 31.2 24.4 33.0 ns p<0.05 p<0.001
Overall Learning Achievement
Performances of the students in each of the competencies assessed are presented in the above sections. The following sections provide students performances considering all the competencies together.
Classification of the competencies
The competencies were classified into four categories according to the performance of the students. These are Very Difficult, Difficult, Easy and Very Easy. The followings are the definitions of this classification.
17
Very difficult: If less than 40% of the students attain a particular competency (the level of achievement is ‘poor’);
Difficult: If 40–59.9% of the students attain a particular competency (the level of achievement is ‘mediocre’);
Easy: If 60–79.9% of the students attain a particular competency (the level of achievement is ‘satisfactory’);
Very easy: If 80% or more students attain a particular competency (the level of achievement is ‘excellent’).
Classification of the competencies according to the performance of the students is provided in Annexes 11 to 14 – these shows improvement in the performance of the students over the period. For instance, in 2000, the students did ‘excellent’ in 8 competencies, ‘satisfactory’ in 11, ‘mediocre’ in 5, and ‘poor’ in 3 competencies.
However, the survey of 2001 and 2002 show that the students did ‘excellent’ in 6 competencies, ‘satisfactory’ in 13, ‘mediocre’ in 5, and ‘poor’ in 3 competencies. On the other hand, the students of 2003 did ‘excellent’ in 13 competencies, ‘satisfactory’ in 8,
‘mediocre’ in 5, and ‘poor’ in only one competency.
The analyses show that the students of BRAC Non- formal Primary Education remain
‘poor’ in the competency under the religious studies after completing the full course. This was found to be the hardest competency for them to achieve.
The students of all the four cohorts showed ‘excellent’ performance in the following five competencies.
• Listening in Bangla
• Duties as member of the society
• Importance of good health
• Physical and environmental health systems
• Information collection ability
It was observed that BRAC NFPE students were weaker mostly in the competencies in Mathematics, writing English, and religious studies, however they made improvement in most of these areas in 2003 except the religious studies competency.
Achievement of all competencies
Percentage of students achieving all the competencies by subject, sex and year is provided in Table 14. Highest proportion of students achieving all the competencies was in Bangla in all the surveys. The position of English was second. Other subjects obtained no consistent position. The improvement of the situation from the year 2002 to 2003 was tremendous – 10 percentage points in Bangla, 13.8 percentage points in English, 11.1 percentage points in Mathematics, 4.9 percentage points in Social Science and 10.2 percentage points in General Science. Similar level of improvement was noticed for both boys and girls when data were analysed by sex. It can be seen that there was a downward trend in some cases up to the year 2002, however the situation improved in 2003.
Table 14. Percentage of students achieving all the competencies by subject and sex
Boys Girls Both
Subject
2000 2001 2002 2003 2000 2001 2002 2003 2000 2001 2002 2003 Bangla 51.6 58.9 53.1 57.4 45.1 48.3 45.0 58.2 47.5 52.0 47.8 57.9 English 22.5 34.4 29.7 37.7 28.0 28.0 27.5 44.1 26.0 30.3 28.2 42.0 Mathematics 25.8 24.9 26.3 32.9 22.3 19.9 10.9 24.4 23.6 21.7 16.1 27.2 Social Studies 29.1 28.7 24.4 24.8 24.6 20.9 11.8 19.1 26.2 23.6 16.1 21.0 General Science 23.6 22.0 23.9 33.1 22.3 19.4 18.0 28.7 22.8 20.3 20.0 30.2
Percentage of students achieving all the 27 competencies by year and sex is provided in Figure 7. Overall performance in the first two surveys was similar and again no variation was found in the performance of last two surveys. However, a significant deterioration was noticed between second and third surveys. On average, 8.5 percent of the students achieved all the 27 competencies in 2000, it was 8.1 percent in 2001, 5.2 percent in 2002, and 5.5 percent in 2003. The highest gender variation favouring boys was observed in 2002, however it reduced in the following year.
8.6 8.1
2.8 5.1
8.2 8.1 9.6
6.3
8.5 8.1
5.2 5.5
Girls Boys Both
Year
Figure 7 Percentage of students achieving all 27 competencies by year and sex
2000 2001 2002 2003
Mean number of competencies achieved
Unlike above findings, the mean number of competencies achieved by the students was mostly similar in first three years, which improved in 2003. On average, the students achieved 18.1 competencies in 2000, 17.9 in 2001, 18.2 in 2002, and 19.9 in 2003. The students altogether achieved 67 percent of the competencies in 2000, however it improved to 73.7 percent in 2003. Mean number of competencies achieved was less for girls than boys in all four surveys. The median of the number of competencies achieved was also increased over the period. The median was 18 in 2000 and 2001, 19 in 2002, and 21 in 2003. This means that a half of the students achieved more than 18 competencies in 2000. On the other hand, half of the students achieved 21 or more number of competencies in 2003.
19
Table 15. Some basic statistics on number of competencies achieved by the students
Year Sex Mean Median Standard deviation Coefficient of variation 2000 Boys
Girls Both
18.7 17.8 18.1
18.5 18.0 18.0
5.2 5.8 5.6
27.8 32.6 30.9 2001 Boys
Girls Both
18.8 17.4 17.9
19.0 17.0 18.0
5.2 5.4 5.3
27.7 31.0 29.6 2002 Boys
Girls Both
19.6 17.5 18.2
20.0 18.0 19.0
4.9 5.1 5.1
25.0 29.1 28.0 2003 Boys
Girls Both
20.2 19.7 19.9
21.0 21.0 21.0
4.6 5.0 4.8
22.8 25.4 24.1
No gender difference was found in the mean number of competencies achieved in 2000, however, in 2001 and 2002, the boys outperformed the girls (Annex 15). Equal performance of the boys and the girls was shown again in 2003.
Mean number of correctly answering items
Table 16 provides mean number of correctly answering items in various subjects by year of survey. The students did best in Bangla in all four surveys, followed by English. At the aggregate level, of the 64 items the mean was 36 in 2000, 33.4 in 2001, 34.8 in 2002, and 38.3 in 2003. Otherwise, the students on an average correctly answered less than 60 percent of the test items. The situation in Bangla and English were better than the aggregate performance, however, it was lower in three subjects viz., Mathematics, Social Studies and General Science.
Table 16. Mean number of correctly answering items by subject and year
2000 2001 2002 2003
Subject Number of
question
items Mean % Mean % Mean % Mean %
Bangla 10 7.0 70.0 7.0 70.0 7.1 71.0 7.4 74.0
English 7 4.3 61.4 4.1 58.6 4.5 64.3 4.8 68.6
Mathematics 15 7.4 49.3 6.4 42.7 7.0 46.7 8.1 54.0
Social Studies 13 7.1 54.6 6.4 49.2 6.6 50.8 7.2 53.4
General Science 18 9.6 53.3 9.1 50.6 9.4 52.2 10.4 57.8
All 64* 36.0 56.3 33.4 52.2 34.8 54.4 38.3 59.8
* Includes one competency on Religious Studies
There was no gender difference in 2000 in the mean number of correctly answering items. The boys surpassed the girls afterwards. In 2003, on average, the boys correctly answered 39.3 items and the girls 37.8 items (p<0.05).
School level analysis
Earlier sections provided information considering student as unit of analysis, however, this section analysed data considering school as unit. This helps understanding how far the achievement of the students varied from one school to another. A wide variation was observed in the performance of the schools in 2000, however it reduced over time. For instance, the co-efficient of variation was 26.4 percent in 2000, which reduced to 18.2 percent in 2001, 17.8 percent in 2002 and 15.0 percent in 2003 (Table 17).
Table 17. School level analysis: some basic statistics of mean number of competencies achieved Year Number
of schools
Minimum Maximum Range Mean Standard
deviation
Co-efficient of variation
2000 26 9.4 26.7 17.3 18.2 4.8 26.4
2001 30 12.8 23.9 11.1 18.1 3.3 18.2
2002 30 10.4 23.3 12.9 18.5 3.3 17.8
2003 62 14.1 26.3 12.1 20.0 3.0 15.0
Performance according to taxonomic class level of items
The question items put in the test instruments were classified according to taxonomic class level. Of the 64 items in the test, 45 are of knowledge level and 19 are of understanding level. The students of BRAC schools did better in the knowledge level items than the understanding level items. Interestingly, the performance of the students improved in both the areas over the period.
Table 18. Performance of the students according to the taxonomic class level of items
2000 2001 2002 2003
Taxonomic class Number
of items Mean % Mean % Mean % Mean %
Knowledge 45 26.8 59.6 25.3 56.2 26.5 58.9 28.6 63.6
Understanding 19 8.9 46.8 8.0 42.1 8.3 43.7 9.7 51.1
Highlights of the findings
Achievement of competencies of the students of BRAC NFPE, after completing five- year cycle of primary education, is presented in this report. The students of four cohorts were assessed through a nationally standardised test instrument developed for the Education Watch 2000. These students completed their primary schooling between 2000 and 2003.
They are the students of second to fifth batches after shifting from three years to four years programme. The tests were taken immediate before the end of respective academic year. Following are the highlights of the assessments.
Overall performance of the NFPE students increased over time. This can be shown in
21
over time – such increment was observed in most of the competencies. This ultimately resulted in the mean number of competencies achieved. Of the 27 competencies considered for the test, the students of each batch achieved about 18 competencies during 2000 to 2002, however the mean jumped up to 19.9 in 2003. In other words, the first three assessed groups achieved two-thirds of the competencies, but the fourth group achieved 73.7 percent of the competencies.
Again, the mean number of items correctly answering by the students also increased over the period. Of the 64 items in the test, the students correctly answered 36 items in 2000, which reduced to 33.4 in 2001, and then increased to 34.8 in 2002 and to 38.3 in 2003.
These showed that none of the groups could correctly answer more than 60 percent of the items. The first three assessments showed that the students of BRAC schools were weaker mostly in Mathematics, Social Science and General Science, however the performance in these areas also started to increase recently.
The students of recent years are getting more homogeneous than the previous years. This is a good sign in respect to equality in performance of the students. Analysis of coefficient of variation of the students performance in terms of competencies achievement and number of correct items reduced over the period. When the analysis was done separately for boys and girls, similar trend was observed. However, the boys were found more homogeneous than the girls in all the surveys.
Inter-school variation reduced significantly. The Education Watch study observed that school- to-school variation in formal schools was less than that of the non- formal schools.
This is because the non- formal schools are operated by various different organisations.
The four assessments done on the BRAC school graduates showed that such variation is reducing over the period.
Gender difference in achievement decreased. Earlier assessments showed that gender difference in learning achievement favouring the boys was increasing over time.
However, it turned to be reduced in 2003. Competency wise analysis showed that the boys did better than the girls in three competencies in 2000, which increased to seven in 2001 and to 14 in 2002. However in 2003, such gap was observed in five competencies only.
Performance of the students of BRAC NFPE at the end of primary cycle showed that the programme is getting better day-by-day. A downward slop was observed in the performance of the students in various subjects during first three years. However the situation improved much in 2003. Probably the programme management did not take the findings seriously as it took after the third survey. At that time, long meeting between the programme management and the research team was held which helped the management to understand the areas of poor performance. The findings of the study were also presented in a regional managers meeting. The regional managers also disseminated the findings at team level. Moreover, the quality assurance specialists and the monitoring section of BEP had their drive on the issue of quality improvement. Now, it is important to keep this trend on. A collective effort of the teachers, programme organisers and the management is needed in this regard.
Annex 1. Competencies tested under this study
Subject area Competencies
Bangla Reading skills
Writing skills Listening skills
English Reading skills
Writing skills Listening skills Mathematics Basic number skills
Four basic rules of arithmetic Problem solving
Measurement units
Identification of geometric figures Social Science Duties as family member
Duties as member of society Duties as citizen of Bangladesh Know about the country
Manners with persons of various relationship Know about the children of other countries General Science Importance of good health
Physical and environmental health systems Importance of balanced diet
Prevention of common diseases Information collection ability Observation skills on natural objects Scientific investigation skills
Identification of cause and effect relationship Science and technology in everyday life
Religious Studies Life sketch of prophet Mohammed (SM) or the preachers of own religion
Annex 2. Percentage of students achieving Bangla competencies by year and sex Year
Competencies
2000 2001 2002 2003
Reading skills Girls
Boys Significance
67.4 76.9 p<0.05
63.0 74.6 p<0.01
69.2 83.7 p<0.001
77.7 80.6 ns Writing skills
Girls Boys Significance
73.1 71.4 ns
68.2 75.1 ns
61.6 64.6 ns
73.6 74.3 ns Listening skills
Girls Boys Significance
81.7 84.1 ns
88.6 93.8 ns
83.4 88.5 ns
90.6 88.0 ns
23
Annex 3. Percentage of students made correct answers to various items on writing skills in Bangla by year
Year Items
2000 2001 2002 2003
Description of a given scenery 71.8 61.3 58.2 74.3
Description of own home 78.6 77.7 75.0 58.6
Fill out a form 96.1 97.4 95.7 96.4
Writing application to teacher Date
Salutatio n Message Closing
46.2 60.3 77.5 62.5
32.8 79.5 79.6 66.4
30.0 75.6 50.6 57.1
43.9 91.1 88.8 76.3
Annex 4. Percentage of students achieving English competencies by year and sex Year
Competencies
2000 2001 2002 2003
Reading skills Girls
Boys Significance
73.7 75.8 ns
65.4 72.2 ns
74.4 79.9 ns
80.9 79.2 ns Writing skills
Girls Boys Significance
41.1 35.7 ns
35.5 39.2 ns
33.2 38.8 ns
54.0 49.5 ns Listening skills
Girls Boys Significance
68.6 67.0 ns
73.6 85.6 p<0.001
79.1 81.3 ns
86.2 81.7 p<0.05
Annex 5. Percentage of students achieving Mathematics competencies by year and sex Year
Competencies
2000 2001 2002 2003
Basic number Girls
Boys Significance
77.7 80.8 ns
76.3 78.0 ns
78.7 79.4 ns
80.2 85.4 p<0.05 Four basic rules
Girls Boys Significance
81.1 83.5 ns
70.6 78.0 ns
73.0 81.3 p<0.05
82.8 86.6 ns Problem solving
Girls Boys Significance
37.1 43.4 ns
30.8 32.1 ns
32.2 44.0 p<0.01
45.7 56.0 p<0.01 Measurement unit
Girls Boys Significance
45.7 48.9 ns
45.5 48.8 ns
39.8 52.2 p<0.01
56.6 64.1 p<0.05 Geometric figures
Girls Boys Significance
52.6 53.3 ns
49.8 54.5 ns
55.5 67.9 p<0.01
69.2 72.0 ns
Annex 6. Percentage of students made correct answers to the items under ‘basic four rules of arithmetic’ by year
Year Items
2000 2001 2002 2003
Addition 87.9 86.4 89.1 87.6
Subtraction 80.3 77.0 74.2 80.5
Multiplication 69.6 65.0 66.3 69.8
Division 45.6 31.6 38.3 52.8
Simplification 60.0 56.0 57.2 69.4
Annex 7. Percentage of students made correct answers to the items under ‘mathematical problem solving’ by year
Year Items
2000 2001 2002 2003
Basic arithmetic operation 53.5 37.8 36.7 42.6
Unitary method 22.5 8.1 2.5 18.5
Percentage 29.9 19.5 40.0 55.0
Graph 38.0 32.8 33.0 39.7