©Daffodil International University i | P a g e
Internship report on “Financial Performance Analysis Of Lira Group Ltd ”
Submitted To Sayed Farrukh Ahmed
Assistant Professor
Department of Business Administration Faculty of Business& Entrepreneurship
Daffodil International University
Submitted By MD Mustafijur Rahman
ID: 181-11-5852 Batch 49
thBBA Program
Department of Business Administration Faculty of Business& Entrepreneurship
Daffodil International University
Date of Submission: 07/06/2022
©Daffodil International University ii | P a g e
Litter of Transmittal
Sayed Farrukh Ahamed Assistant Professor
Department of Business Administration Faculty of Business& Entrepreneurship Daffodil International University
Subject: Submission of Internship Report on Financial performance Analysis of Lira Group Ltd Dear Sir,
With due Respect and humble to state that it’s my pleasure to submit this Internship Report on
“Financial performance Analysis of Lira Group Ltd” to you. While preparing this report, I tried my best to follow the instructions that you have given me. This report is prepared for the fulfillment of the requirement of the BBA Program. This Internship Report has been extremely challenging, interesting and rewarding experience to me. I would like to express my deepest gratitude to you for providing me such an opportunity.
I shall be highly encouraged if you are kind enough to receive this report. Thank you for your consideration and collaboration.
Sincerely yours,
MD Mustafijur Rahman ID: 181-11-5852
Batch 49th BBA Program
Department of Business Administration Faculty of Business& Entrepreneurship Daffodil International University
©Daffodil International University iii | P a g e
Certificate of Approval
I am pleased to certify that MD Mustafijur Rahman, ID: 181-11-5852 Department of Business Administration(Major Accounting) a regular student of Daffodil International University of BBA program has completed the internship report titled “Financial Performance Analysis Lira Group Ltd”, under my supervision. I am pleased to state that he has worked hard in preparing this report and he has been able to present a good picture of the concerned organization. The data and findings presented in the report seem to be authentic.
MD Mustafijur Rahman bears a strong moral character and a very pleasing personality. It has indeed been a great pleasure working with him. I wish his every success in life.
Signature of Supervisor
Sayed Farrukh Ahmed Assistant Professor
Department of Business Administration Faculty of Business& Entrepreneurship Daffodil International University
©Daffodil International University iv | P a g e
Declaration
I am MD Mustafijur Rahman student of BBA program Hereby Declared that the Internship Program title the Financial Performance of Lira Group Ltd is prepared by me under the supervision Sayed Farrukh Ahamed sir, Assistant Professor Department of Business Administration daffodil International University, after the completion of internship period of Lira Group Ltd (Head Office) at Gulshan-1, Dhaka.
I also declared that, the report is my genuine work of my experience and prepared for academic purpose which is part of my BBA program.
MD Mustafijur Rahman ID: 181-11-5852
Department of Business Administration Daffodil International University
©Daffodil International University v | P a g e
Acknowledgement
At the start, I would like to pay my humble thankfulness to the “Almighty” enabling me to work hard under density. However, the space complex does not allow us to mention everyone separately. It provides me huge delight to thank countless people for their sincere collaboration and support who have contributed legitimately and by implication in preparing this report.
I convey my deepest appreciations to my respectable Supervisor Sayed Farrukh Ahmed, Assistant Professor, Department of Business Administration, Daffodil International University, for this continuous guidance and whole-hearted supervision and supporting me to prepare this report properly. I acknowledge him on behalf of being a continuous source of motivation.
I would like to thanks Waliur Rahman, General Manager of Lira Group Ltd, Gulshan-1,Dhaka.
For generous me a chance to effort as an internee for three month of internship.
Finally, I would like to give thanks to all of them who have contributed through their suggestions and valuable time to prepare this internship report in a comprehensive way. All of the employees and responsible persons of “LIRA Group of Industries” for providing me necessary support whenever required. Without their contribution, it would not be possible for me to conduct this project work.
©Daffodil International University vi | P a g e
Executive Summary
The Internship report is a part of BBA program. I have made these report about “Financial Performance Analysis” of Lira Group Ltd. I worked head office of Lira Group Ltd at Gulshan-1 in Commercial department. As an intern I had the opportunities to do different types of task about financial section like expenditure, revenue, monthly VAT etc.
In the organization they are very helpful to me. The employee of these Organization always support me for working .I have learned how to work in corporate life and how to manage overall task in the suitable time. Specially thanks General Manager of these organization for teaches and support me.
I have worked in Accounts section that’s why my basic task was creating the overall expense and revenue report then the report submitted to accountants and he checked these this. This practical knowledge will help me in my real life.
This report shows the overall financial performance. In the primary part of the report, I present the subject. Then I deliberate the heading of the report, objective, methodology and limitations of the report then, I talk over about the Lira Group Ltd.
However, I've done a large number of money related calculating, decided their financial reports and from my working ability I conjointly accumulated information concerning their body technique for overseeing totally various issues. When preparing the full report, I had a few discoveries identifying with the money related Performance Analysis of Lira Group Ltd confined.
In chapter 3, I discuss about the ratio analysis of Lira Group Ltd through the financial statement of Lira Group Ltd
At last Chapter, I have given findings, Recommendations, Conclusion, and Reference.
©Daffodil International University vii | P a g e
Table of Content
Chapter No.
Topics Page No.
Letter of Transmittal ii
Certificate of Approval iii
Declaration iv
Acknowledgement v
Executive Summery vi
Table of Content vii
Chapter-1
Introduction
1.1 Introduction 1
1.2 Origin of the study 1
1.3 Objectives of the study 2
1.4 Scope of the study 2
1.5 Methodology of the study 2
1.6 Limitation of the study 3
Chapter-2
Profile Of Lira Group Ltd
2.1 Overview of Lira Group 4
2.2 Historical Background 4
2.3 Capabilities of organization 5
2.4 Objectives 5
2.5 Mission 5
2.6 Vision 6
2.7 Major Functional division of this organization 6
Chapter-3
Financial Performance Analysis of Lira Group Ltd
3.1 Financial Statement Analysis 7
3.2 Financial Statements Overview 7
3.3 Ratio analysis of JBL from (2014-2018) 8-35
Chapter-4
Findings, Recommendation ,Conclusion
4.1 Findings 36
4.2 Recommendation 37
4.3 Conclusions 37
©Daffodil International University 1 | P a g e
1.1 Introduction
Lira Group is one of the market leaders in the plastic industries in Bangladesh with trust of the people and quality of products, since 1965. These company has five factories that maintaining full compliance in regulating health and safety to all worker and employees.
The international standard product are made by long working expert that are manufacturing high quality products. Industrial mega construction project are done with professional plastics products over 50years. This organization has reliable delivery status from beginning. All of the employees manage operation for on time delivery service.
These company use the modern machines and all of the employees have excellent working skills. It’s the high quality enterprise which integrates researching and developing manufacturing trading and marketing. This company leading top 3 manufacturer of plastics pipe and fitting. Main products are hdpe pipe and fitting, upvc, Thread pipes, household items, water pump. They are hardworking determination in quality of their products.
1.2 Origin of Study
The Internship report is needed is a fundamental requirement for the fulfillment of the Bachelor of Business Administration (BBA) course Curriculum of Daffodil International University. For this internship I was appointed at Lira Group Ltd by the approval of the university. The topic of this internship report is “Financial Performance analysis of Lira Group Ltd” which is selected by the academic supervisor, Sayed Farrukh Ahmed. With proper guidance of academic supervisor and organizational supervisors I have prepared this report. Such all application is made conceivable through Internship. The internal supervisor assigned me educate me help me to prepare this internship report
©Daffodil International University 2 | P a g e
1.3 Objective of the Study
The main objectives of the statement will be to introduce the financial analysis of Lira Group Ltd with satisfying necessity of BBA program. The objectives of the study are as follow-
To know historical background of Lira Group Limited.
To evaluate the financial performance of Lira Group Limited of various years.
To commend action that may be essential to restructure the financial performance analysis of Lira Group Limited.
1.4 Scope of the Study
The study of the report gives great information about financial analysis of Lira group ltd. I have collected all of financial information and create a report. The report covers the foundation, capacities and the unfamiliar trade arrangement. It organization of my perceptions and on the job experience through the training period. The internship report joins the financial grade and various features of ratio analysis of the organization
1.5 Methodology
To make this internship report I have need to collect data from the organization and online platform. There have two types of data such primary data and the secondary data
The primary data collected from the organizations employee and the secondary data collected from various report and online platform.
Primary Sources
Practical Work Experience from working
Face to face discussion and conversing with respectable officers and office stuff
Direct observation in accounts section
All of the financial report checked and collected the necessary data
Secondary sources
Annual Report of Lira Group Ltd
Official website of this organization
Audit report of the organization
Different report, articles and academic books that’s are related of financial information
©Daffodil International University 3 | P a g e
1.6 Limitation of study
There have several limitation, some limitation are given below
This organization has restriction to share their data so it was difficult to me to collect data for prepared these report
Financial department are large size that’s why it was very hard to make this report
The overall information are not posted on their website
It was my first corporate internship so lack of knowledge and experience
To face those problem try my best to prepared this report well
©Daffodil International University 4 | P a g e
2.1 Overview of Lira Group Ltd
Lira Group is one of the market leaders in the plastic industry in Bangladesh with its history of pride, trust of the people and quality of products. The company’s aim to provide consumers with uPVC Pipes & Fittings, Plastic Household & Furniture, uPVC Doors
& Ceiling, Water Pumps & Motors and many other related products for their needs and convenience.
They accomplish this by listening to consumer’s needs and wants and translating this information into improved products that will gain their full satisfaction. They continuously develop a comprehensive line of products for different purposes and aims to become the best manufacturing company in this sector in Bangladesh, and soon globally.
2.2 Historical Background
This organization is established at 1965. There have 5factories and leads top 3 manufacturer in Bangladesh. Industrial Lira doors Ltd starts on 27th December 2015 In 2003 gov’t wants to go for privatization for these sector. In 2002 due to circulation of gov’t restriction and from the sense of responsibility Bari plastics was closed. After that one of the director of Bari plastics, Mr.K.M. Alamgir Iqbal started the business again with the products and adding some new products.
Now these company have organized and strategic market division more than 120 zone, 30area and 4 division. The factory situated at tongi, Gazipur and have 4depot located in Dhaka, Comilla, Chittagong and Bogra and have a plan for another depot at Faridpur/jessore region.
Before Present
©Daffodil International University 5 | P a g e
2.3 Capabilities of organization
Capabilities in products that customers can trust
Reliable to delivery in time
Updating products to customer need
Maintain the long term relationship with respected customer
Provide the best service with customer satisfaction
Using the best materials for production
2.4 Objectives of Lira Group Ltd
The key objectives for which the organization is recognized are as follows-
To continue, execute, attempt and through the substance of trading in all branches.
To guarantee ideal usage of every accessible asset.
To collect, derive or to increase business area.
To stay probably a best industry in Bangladesh regarding productivity and resource quality.
To accommodate safe –store vaults and the protected authority of resources of different types.
To create and open offices and branches to convey on all or any of the trading overseas and within the country delivered previous approval is attained from Bangladesh b.
To transport on business as producer, advertisers, entrepreneurs and representatives.
2.5 Mission
Provide excellent quality customer service. To create the reliable reference for supplying the requirement of the products. The intention to be in the top of this industry by providing the high quality products.
©Daffodil International University 6 | P a g e
2.6 Vision
The products of these organization are being used all over the country and globally soon.
All of the customer are permanent partners and the activity and the success will continue if the constructive interaction by them.
2.7 Major Functional division of this organization
Lira Group has been operating its business under the following major function areas
Functional Division
Supply
Chain/
Operation
Marketing
Human Resources Accounted
and Finance Sales and
Administr ation
Commercial Department
©Daffodil International University 7 | P a g e
3.1 Financial Statement Analysis
Financial Statements
Ratio Analysis
Trend Analysis
Common-size and Index Analysis
Current Assets Analysis
Current Liabilities Analysis
3.2 Financial Statements overview
Balance Sheet
A summary of a firm’s financial position on a given date that shows total assets = total liabilities + owners’ equity
Income Statement
A summary of a firm’s revenues and expenses over a specified period, ending with net income or loss for the period
©Daffodil International University 8 | P a g e
Balance sheet
LIRA POLYMER INDUSTRIES LIMITED Balance Sheet
As at 31 December, 2017-2020 (figure in lac)
2017 2018
2,019 2020
Particulars (BDT) (BDT)
(BDT) (BDT)
ASSETS:
Non-Current Assets
Fixed Assets at Cost 709 750
954 974
Less: Accumulated Depreciation 135 77
212 186
Net Fixed Assets (Written Down Value) 574 673
742 788
Current Assets 2,239 2,134
2,121 2,266
Cash & bank balance 102 101
99 104
Accounts Receivable 579 574
500 482
Inventories 379 275
389 394
Prepared Exp 122 120
35 44
Accum Tax prepared 36 43
46 41
Investment LT 977 977
967 978
Others Asstes 45 45
86 88
©Daffodil International University 9 | P a g e
TOTAL ASSETS 2,813 2,807
2,863 3009
SHAREHOLDERS' EQUITY AND LIABILITIES:
Shareholders' Equity: 235 280
694 709
Com. Stock 25 25
25 25
Paid up Capital 30 30
30 30
Retained Earnings 180 225
639 680
Non-Current Liabilities: 33 33
33 33
Long Term Debts 33 33
33 33
Current Liabilities: 2,545 2,494
2,137 2248
Bank Liabilities 1,804 1,846
1,566 1645
Income Tax Payable 83 93
124 128
Notes Payable 49 49
39 39
Accounts Payable 608 506
408 468
TOTAL SHAREHOLDERS' EQUITY AND LIABILITIES 2,813 2,807
2,863 3009
©Daffodil International University 10 | P a g e
Balance Sheet
DESHBONDU POLYMER LTD Balance Sheet
As at 31 December, 2017-2020(Figure in Lac)
2017 2018
2,019 2020
Particulars (BDT) (BDT) (BDT) (BDT)
ASSETS:
Non-Current Assets
Fixed Assets at Cost
750 785 780 789
Less: Accumulated Depreciation
123 10 99 107
Net Fixed Assets (Written Down Value)
627 675 681 682
Current Assets
2,190 2,136 2,121 2203
Cash & bank balance
102 101 99 104
Accounts Receivable
530 575 500 567
Inventories
379 275 389 396
Prepared Exp
122 120 35 43
Accum Tax prepared
36 43 46 49
Investment LT
977 977 967 671
Others Asstes
44 45 86 89
©Daffodil International University 11 | P a g e TOTAL ASSETS
2,817 2,811
2,802 3491
SHAREHOLDERS' EQUITY AND LIABILITIES:
Shareholders' Equity:
230
285
295
313
Com. Stock
35
35
35
35
Paid up Capital
25
25
25
25
Retained Earnings
170
225
235
245
Non-Current Liabilities:
42
32
28
23
Long Term Debts
33
33
33
33
Current Liabilities:
2,545 2,494
2,479 2598
Bank Liabilities
1,804
1,846
1,891
2026
Income Tax Payable
83
93
95
109
Notes Payable
49
49
85
91
Accounts Payable
608
506
408
397
TOTAL SHAREHOLDERS' EQUITY AND LIABILITIES 2,817
2,811 2,802 3491
©Daffodil International University 12 | P a g e
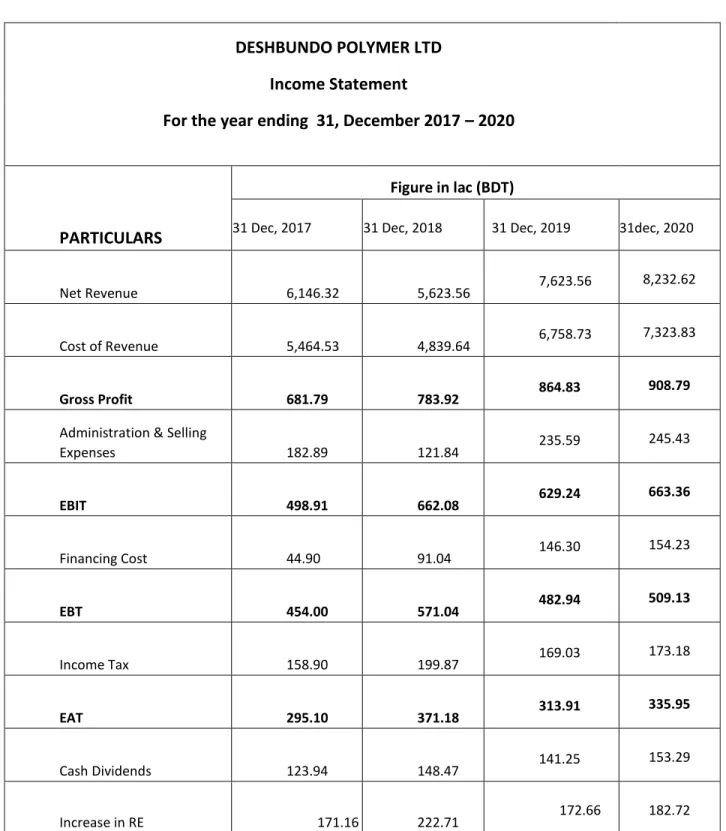
Income Statement
DESHBUNDO POLYMER LTD Income Statement
For the year ending 31, December 2017 – 2020
PARTICULARS
Figure in lac (BDT)
31 Dec, 2017 31 Dec, 2018 31 Dec, 2019 31dec, 2020
Net Revenue
6,146.32
5,623.56
7,623.56 8,232.62
Cost of Revenue
5,464.53
4,839.64
6,758.73 7,323.83
Gross Profit
681.79
783.92
864.83 908.79
Administration & Selling Expenses
182.89
121.84
235.59 245.43
EBIT
498.91
662.08
629.24 663.36
Financing Cost
44.90
91.04
146.30 154.23
EBT
454.00
571.04
482.94 509.13
Income Tax
158.90
199.87
169.03 173.18
EAT
295.10
371.18
313.91 335.95
Cash Dividends
123.94
148.47
141.25 153.29
Increase in RE 171.16
222.71 172.66 182.72
©Daffodil International University 13 | P a g e
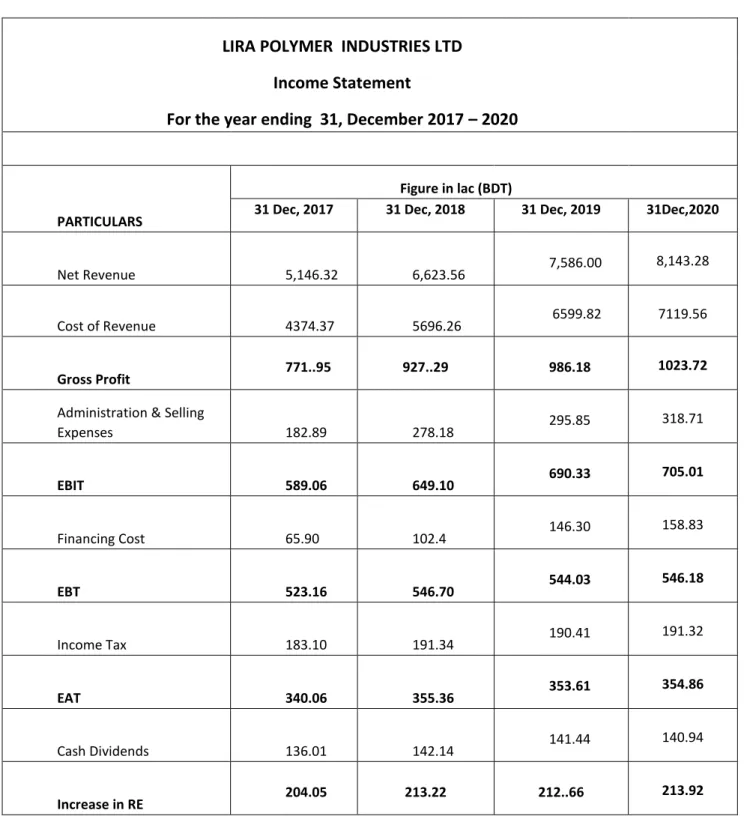
Income Statement
LIRA POLYMER INDUSTRIES LTD Income Statement
For the year ending 31, December 2017 – 2020
PARTICULARS
Figure in lac (BDT)
31 Dec, 2017 31 Dec, 2018 31 Dec, 2019 31Dec,2020
Net Revenue
5,146.32
6,623.56
7,586.00 8,143.28
Cost of Revenue
4374.37
5696.26 6599.82 7119.56
Gross Profit
771..95 927..29 986.18 1023.72
Administration & Selling Expenses
182.89
278.18
295.85 318.71
EBIT
589.06
649.10
690.33 705.01
Financing Cost
65.90
102.4
146.30 158.83
EBT
523.16
546.70
544.03 546.18
Income Tax
183.10
191.34
190.41 191.32
EAT 340.06
355.36
353.61 354.86
Cash Dividends
136.01
142.14
141.44 140.94
Increase in RE
204.05 213.22 212..66 213.92
©Daffodil International University 14 | P a g e
3.3 Financial Ratios Analysis
A Financial Ratio is an index that relates two accounting numbers and is obtained by dividing one number by the other.
3.4 External Comparisons and Sources of Industry Ratios
This involves comparing the ratios of one firm with those of similar firms or with industry averages.
Examples:
DESHBONDU POLYMER LTD And
LIRA POLYMER INDUSTRIES LTD Financial Ratios
©Daffodil International University 15 | P a g e
Coverage Ratios:
Coverage Ratios = EBIT/Interest Charge= 498.9/44.90= 11.11 tk
(Following a firm’s ability to cover interest charge)
Coverage Ratio Comparisons
Interest coverage Ratio
Year DPL LPIL
2017 11.11 8.93
2018 5.43 3.33
2019 4.30 4.71
2020 3.90 5.18
DPL has below average interest coverage relative to the LPIL average
Coverage Ratio trend Analysis Comparison
3.0 5.0 7.0 9.0 11.0
19X1 19X2 19X3
R atio V alu e
Analysis Year
Trend Analysis of Interest Coverage Ratio
BW
Industr
y
©Daffodil International University 16 | P a g e Liquidity Ratios
Current Assets/Current Liabilities =Tk, 2239/2545= -0.88 For DPL & LPIL December 31, 2017-20
Shows a firm’s not ability to cover its current liabilities with its current assets.
Liquidity Ratio Comparisons Current Ratio
Year DPL LPIL
2017 0.86 0.87
2019 0.88 0.85
2019 0.85 0.99
2020 0.87 0.96
DPL ratio is not stronger than the LPIL average
©Daffodil International University 17 | P a g e Liquidity Ratios
Balance Sheet Ratios Acid-Test (Quick)
=Current Assets – Inv/Current Liabilities= Tk, 2190 – 379 /, 2545 = =0.71 tk Shows a firm’s not ability to meet current liabilities with its most liquid assets.
For DPL & LPIL December 31, 2017 -2020
Liquidity Ratio Comparisons Acid-Test Ratio
Year DPL LIPI
2017 0.71 0.73
2018 0.74 0.74
2019 0.81 0.81
2020 0.86 0.83
DPL ratio is weaker than the LPIL average
Summary of the Liquidity Ratio Comparisons
Ratio DPL LPIL
Current 0.86 0.87
Acid-Test 0.71 0.73
Weak current ratio and weak acid-test ratio indicates a potential problem in the inventories account.
Note that this LPIL & DPL has a relatively Low level of inventories
©Daffodil International University 18 | P a g e
3.5 Summary of the Liquidity Trend Analyses
The current ratio for BW has been rising at the same time the acid-test ratio has been declining.
The current ratio for the industry has been rising slowly at the same time the acid-test ratio has been relatively stable.
This indicates that inventories are a significant problem for BW.
Financial Leverage Ratios=
Debt-to-Equity= Total Debt /Shareholders’ Equity= Tk 230/ 2578= .09 Show the extent to which the firm is financed by debt.
Financial Leverage Ratio Comparisons
0.5 0.8 1.0 1.3 1.5
19X1 19X2 19X3
R atio V alu e
Analysis Year Trend Analysis of Acid-Test Ratio
BW
Indust
ry
©Daffodil International University 19 | P a g e Debt-to-Equity Ratio
Year DPL LPIL
2017 .09 .09
2018 -11 .11
2019 .12 .32
2020 .13 .23
DLP has average debt utilization relative to the LPIL average
Financial Leverage Ratios:
Financial Leverage Ratios
Debt-to-Total-Assets= Total Debt/Total Assets = Tk 2578/Tk 2817= .91
Show the percentage of the firm’s assets that are supported by debt financing.
For DLP December 31, 2017 to 2020
Financial Leverage Ratio Comparisons
Debt-to-Total-Asset Ratio
Year DPL LPIL
2017 .92 .92
2018 .89 .90
2019 .89 .75
2020 .91 .88
DPL has average debt utilization relative to the LPIL average
©Daffodil International University 20 | P a g e Financial Leverage Ratios
Total Capitalization= Total Debt/Total Capitalization= 2578/1179= 2.19 tk (i.e., LT-Debt + Equity)
Show the relative importance of long-term debt to the long-term financing of the firm For DPL December 31, 2017 to 2020
Financial Leverage Ratio Comparisons
Total Capitalization Ratio
Year DPL LPIL
2017 2.19 2.18
2018 2.03 2.06
2019 1.33 1.66
2020 2.08 2.03
DPL has average long-term debt utilization relative to the LPIL average
Coverage Ratios
Interest Coverage= EBIT/Interest Charges= 498.1/44.90=11.11 Indicates a firm’s ability to cover interest charges.
For DPL December 31, 2017-20
Coverage Ratio Comparisons
Interest Coverage Ratio
Year DPL LPIL
2017 11.11 8.39
2018 7.27 6.34
2019 4.3 4.24
2020 5.87 5.45
DPL has above average interest coverage relative to the LPIL average
©Daffodil International University 21 | P a g e 3.6 Summary of the Coverage Trend Analysis
The interest coverage ratio for BW has been falling since 19X1. It has been below industry averages for the past two years.
This indicates that low earnings (EBIT) may be a potential problem for BW.
Note, we know that debt levels are in line with the industry averages
Activity Ratios
Receivable Turnover= Annual Net Credit Sales/Receivables= 5546.32/589= 9.42 (Assume all sales are credit sales.)
Indicates quality of receivables and how successful the firm is in its collections.
For DPL December 31, 2017 -2020
Avg Collection Period= Days in the Year/Receivable Turnover= 397/9.89= 40days For DPL December 31, 2017 to 2020
Average number of days that receivables are outstanding.
(RT in days)
0.5 0.8 1.0 1.3 1.5
19X1 19X2 19X3
R atio V alu e
Analysis Year
Trend Analysis of Acid-Test Ratio
BW
Indust
ry
©Daffodil International University 22 | P a g e Payable Turnover (PT)= Annual Credit Purchases/Accounts Payable= 2932/608=4.82 tk (Assume annual credit purchases =tk 2932.26)
For DPL December 31, 2017 to 2020
Indicates the promptness of payment to suppliers by the firm.
PT in Days= Days in the Year/Payable Turnover= 465/5.49= 84.69 days For DPL December 31, 2017 to 2020
Average number of days that payables are outstanding
Inventory Turnover= Cost of Goods Sold/Inventory= 5964/379= 15.74 tk For DPL December 31, 2017 to 2020
Indicates the effectiveness of the inventory management practices of the firm.
Activity Ratio Comparisons Inventory Turnover Ratio
Year DPL LPIL
2017 14.42 11.54
2018 17.59 20.71
2019 17.37 16.96
2020 18.76 18.98
DPL has a very poor inventory turnover ratio
©Daffodil International University 23 | P a g e Activity Ratios
Total Asset Turnover=Net Sales/Total Assets= 8144.32/3021.20= 2.69tk
For DPL December 31, 2017 to 2020
Indicates the overall effectiveness of the firm in utilizing its assets to generate sales
Activity Ratio Comparisons
Total Asset Turnover Ratio
Year DPL LPIL
2017 2.18 1.82
2018 2.0 2.29
2019 2.72 2.64
2020 2.97 2.86
DPL has a weak total asset turnover ratio.
2.0 2.5 3.0 3.5 4.0
19X1 19X2 19X3
R ati o V al u e
Analysis Year
Trend Analysis of Inventory Turnover Ratio
BW
Indust
ry
©Daffodil International University 24 | P a g e Profitability Ratios
Gross Profit Margin= Gross Profit/Net Sales= 681.79/ 6144.32= .11 For DPL December 31, 2017 to 2020
Indicates the efficiency of operations and firm pricing policies.
Profitability Ratio Comparisons
Gross Profit Margin
Year BW Industry
2017 11.09% 15.00%
2018 11.84% 13.99%
2019 8.98% 13.13%
2020 10.09% 12.86%
DPL has a weak Gross Profit Margin
Trend Analysis of Gross Profit Margin
25.0 27.5 30.0 32.5 35.0
19X1 19X2 19X3 Analysis Year
Ra tio V alue (% ) BW
Industry
©Daffodil International University 25 | P a g e Profitability Ratios
Net Profit Margin= Net Profit after Tax/ Net Sales= 302.10/6346.32= .047 For DPL December 31, 2017 to 2020
Indicates the firm’s profitability after taking account of all expenses and income taxes.
Profitability Ratio Comparisons
Net Profit Margin
Year DPL LPIL
2017 4.8% 6.61%
2018 6.60% 5.37%
2019 4.12% 4.66%
2020 5.78% 6.01%
DPL has a poor Net Profit Margin
©Daffodil International University 26 | P a g e
Trend Analysis of Net Profit Margin
4 5 6 7 8 9 10
19X1 19X2 19X3 Analysis Year
Ra tio V alue (% ) BW
Industry
Return on Investment= Net Profit after Taxes/Total Assets= 310.2/2985=.10tk For DPL December 31, 2017 to 2020
Indicates the profitability on the assets of the firm (after all expenses and taxes).
Return on Investment
Year DPL LPIL
2017 10% 12.9%
2018 13.2% 12.65%
2019 11.12% 12.35%
2020 12.45% 12.94%
DPL has a poor Return on Investment
©Daffodil International University 27 | P a g e
Trend Analysis of Return on Investment
4 6 8 10 12
19X1 19X2 19X3 Analysis Year
R ati o Val u e (%)
BW
Industry
Profitability Ratios
Return on Equity= Net Profit after Taxes/Shareholders’ Equity= 395.1/290= 1.36 For DPL December 31, 2017 to 2020
Indicates the profitability to the shareholders of the firm (after all expenses and taxes).
Profitability Ratio Comparisons
Return on Equity
Year DPL LPIL
2017 1.28 1.44
2018 1.30 1.26
2019 1.06 0.5
2020 1.40 1.8
LPIL has a poor Return on Equity
©Daffodil International University 28 | P a g e
Trend Analysis of Return on Equity
7.0 10.5 14.0 17.5 21.0
19X1 19X2 19X3 Analysis Year
Ra tio V alue (% ) BW
Industry
3.7 Summary of Ratio Analyses
Inventories are too high.
May be paying off creditors (accounts payable) too soon.
COGS may be too high.
Selling, general, and administrative costs may be too high
3.8 Summary of the Profitability Trend Analyses
The profitability ratios for DPL have ALL been falling since 2017. Each has been below the LPIL averages for the past three years.
This indicates that COGS and administrative costs may both be too high and a potential problem for DPL.
Note, this result is consistent with the low interest coverage ratio.
©Daffodil International University 29 | P a g e Common-size Analysis
An analysis of percentage financial statements where all balance sheet items are divided by total assets and all income statement items are divided by net sales or revenues.
©Daffodil International University 30 | P a g e
DPL’ Common Size Balance Sheets
DESHBONDU POLYMER LTD Common Size Balance Sheet( Asses Side
Particulars
Regular (Lac of BDT) Common-Size %
2017 2018
2,019 2020 2017 2018
2019 2020
Fixed Assets at Cost
750 785
780 788
26.62
27.93
27.84 28.12
Less: Accumulated Depreciation
123 110
99 109
4.37
3.91
3.53 3.76
Net Fixed Assets
627 675
681 696
22
24
24 24
Current Assets
2,190 2,136
2,121 2,231 77.74
75.99
75.70 78.20
Cash & bank balance
102 101
99 106
3.62
3.59
4 4.12
Accounts Receivable
530 575
500 576
18.81
20
17.84 19.31
Inventories
379 275
389 398
13.45
10
14 14.46
Prepared Exp
122 120
35 85
4.33
4.27
1 4.13
Accum Tax prepared
36 43
46 48
1.28
2
2 2.3
Investment LT
977 977
967 987
34.68
35
35 36
Others Asstes
44 45
86 93
2
1.60
3 3.66
TOTAL ASSETS
2,817 2,811
2,802 2918
100
100
100 100
©Daffodil International University 31 | P a g e DESHBONDU POLYMER LTD
Common Size Balance Sheet (Liabilities Side)
Regular (Lac of BDT) Common-Size %
SHAREHOLDERS' EQUITY AND
LIABILITIES: 2017 2018 2,019 2020 2017 2018 2019 2020
Shareholders' Equity: 230 285 295 302 8.17 10 10.53 11
Com. Stock 35 35 35 35 1 1 1.25 1.67
Paid up Capital 25 25 25 25 1 1 0.89 1
Retained Earnings 170 225 235 241 6 8.00 8.39 7.98
Non-Current
Liabilities: 42 32 28 31 1.49 1 1.00 1.06
Long Term Debts 33 33 33 33 1 1 1.18 1.67
Current Liabilities: 2,545 2,494 2,479 2548 30 88.72 88.47 89.13
Bank Liabilities 1,804 1,846 1,891 809 64.04 65.67 67 66
Income Tax Payable 83 93 95 97 3 3 3 3
Notes Payable 49 49 85 91 2 2 3 3
Accounts Payable 608 506 408 476 22 18 15 19
TOTAL S: E: AND
LIABILITIES 2,817 2,811 2,802 2918 100 100 100 100
©Daffodil International University 32 | P a g e
DPL’ Common Size Balance Sheets
DESHBONDU POLYMER LTD Indexed Balance Sheet( Asses Side)
Particulars Regular (Lac of BDT) Indexed %
2017 2018 2,019 2020 2017 2018 2019 2020
Fixed Assets at
Cost 750 785 780 791
100 105 104 106
Less: Accumulated
Depreciation 123 110 99 101
100 89 80 89
Net Fixed Assets
627 675 681 690 100 2 4 4
Current Assets
2,190 2,136 2,121 2453 100 98 97 96
Cash & bank
balance 102 101 99 103
100 99 97 96
Accounts
Receivable 530 575 500 543
100 108 94 100
Inventories 379 275 389 397
100 73 103 100
Prepared Exp 122 120 35 87
100 98 29 88
Accum Tax
prepared 36 43 46 49
100 119 128 125
Investment LT 977 977 967 981
100 100 99 100
Others Asstes 44 45 86 81
100 101 195 195
TOTAL ASSETS
2,817 2,811 2,802 2918 100 4 4 4
©Daffodil International University 33 | P a g e Index Analyses
An analysis of percentage financial statements where all balance sheet or income statement figures for a base year equal 100.0 (percent) and subsequent financial statement items are expressed as percentages of their values in the base year.
©Daffodil International University 34 | P a g e DPL’ Indexed Balance Sheets
Particulars
Regular (Lac of BDT) Indexed %
2017 2018 2019 2020 2017 2018 2,019 2020
Fixed Assets
at Cost 750 785 780 789 100 105 104 106
Less: Acc:
Depreciation 123 110 99
109
100 89 80 88
Net Fixed
Assets 627 675 681 680 100 2 4 38
Current
Assets 2,190 2,136 2,121 2213 100 98 97 102
Cash & bank
balance 102 101 99
103
100 99 97 93
Accounts
Receivable 530 575 500
529
100 108 94 103
Inventories 379 275 389
376
100 73 103 98
Prepared
Exp 122 120 35
63
100 98 29 32
Accum Tax
prepared 36 43 46
48
100 119 128 134
Investment
LT 977 977 967
986
100 100 99 106
Others
Asstes 44 45 86
89
100 101 195 189
TOTAL
ASSETS 2,817 2,811 2,802 2876 100 4 4 56
©Daffodil International University 35 | P a g e DPL Indexed Balance Sheets
DESHBONDU POLYMER LTD Indexed Balance Sheet (Liabilities Side)
Particular’s
Regular (Lac of BDT) Indexed %
S: E: AND
LIABILITIES: 2017 2018 2019 2020 2017 2018 2019
2020
Shareholders'
Equity: 230 285 295 290 100 124 128 124
Com. Stock 35 35 35 35 100 100 100 100
Paid up
Capital 25 25 25 25 100 100 100 100
Retained
Earnings 170 225 235 241 100 132 138 130
Non-Current
Liabilities: 42 32 28 30 100 76 67 63
Long Term
Debts 33 33 33 33 100 101 101 104
Current
Liabilities: 2,545 2,494 2,479 2392 100 98 97 91
Bank Liabilities 1,804 1,846 1,891 1,882 100 102 105 103
Income Tax
Payable 83 93 95
96
100 112 114
117
Notes Payable 49 49 85 78 100 100 173
167
Accounts
Payable 608 506 408
431
100 83 67
71
TOTAL SHAREHOLDER S' EQUITY AND
LIABILITIES 2,817 2,811 2802
2876 100 10 10 12
©Daffodil International University 36 | P a g e
4.1 Findings
I have worked for 4month in the organization In Accounting section. After analyzing the financial performance analysis of Lira Group LTD and during the organizational attachment of internship program the following findings have been found out-
After analyzing through a few factors, it tends to be assumed that the year 2020 was not so decent enough for Lira Group Ltd as the greater part of the ratio showed a few unfortunate performances.
Interest coverage ratio in 2017 was 8.93 which is higher than other years. The interest coverage ratio is decrease in every year and the lowest ratio in 2020 which was 5.45
Liquidity ratio in 2017 the ratio was o.87 which is lower than the other years. These ratio increase every year and only decrease in 2019 which was 0.85.The highest ratio in 2020 which was o.96
Gross profit margin in 2017 the gross profit margin 15.00% which is the higher than the other years. Every year the ratio was decrease and in 2020 the ratio was lower which was12.86%. the Weak gross profit margin
The profitability ratios in 2017 the ratio was 1.44 which is increase than the previous 2years and the lower ratio was 2019 which was 0.5 and the highest ratio in 2020 which was 1.8 it was increase than the previous years.
©Daffodil International University 37 | P a g e
1. Recommendation
After analyzing the overall financial performance of Lira Group recommendation for its finding might be useful for the organization and these help to improve the organization for its better. Some recommendation is given below,
Lira Group LTD should provide Diller in overall country to increase the sell and profit.
The profitability ratio in not enough well so take the correct steps to increase it.
Consistently the business condition is varying. Thus the organization must be created as a unique association to adjust through the shifting situation.
Should increase the investment and try to pay the loan so that the interest amount decrease and the profit increase.
The EPS, EAT and RE are not at satisfactory level the administration should concentrate on keeping up the development the pattern.
4.3 Conclusion
Overall internship program really great experience for me. I have learn the real life corporate experience for these internship. In my working time I have enjoyed the overall working process and the employees of lira group are very helpful to me. These experience help me to build up my corporate career.
The financial performance of this organization are not possible to express perfectly in these limited time but try my best to analyze these. The employee of Lira group especially GM thanks for provide me the data and give me these opportunities. The employees of Lira Group always think about the benefit of the organization. The accounts department of this organization are very structured, controllable and restricted.
Thanks my honorable teachers for giving me these opportunities for gaining the real life corporate experience. In future these knowledge help me to build up my career.